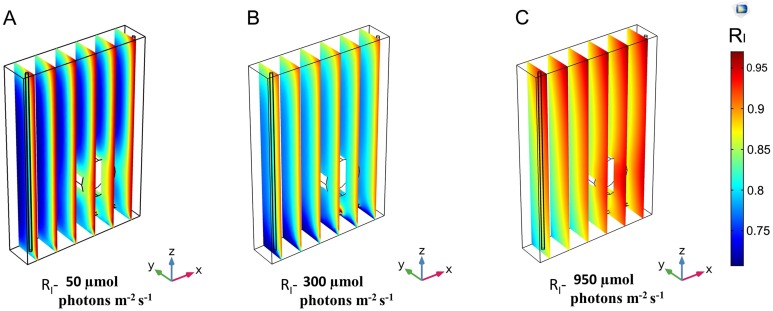
Figure 4. 3D trend of normalized light intensity along YZ slices of the model PBR.
The calculated light intensity was normalized with respect to the initial incident intensity and the RI trend is performed along six YZ planes for three different incident light intensities, Iinc. (A) 50 μmol photons m−2 s−1. (B) 300 μmol photons m−2 s−1. (C) 950 μmol photons m−2 s−1.

