

Abstract
Huntington's disease (HD) is a fatal neurodegenerative disorder caused by an abnormal expansion of polyglutamine repeats in the huntingtin protein (Htt). Transcriptional dysregulation is an early event in the course of HD progression and is thought to contribute to disease pathogenesis, but how mutant Htt causes transcriptional alterations and subsequent cell death in neurons is not well understood. RNA-Seq analysis revealed that expression of a mutant Htt fragment in primary cortical neurons leads to robust gene expression changes before neuronal death. Basic helix-loop-helix transcription factor Twist1, which is essential for embryogenesis and is normally expressed at low levels in mature neurons, was substantially up-regulated in mutant Htt–expressing neurons in culture and in the brains of HD mouse models. Knockdown of Twist1 by RNAi in mutant Htt–expressing primary cortical neurons reversed the altered expression of a subset of genes involved in neuronal function and, importantly, abrogated neurotoxicity. Using brain-derived neurotrophic factor (Bdnf), which is known to be involved in HD pathogenesis, as a model gene, we found that Twist1 knockdown could reverse mutant Htt–induced DNA hypermethylation at the Bdnf regulatory region and reactivate Bdnf expression. Together, these results suggest that Twist1 is an important upstream mediator of mutant Htt–induced neuronal death and may in part operate through epigenetic mechanisms.
Keywords: neurodegeneration, neurodegenerative disease, Huntington disease, transcription factor, gene expression, brain-derived neurotrophic factor (BDNF), DNA methylation, primary neurons, RNA-Seq, transcriptional dysregulation, Twist1
Introduction
Huntington's disease (HD)2 is an invariably fatal, autosomal-dominant genetic disorder characterized by progressive loss of selective neurons in the striatum and cortex (1, 2). Although HD is known to be caused by abnormal expansion of polyglutamine repeats in huntingtin (Htt) (3), how the toxic mutant protein drives neuronal dysfunction and death remains poorly understood, and currently, no disease-modifying treatment exists for this disease. Transcriptional dysregulation is an early abnormality in the course of HD progression and has been suggested to play an important role in HD pathogenesis (4–6). However, how mutant Htt induces transcriptional alterations and the identity of functionally relevant genes, which contribute to neuronal death, remain largely unknown.
Several potential mechanisms have been proposed to underlie transcriptional dysregulation in HD neurons, including altered activities of transcription factors, coactivators, or corepressors by aberrant binding to or sequestration by mutant Htt protein (4, 7–10). More recently, studies using cell and mouse models of HD have shown that mutant Htt expression may modify chromatin structure via perturbations in several epigenetic pathways, including DNA methylation, histone acetylation, and histone H3 lysine 4 trimethylation (H3K4me3), through mechanisms that are incompletely understood (11–16). The direct binding of mutant Htt to genomic DNA may also affect gene expression (17). These mechanisms may not be mutually exclusive and may cooperate to induce transcriptional alterations observed in HD. However, which mechanisms are dominant in HD neurodegeneration remains unknown.
DNA methylation (5-methylcytosine) at CpG sites is a well-characterized epigenetic modification catalyzed by DNA methyltransferases (DNMTs), and hypermethylation of gene promoters generally triggers gene silencing (18–20). Dysregulation of DNA methylation has recently been demonstrated in cell and mouse models of HD (12, 21, 22). Our recent study showed that both pharmacological and genetic inhibition of DNMTs dramatically protect primary cortical and striatal neurons from mutant Htt–induced cytotoxicity (21). Moreover, DNMT inhibition in culture or mouse models of HD rescued the expression of key down-regulated genes, which are also decreased in the brains of HD patients, including brain-derived neurotrophic factor (Bdnf) and striatum-enriched genes, such as Ppp1r1b, Drd2, Adora2a, and Rasd2 (21). BDNF is a major neurotrophic factor involved in a number of fundamental processes in the brain, including neuronal survival, synaptic plasticity, and learning and memory (23, 24). The reduced expression of Bdnf in the brain of HD patients and mouse models has been suggested to play a critical role in HD pathogenesis (23, 25–27). Indeed, restoration of BDNF in cell and mouse models has been shown to improve HD phenotypes (21, 25, 28–31). Consistent with the inhibition of Bdnf expression, mutant Htt–expressing cortical neurons showed increased levels of Bdnf promoter methylation (21). These observations strongly suggest that aberrant DNA methylation plays a functionally important role in HD neurons.
N-terminal fragments of mutant Htt, including mutant Htt exon-1 protein, are known to be more cytotoxic and prone to aggregation compared with the full-length protein and are expressed in brains of HD patients (32–37). These fragments can be generated by proteolytic cleavage of the full-length protein in cells (33–38). It has also recently been demonstrated that mutant Htt exon-1 fragment can be generated by abnormal alternative splicing in HD (32).
In this report, we identify mutant Htt (exon 1)–induced genome-wide transcriptome changes in cortical neurons, a vulnerable neuronal type in HD. Among altered genes, we focused on basic helix-loop-helix (bHLH) transcription factor Twist1, which is significantly up-regulated by mutant Htt expression in neurons. Whereas the function of Twist1 has been well studied in embryogenesis and cancer metastasis (39, 40), its role in neurodegeneration has not been explored. Here we demonstrate that Twist1 plays a causal role in mutant Htt–induced cytotoxicity in neurons and provide evidence that Twist1 alters neuronal gene expression in HD potentially through epigenetic regulation, providing new insight into the function of Twist1 in postmitotic neurons.
Results
Mutant Htt induces marked transcriptional changes in primary cortical neurons
HD brain pathology primarily involves the striatum and cerebral cortex. Studies with HD patients and animal models demonstrate progressive atrophy of the cerebral cortex and dysfunction of corticostriatal synapses (1, 41–44), highlighting the important contribution of cortical neuron dysfunction in HD. We previously described a physiologically relevant primary cortical neuron model of HD (21, 45). In this system, a neuropathogenic fragment of mutant Htt, the exon 1–encoded N-terminal fragment with a 72-polyglutamine (polyQ) repeat (Htt-72Q), versus WT Htt with a 25-polyQ repeat (Htt-25Q), is expressed in mouse primary cortical neurons by lentivirus (Fig. 1A). In contrast to the diffuse cytosolic localization of WT Htt, accumulation of aggregated mutant Htt was observed preferentially in the nucleus by immunofluorescence (Fig. 1B). Consistently, immunoblot analysis with Htt-72Q–expressing neurons showed aggregated high-molecular weight mutant protein (Fig. 1C). Our previous studies have shown that expression of mutant, but not WT, Htt significantly reduced neuronal viability compared with that of control empty vector (21, 45).
Figure 1.

Mutant Htt triggers transcriptional dysregulation in primary cortical neurons. A, mouse primary cortical neuron model of HD. The N-terminal exon-1 fragment of mutant Htt (Htt-72Q) or WT Htt (Htt-25Q) was lentivirally expressed in primary cortical neurons. A timeline of experiments using this culture system is shown. B, primary cortical neurons transduced with Htt lentivirus as in A were fixed at 9 days postinfection and subjected to immunofluorescence with anti-Htt antibody. Nuclei were labeled with Hoechst 33342. Bar, 100 μm. C, primary cortical neurons transduced with Htt-expressing lentivirus as in A were directly harvested in SDS sample buffer at 7 days postinfection. The whole-cell lysates were subjected to immunoblotting with anti-Htt antibody. Blot was reprobed with anti-β-actin antibody. Htt-72Q–expressing neurons showed aggregated high-molecular weight mutant Htt in a stacking gel (*). D, primary cortical neurons transduced with Htt–expressing lentivirus as in A were subjected to MTS assay at 5, 7, and 9 days postinfection. MTS-reducing activity was normalized to Htt-25Q lentivirus (= 1) for each time point. Htt-72Q–expressing neurons showed progressive neuronal death. Significantly decreased cell viability was observed at 7 and 9 days, but not 5 days, postinfection (unpaired t test; *, p < 0.0001 compared with Htt-25Q, n = 10–15). Data represent mean + S.E. (error bars). E, RNA was harvested from primary cortical neurons infected with Htt-25Q–, Htt-72Q–, or control empty vector–expressing lentivirus at 5 days postinfection as in A and subjected to RNA-Seq analysis. Cultures from four independent experiments were used. MA plots show log2FC against log2CPM, and each dot represents a gene. Red dots represent differentially expressed genes, 1391 up- and 2314 down-regulated genes (FDR < 0.05), in Htt-72Q–expressing neurons compared with Htt-25Q–expressing neurons (left). RNA expression in Htt-25Q–expressing neurons was not significantly different from that of control vector (right). FC, -fold change. F and G, GO enrichment analyses of differentially expressed genes obtained by RNA-Seq analysis with the primary cortical neuron model of HD. Top-enriched GO biological processes (F) and molecular function (G) for up-regulated genes (log2FC > 0.5, FDR < 0.05) and down-regulated (log2FC < 0.5, FDR < 0.05) in Htt-72Q-expressing neurons were determined using DAVID bioinformatics resources. A complete list of GO terms can be found in Table S2.
To identify critical gene expression changes associated with mutant Htt expression in neurons, RNA-Seq analysis was performed using RNA samples prepared from cortical neurons at 5 days following Htt virus infection (DIV 10), a time when neurons do not yet show mutant Htt–induced changes in viability (Fig. 1D). We identified marked transcriptional changes, with 1391 up-regulated and 2314 down-regulated genes (FDR < 0.05), in mutant Htt-72Q–expressing neurons compared with WT Htt-25Q–expressing neurons (Fig. 1E and Table S1). The transcriptome of Htt-25Q–expressing neurons was not significantly different from control neurons transduced with empty-vector lentivirus (Fig. 1E). To gain insight into pathways that are potentially affected by mutant Htt, we performed gene ontology (GO) enrichment analyses using the DAVID functional classification tool (Fig. 1, F and G) (46). The differentially expressed genes in mutant Htt–expressing cortical neurons (|log2FC| > 0.5, FDR < 0.05) were associated with a number of specific biological processes and molecular function (Fig. 1 (F and G) and Table S2). In particular, up-regulated genes were associated with biological processes, including regulation of transcription, and down-regulated genes were associated with biological processes relevant to brain and nervous system function, including nervous system development, axon guidance, cell adhesion, and synaptic transmission (Fig. 1F). Molecular function analysis revealed that up-regulated genes were enriched in genes encoding transcriptional regulators, including sequence-specific DNA binding, transcriptional activator activity, and transcriptional factor activity (Fig. 1G). Down-regulated genes are enriched in genes related to calcium ion binding and ion channel activity (Fig. 1G). These results raise the interesting possibility that altered levels of transcriptional regulators represent an early event in the transcriptional dysregulation observed in mutant Htt–expressing neurons.
We next examined whether gene expression changes found in our cortical neuron system were observed in mouse and human HD brains in vivo in a previous study (11, 47, 48). Htt-72Q–expressing mouse primary cortical neurons and the cortex of R6/2 HD transgenic mice (11) shared 323 down-regulated and 45 up-regulated genes (FDR < 0.05) (Table S3). In addition, we found substantial overlap in differentially expressed genes between the Htt-72Q–expressing primary cortical neurons (FDR < 0.05) and human HD cortex in previous RNA-profiling studies: 286 down-regulated and 200 up-regulated genes in human HD prefrontal cortex (Brodmann area 9) from Vonsattel grade 3 and 4 HD patients (RNA-Seq analysis, FDR < 0.05) (47) and 175 down-regulated and 19 up-regulated genes in human HD frontal cortex (Brodmann area 4) from low Vonsattel grade 0–2 patients (microarray analysis, p < 0.001) (48) (Table S4). The differentially expressed genes in our neuron culture system also contain novel gene expression changes, which might represent potential candidates for neuron-specific changes missed in previous RNA profiling studies due to the presence of multiple cell types or loss of neurons in brain tissue. The top 30 down- and up-regulated genes (FDR < 0.05, average counts per million (CPM) > 0.5) from the total 3705-differentially expressed gene set identified in the primary neuron system are listed (Table 1). Together, these results demonstrate that the neuropathogenic Htt fragment induces cell-intrinsic gene expression changes, which recapitulate expression changes in the mouse and human HD brain in vivo.
Table 1.
Top up- and down-regulated genes in mutant Htt–expressing primary cortical neurons
Top 30 up- and down-regulated genes (FDR < 0.05, average CPM > 0.5) in Htt-72Q– versus Htt-25Q–expressing cortical neurons identified by RNA-Seq analysis are shown. The entire list of differentially expressed genes (FDR < 0.05) is found in Table S1.
| Ensembl gene ID | Gene symbol | -Fold change | FDR | Gene biotype |
|---|---|---|---|---|
| Up-regulated genes | ||||
| ENSMUSG00000027102 | Hoxd8 | 95.0 | 1.30E − 07 | protein_coding |
| ENSMUSG00000027833 | Shox2 | 58.8 | 6.18E − 08 | protein_coding |
| ENSMUSG00000054667 | Irs4 | 37.1 | 1.39E − 05 | protein_coding |
| ENSMUSG00000078302 | Foxd1 | 35.8 | 2.30E − 06 | protein_coding |
| ENSMUSG00000028825 | Rhd | 33.3 | 2.80E − 04 | protein_coding |
| ENSMUSG00000020875 | Hoxb9 | 32.5 | 1.18E − 05 | protein_coding |
| ENSMUSG00000048349 | Pou4f1 | 29.2 | 2.01E − 06 | protein_coding |
| ENSMUSG00000026468 | Lhx4 | 27.9 | 5.57E − 06 | protein_coding |
| ENSMUSG00000040723 | Rcsd1 | 25.3 | 2.61E − 05 | protein_coding |
| ENSMUSG00000096257 | Ccer2 | 22.6 | 6.47E − 05 | protein_coding |
| ENSMUSG00000034777 | Vax2 | 22.2 | 3.87E − 05 | protein_coding |
| ENSMUSG00000049604 | Hoxb13 | 21.4 | 8.09E − 05 | protein_coding |
| ENSMUSG00000032318 | Isl2 | 18.8 | 1.55E − 05 | protein_coding |
| ENSMUSG00000024497 | Pou4f3 | 17.2 | 7.06E − 04 | protein_coding |
| ENSMUSG00000037188 | Grhl3 | 17.0 | 1.84E − 03 | protein_coding |
| ENSMUSG00000044303 | Cdkn2a | 16.6 | 6.54E − 05 | protein_coding |
| ENSMUSG00000031212 | Pgr15l | 16.5 | 8.52E − 06 | protein_coding |
| ENSMUSG00000010476 | Ebf3 | 16.4 | 1.98E − 06 | protein_coding |
| ENSMUSG00000085975 | Gm13572 | 15.9 | 1.84E − 04 | lincRNA |
| ENSMUSG00000038112 | AW551984 | 14.3 | 2.42E − 09 | protein_coding |
| ENSMUSG00000030230 | Plcz1 | 13.5 | 1.81E − 04 | protein_coding |
| ENSMUSG00000029032 | Arhgef16 | 13.3 | 2.13E − 03 | protein_coding |
| ENSMUSG00000037469 | Acp7 | 13.1 | 5.51E − 03 | protein_coding |
| ENSMUSG00000005251 | Ripk4 | 13.0 | 3.03E − 05 | protein_coding |
| ENSMUSG00000035799 | Twist1 | 12.6 | 4.65E − 06 | protein_coding |
| ENSMUSG00000042812 | Foxf1 | 11.9 | 9.65E − 04 | protein_coding |
| ENSMUSG00000006445 | Epha2 | 11.1 | 2.50E − 03 | protein_coding |
| ENSMUSG00000090861 | Arf4os | 11.0 | 4.66E − 03 | antisense_RNA |
| ENSMUSG00000027684 | Mecom | 9.8 | 1.09E − 02 | protein_coding |
| ENSMUSG00000028717 | Tal1 | 9.7 | 3.69E − 08 | protein_coding |
| Down-regulated genes | ||||
| ENSMUSG00000070719 | Pla2g4d | 0.02 | 1.43E − 07 | protein_coding |
| ENSMUSG00000046922 | Gpr6 | 0.05 | 4.65E − 08 | protein_coding |
| ENSMUSG00000085905 | Gm14273 | 0.06 | 3.66E − 05 | antisense_RNA |
| ENSMUSG00000078958 | Atp6ap1l | 0.07 | 9.02E − 05 | protein_coding |
| ENSMUSG00000048776 | Pthlh | 0.08 | 3.68E − 05 | protein_coding |
| ENSMUSG00000039059 | Hrh3 | 0.09 | 1.66E − 07 | protein_coding |
| ENSMUSG00000013846 | St3gal1 | 0.10 | 1.16E − 07 | protein_coding |
| ENSMUSG00000027435 | Cd93 | 0.10 | 6.80E − 05 | protein_coding |
| ENSMUSG00000078945 | Naip2 | 0.10 | 3.65E − 04 | protein_coding |
| ENSMUSG00000032128 | Robo3 | 0.11 | 1.58E − 05 | protein_coding |
| ENSMUSG00000043932 | Klri2 | 0.11 | 5.92E − 04 | protein_coding |
| ENSMUSG00000038530 | Rgs4 | 0.11 | 3.49E − 09 | protein_coding |
| ENSMUSG00000090061 | Nwd2 | 0.11 | 1.96E − 09 | protein_coding |
| ENSMUSG00000032033 | Barx2 | 0.12 | 5.67E − 06 | protein_coding |
| ENSMUSG00000097892 | Gm26801 | 0.13 | 1.28E − 03 | antisense_RNA |
| ENSMUSG00000084946 | Dlx1as | 0.13 | 2.37E − 02 | antisense_RNA |
| ENSMUSG00000026344 | Lypd1 | 0.13 | 1.13E − 07 | protein_coding |
| ENSMUSG00000042351 | Grap2 | 0.13 | 1.36E − 03 | protein_coding |
| ENSMUSG00000097182 | A830009L08Rik | 0.13 | 2.75E − 04 | lincRNA |
| ENSMUSG00000046808 | Atp10d | 0.13 | 7.51E − 07 | polymorphic_pseudogene |
| ENSMUSG00000027401 | Tgm3 | 0.13 | 1.14E − 06 | protein_coding |
| ENSMUSG00000021765 | Fst | 0.13 | 1.85E − 05 | protein_coding |
| ENSMUSG00000063260 | Syt10 | 0.13 | 6.39E − 08 | protein_coding |
| ENSMUSG00000044447 | Dock5 | 0.14 | 4.91E − 07 | protein_coding |
| ENSMUSG00000092569 | Gm20544 | 0.14 | 6.60E − 03 | processed_transcript |
| ENSMUSG00000027400 | Pdyn | 0.14 | 9.62E − 03 | protein_coding |
| ENSMUSG00000014782 | Plekhg4 | 0.14 | 3.88E − 03 | protein_coding |
| ENSMUSG00000050157 | Gm867 | 0.14 | 3.59E − 04 | protein_coding |
| ENSMUSG00000035357 | Pdzrn3 | 0.14 | 3.18E − 08 | protein_coding |
| ENSMUSG00000037362 | Nov | 0.14 | 1.96E − 09 | protein_coding |
Mutant Htt triggers up-regulation of multiple transcription factors in cortical neurons
As shown by GO analysis (Fig. 1 (F and G) and Table S2), the up-regulated genes in mutant Htt–expressing cortical neurons were enriched in genes encoding transcriptional regulators. These results suggest that aberrant expression of these factors might further amplify the ongoing transcriptional dysregulation in mutant Htt–expressing neurons. We found that genes encoding transcription factors, including forkhead box D1 (Foxd1), POU domain, class 4, transcription factor 1 (Pou4f1 or Brn3a), Twist1, and several homeobox genes, such as Hoxd8, Hoxb9, and LIM homeobox 4 (Lhx4), are substantially up-regulated in mutant Htt–expressing cortical neurons (Table 1). Interestingly, these highly up-regulated transcription factors are known to play a critical role in cell fate determination and/or differentiation during embryonic development (39, 40, 49–53).
To better understand the molecular pathways underlying mutant Htt–induced neurotoxicity, we performed higher-order transcriptional regulatory network analysis of the whole transcriptome data as described previously (54) and identified gene regulatory pathways that are specific to mutant Htt. The core regulatory network was assembled using the knowledge-based GeneGO MetaCore database from 1217 differentially expressed genes between Htt-72Q– and Htt-25Q–expressing cortical neurons in RNA-Seq analysis (genes with FDR < 0.05, |log2FC| > 1, and average CPM > 0.5 from Table S1) and was composed of 13 transcription factors (TFs) (|log2FC| > 1.5) that interact with one or more TFs and 20 target genes that are regulated by at least two of the 13 TFs, with a total of 77 interactions (Fig. 2 and Table S5). The network analysis provided potential transcription factors and targets that may be involved in mutant Htt–induced neurotoxicity. In particular, up-regulated transcription factors Ar, Twist1, Wt1, and Tal1 exhibit a high number of interactions with other genes in the network (Fig. 2 and Table S5), suggesting that these factors may be important upstream transcriptional regulators associated with mutant Htt. Among these genes, the levels of Twist1 transcript were most robustly altered in Htt-72Q–expressing neurons: 12.6-fold compared with Htt-25Q–expressing neurons (Table 1 and Table S1), suggesting a critical contribution of Twist1 to mutant Htt–induced gene expression changes.
Figure 2.

Transcriptional regulatory network of mutant Htt–expressing cortical neurons. A mutant Htt–associated transcriptional network was generated from differentially expressed genes (FDR < 0.05, average CPM > 0.5) identified by RNA-Seq analysis with the primary cortical neuron model of HD, using GeneGo MetaCore as described under “Experimental procedures.” 77 interactions with 13 transcription factors (oval, |log2FC| > 1.5) and 20 targets (box, |log2FC| > 1) are shown. The connections between genes represent transcriptional regulation, protein binding, or posttranslational modification (phosphorylation). Color denotes log2FC. See also Table S5.
Increased Twist1 expression in HD in vivo
Twist1 is a bHLH transcription factor that is known to play an important role during development and in cancer, but its role in postmitotic neurons is unknown. In addition to the primary neuron system, marked elevation of Twist1 mRNA has also been observed in the cortex of HD patients in recent RNA-profiling analyses (47). We additionally verified this increase in Twist1 expression in the brains of two different HD mouse models: in the forebrain of early disease stage (6-week-old) R6/2 mice expressing the N-terminal exon-1 fragment of mutant Htt (55) and in the cortex and striatum of zQ175 knock-in mice expressing full-length mutant Htt (56) (Fig. 3, A–C). The increase of Twist1 transcript in these mouse models was observed in the context of decreased levels of cortical early growth response 3 (Egr3) and Bdnf and striatal Drd2 and Ppp1r1b transcripts, which are known to be down-regulated in patients and mouse models of HD (Fig. 3, A–C). zQ175 homozygous mice showed a higher degree of alterations in these transcripts compared with heterozygous littermates (Fig. 3, B and C). Consistent with the elevated RNA expression, increased Twist1 protein levels were observed in HD mice by immunoblotting using early to mid-stage R6/2 forebrain (Fig. 3D). Together, these results support the idea that elevated Twist1 expression in neurons might play a role in HD pathogenesis.
Figure 3.
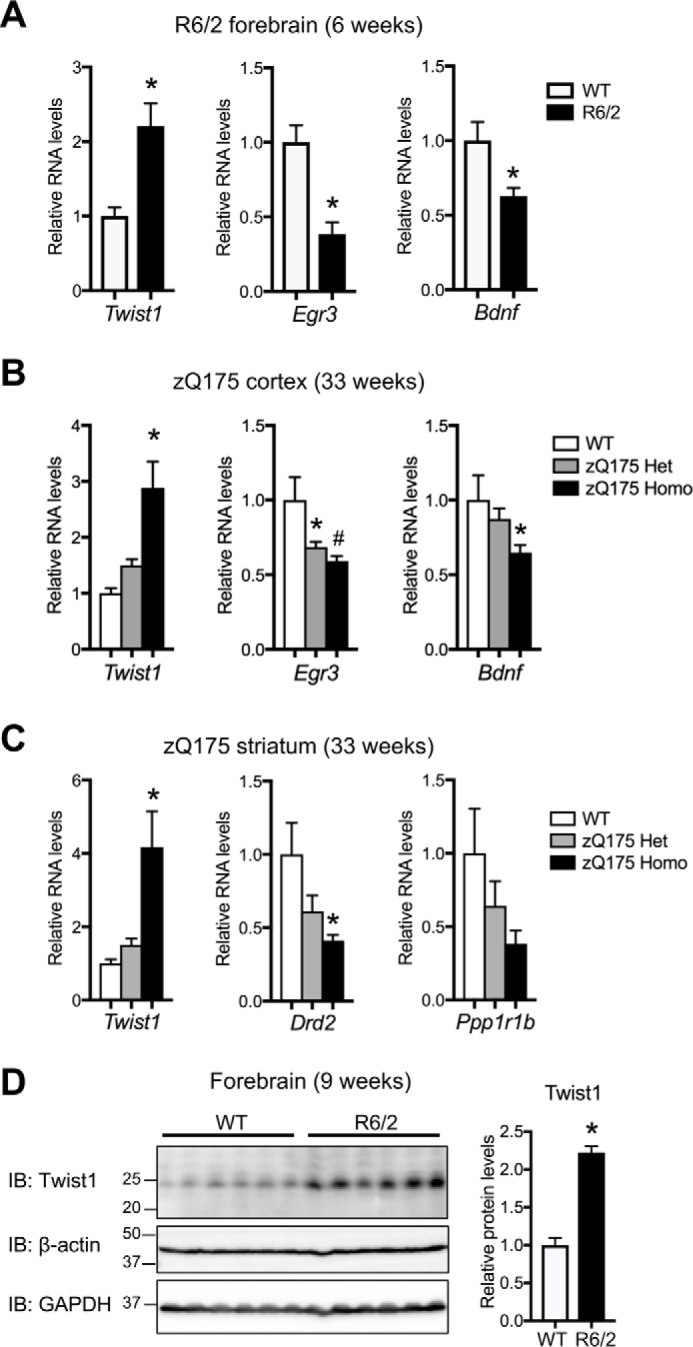
Increased Twist1 gene expression in mouse models of HD. A, qRT-PCR analysis was performed using RNA prepared from 6-week-old R6/2 HD and control WT mouse forebrains (n = 6 (3 males, 3 females)/group). β-actin and Hprt were used as reference genes. Twist1 RNA was up-regulated in R6/2 compared with WT mice (unpaired t tests; *, p = 0.0043). Egr3 and Bdnf (exon IX, protein coding) RNAs were down-regulated in R6/2 compared with WT mice (unpaired t tests; *, p = 0.0013 for Egr3; *, p = 0.022 for Bdnf). B and C, qRT-PCR analysis was performed using RNA prepared from 33-week-old zQ175 heterozygous (Het), homozygous (Homo), and control WT mouse cortex (B) and striatum (C) (n = 6 (3 males and 3 females) for zQ175 heterozygous and homozygous; n = 7 (4 males and 3 females) for WT). Twist1 RNA was up-regulated in the cortex and striatum of zQ175 mice compared with those of WT (ANOVA; *, p = 0.0001 in B; *, p = 0.0007 in C). Egr3 and Bdnf (exon IX, protein coding) RNAs were down-regulated in the cortex of zQ175 compared with WT mice (ANOVA; *, p = 0.042; #, p = 0.011 for Egr3; *, p = 0.047 for Bdnf) (B). Drd2 mRNA was down-regulated in zQ175 striatum compared with WT control (ANOVA; *, p = 0.014) (C). A trend toward decreased expression of Ppp1r1b in zQ175 mice (zQ175 homozygous compared with WT; p = 0.063) (C). D, immunoblot analysis (IB) was performed using forebrain lysates prepared from 9-week-old R6/2 HD and control WT mice (n = 6 (3 males, 3 females)/group). Twist1 band intensity was quantified by densitometry (ImageJ) and normalized to that of GAPDH. Twist1 protein expression was increased in R6/2 compared with WT mice (unpaired t tests; *, p < 0.0001). Data represent mean + S.E. (error bars) in A–D.
Twist1 is required for mutant Htt–induced neurotoxicity
To understand the role of Twist1 in mutant Htt–induced neurotoxicity, we next tested whether decreased Twist1 expression by lentivirus-mediated RNAi can attenuate cell death in our cortical neuron model of HD. Along with Twist1, we tested the effect of Pou4f1 RNAi because Pou4f1, like Twist1, is up-regulated not only in our neuron culture system but also in vivo in the brains of human and mouse HD (Table 1 and Tables S1, S3, and S4) (11, 47, 48, 57). Validation experiments using quantitative RT-PCR (qRT-PCR) confirmed increased levels of Twist1 and Pou4f1 mRNA in mutant Htt–expressing cortical neurons (Fig. 4, A and B). Consistently, immunoblot analysis demonstrated increased levels of endogenous Twist1 protein by mutant Htt (Fig. 4C). The efficient reduction of Twist1 protein and RNA by two different Twist1 shRNAs was confirmed in mutant Htt-72Q–expressing neurons (Fig. 4, C and D). Remarkably, Twist1 RNAi increased the viability of mutant Htt-72Q–expressing neurons to that of Htt-25Q–expressing neurons (Fig. 4E). To demonstrate the specificity of the Twist1 RNAi phenotype, we performed a rescue experiment using a mutant Twist1 cDNA (herein Twist1-Res), which harbors nine-base mismatches within the sequence targeted by Twist1 RNAi 2, rendering it insensitive to the RNAi. The neuroprotection conferred by Twist1 knockdown in Htt-72Q–expressing neurons was reversed by co-expression of Twist1-Res, demonstrating the specificity of the Twist1 RNAi phenotype (Fig. 4F). These results suggest that Twist1 plays an important role in mutant Htt–induced neuronal death. By contrast, knockdown of Pou4f1 did not protect neurons against Htt-72Q–induced toxicity and in fact decreased the viability of Htt-25Q–expressing neurons (Fig. 4, G and H). These results suggest that Pou4f1 is required for the survival of normal cortical neurons and that up-regulation of this transcription factor by mutant Htt may represent a compensatory mechanism.
Figure 4.

Twist1 knockdown protects neurons from mutant Htt–induced toxicity in primary cortical neurons. A, DIV 5 cortical neurons were transduced with Htt- or control (vector)-expressing lentivirus. Five days later, RNA was prepared and subjected to qRT-PCR using β-actin and Hprt as reference genes. Twist1 was up-regulated by Htt-72Q expression (ANOVA; *, p = 0.0083 compared with Htt-25Q, n = 3). B, qRT-PCR was performed using RNA prepared as in A. Pou4f1 was up-regulated by Htt-72Q expression (ANOVA; *, p < 0.0001 compared with Htt-25Q, n = 4). C, primary cortical neurons were transduced with Htt-expressing lentivirus along with Twist1 shRNA (1 or 2) or control luciferase (Ctrl) shRNA lentivirus at DIV 5. Five days later, cell lysates were prepared and subjected to immunoblotting (IB) with anti-Twist1 antibody. Blot was reprobed with anti-β-actin antibody. Mutant Htt increased the levels of Twist1 protein. Knockdown of Twist1 using two different shRNAs was confirmed. D, DIV 5 cortical neurons were transduced with Htt-72Q–expressing lentivirus along with Twist1 shRNAs (1 or 2) or control luciferase (Ctrl) shRNA lentivirus. Five days later, RNA was prepared and subjected to qRT-PCR analysis. Twist1 RNAi reduced the levels of Twist1 mRNA in mutant Htt–expressing neurons (ANOVA; *, p < 0.0001 compared with control RNAi, n = 6). E, DIV 5 cortical neurons co-transduced as in C were subjected to an MTS assay at 9 days postinfection. Knockdown of Twist1 in mutant Htt–expressing neurons was neuroprotective (ANOVA; *, p < 0.0001 compared with Htt-25Q neurons with control RNAi; #, p < 0.0001 compared with Htt-72Q neurons with control RNAi, n = 12–24). F, primary cortical neurons were transduced with Twist1-Res lentivirus or control GFP lentivirus at DIV 4 and were co-transduced with Htt-72Q–expressing lentivirus along with Twist1 shRNA 2 or control luciferase (Ctrl) shRNA lentivirus at DIV 5. Neurons were subjected to an MTS assay as in E. Expression of Twist1-Res reversed the neuroprotection induced by Twist1 RNAi in Htt-72Q–expressing neurons (ANOVA; *, p = 0.0034 compared with GFP plus Twist1 RNAi, n = 6). G, qRT-PCR analysis was performed using RNA prepared as in D. RNAi with three different Pou4f1 shRNAs (1, 2, and 3) reduced the levels of Pou4f1 mRNA in mutant Htt–expressing neurons (ANOVA; *, p < 0.0001 compared with control RNAi, n = 3). H, primary cortical neurons transduced with Htt-expressing lentivirus along with Pou4f1 shRNA (1, 2, or 3) or control shRNA lentivirus at DIV 5 were subjected to MTS assay as in E. Knockdown of Pou4f1 could not rescue mutant Htt–induced toxicity (ANOVA; *, p < 0.0001 compared with Htt-25Q neurons with control RNAi; no increase in cell viability in Htt-72Q neurons with Pou4f1 RNAi compared with control RNAi, n = 9–15). Knockdown of Pou4f1 in Htt-25Q–expressing neurons decreased cell viability (ANOVA; #, p < 0.0001 compared with Htt-25Q neurons with control RNAi, n = 9–15). I, cortical neurons processed as in E were fixed at DIV 14 and subjected to NF immunofluorescence. Representative NF immunofluorescence images of transduced neurons are shown. Immunofluorescence intensity of images was quantified by an ImageJ-based macro. Twist1 RNAi 2 blocked Htt-72Q–induced neurite degeneration (ANOVA; *, p < 0.0001 compared with Htt-25Q neurons with control RNAi; #, p < 0.0001 compared with Htt-72Q neurons with control RNAi, n = 15). J, DIV 5 cortical neurons co-transduced as in I were subjected to cell death assays using SYTOX Green nuclear stain at 8 days postinfection. Total nuclei were labeled with Hoechst 33342. Representative staining images are shown. SYTOX Green-positive dead cells as a fraction of Hoechst-positive cells were quantified using an ImageJ-based macro. Twist1 RNAi 2 blocked Htt-72Q–induced cell death (ANOVA; *, p < 0.0001 compared with Htt-25Q neurons with control RNAi; #, p < 0.0001 compared with Htt-72Q neurons with control RNAi, n = 6). K, cortical neurons were transduced as in A and 5 days later were subjected to ChIP with anti-H3K4me3 antibody. H3K4me3 levels at the regions around the TSS of Twist1 (promoter and exon 1) were higher in Htt-72Q–expressing neurons compared with Htt-25Q neurons (unpaired t test; *, p < 0.0001 (promoter); *, p = 0.0030 (exon 1), n = 4). Bar, 100 μm (I and J). Data represent mean + S.E. (error bars) (A, B, and D–K).
We further tested whether Twist1 RNAi is neuroprotective against mutant Htt–induced neurite degeneration by quantifying the loss of neurofilament (NF) immunofluorescence intensity, an early marker of neuronal toxicity (21, 58). Consistent with its effect on cell viability, Twist1 RNAi abrogated neurite degeneration in mutant Htt–expressing neurons (Fig. 4I). Moreover, using an alternative cytotoxicity assay, Sytox Green dead cell stain, we also showed that Twist1 RNAi blocks mutant Htt–induced cell death (Fig. 4J).
Gene expression is regulated by the coordination of epigenetic and transcriptional regulators. Consistent with its increased RNA expression, the regulatory regions of Twist1 around the transcription start site (TSS) showed increased levels of an active histone mark, H3K4me3, in mutant Htt–expressing cortical neurons compared with WT Htt–expressing neurons by ChIP-qPCR (Fig. 4K). These data suggest that an increase in this histone modification contributes to the up-regulation of Twist1 downstream of mutant Htt. Together, these results demonstrate that Twist1 is essential for mutant Htt–induced neuronal death.
Identification of Twist1-dependent genes in mutant Htt–expressing neurons
Twist1 can act as an activator or repressor of transcription by specific interactions with other transcriptional regulators or chromatin modifiers (39, 40, 59). Because Twist1 RNAi protected neurons against mutant Htt–induced toxicity (Fig. 4, E and I), we hypothesized that Twist1 induces a transcriptional program that leads to neuronal death in mutant Htt–expressing neurons, potentially by altering expression of genes relevant for neuronal function and survival. To identify the genes that are dysregulated by Twist1 in mutant Htt–expressing neurons, we performed RNA-Seq analysis following Twist1 knockdown. The following four groups of primary cortical neurons were subjected to RNA-Seq: 1) Htt-25Q–expressing neurons with control shRNA, 2) Htt-72Q–expressing neurons with control shRNA, 3) Htt-72Q–expressing neurons with Twist1 shRNA 1, and 4) Htt-72Q–expressing neurons with Twist1 shRNA 2. Through this analysis, we identified 197 differentially expressed genes (143 down- and 54 up-regulated genes) in mutant Htt–expressing neurons whose expression was rescued by two different Twist1 shRNAs (1 and 2) (Fig. 5 (A and B) and Table S6). As a positive control, Twist1 was one of the 54 genes that are up-regulated by mutant Htt and down-regulated by Twist1 RNAi (Fig. 5B). These findings suggest that Twist1 is involved in the regulation of a subset of genes downstream of mutant Htt. Among the 196 Twist1-dependent genes altered by mutant Htt (Fig. 5, A and B), 55 genes (49 down- and 6 up-regulated genes), which were also differentially expressed in one or more of the previous in vivo RNA profiling analyses with human and mouse HD cortices (11, 47, 48, 57) and therefore potential Twist1-dependent genes in vivo, were selected (Fig. 5C). Among these filtered genes, we validated two Twist1-dependent genes, Egr3 and Egr4, by qRT-PCR (Fig. 5D).
Figure 5.

Knockdown of Twist1 rescues altered expression of selected genes in mutant Htt–expressing cortical neurons. A and B, RNA-Seq analysis was performed with primary cortical neurons co-transduced with lentivirus expressing Htt-25Q and control shRNA, Htt-72Q and control shRNA, or Htt-72Q and Twist1 shRNA (1 or 2) (n = 4/group). RNA-Seq analysis revealed that a subset of differentially expressed genes in Htt-72Q–expressing neurons was restored by Twist1 RNAi. Venn diagrams show that the expression of 143 down-regulated genes (A) and 53 up-regulated genes (54* genes, including Twist1) (B) in Htt-72Q–expressing neurons (|log2FC| > 0.5, FDR < 0.05) is commonly reversed by two different Twist1 shRNAs. A list of these genes can be found in Table S6. C, from the 196 Twist1-dependent deregulated genes (143 down- and 53 up-regulated genes) identified by RNA-Seq analysis with Twist1 RNAi in A and B, 55 genes (49 down- and 6 up-regulated genes), which were shown to be differentially expressed in human and mouse HD cortices in previous RNA-profiling studies, were selected. A heat map of the 55 genes was generated with the R package heatmap3. D, qRT-PCR analysis showed that Egr3 and Egr4 in mutant Htt–expressing primary cortical neurons were reactivated by knockdown of Twist1 with two different Twist1 shRNAs (Egr3 (left): ANOVA; *, p = 0.0005; #, p = 0.005 compared with Htt-72Q neurons with control RNAi, n = 6; Egr4 (right): ANOVA; *, p = 0.024; #, p = 0.022 compared with Htt-72Q neurons with control RNAi, n = 5). Data represent mean + S.E. (error bars). E, enrichment of potential Twist-binding sequences (JASPAR MA0633.1) was found within 2 kb of the TSS of the Twist1-dependent deregulated genes in mutant Htt–expressing neurons by de novo motif analysis. Among the 196 Twist1-dependent genes (143 down- and 53 up-regulated genes in A and B), 63 down- and 24 up-regulated genes were found to contain potential Twist-binding sites (total 157 sites). See also Table S7. F, KEGG pathway analysis of Twist1-dependent down-regulated genes (143 genes) identified by RNA-Seq analysis in A. Top-enriched pathways were determined using DAVID bioinformatics resources. G, potential regulators of Twist1-dependent down-regulated genes in Htt-72Q–expressing neurons (143 genes in A) were identified using the X2K software with the ChIP-X enrichment analysis (ChEA) database. The top 10 regulators from this analysis are shown. SUZ12, MTF2, JARID2, EZH2, and EED are the core or regulatory components of PRC2 complex. RNF2 and PHC1 are the components of PRC1 complex. A complete list of potential regulators can be found in Table S8.
bHLH transcription factors, including Twist1, form homodimers or heterodimers and bind specific DNA sequences known as E-boxes (consensus sequence: CANNTG) in the promoters of target genes (60, 61). To identify potential direct Twist1 targets among the Twist1-dependent deregulated genes in mutant Htt–expressing neurons (143 down- and 53 up-regulated genes in Fig. 5 (A and B)), we searched for genes harboring known Twist-binding motifs (MA0633.1, Twist2 from the JASPAR CORE database, and FIMO) (62, 63). We examined both down- and up-regulated genes as Twist1 can activate or repress gene expression. De novo motif analysis of the sequences covering ±2 kb of the TSS of the 196 Twist1-dependent genes revealed enrichment of Twist-binding sites, with 157 putative Twist-binding sites in 87 Twist1-dependent deregulated (63 down- and 24 up-regulated) genes (Fig. 5E and Table S7).
We found that a greater proportion of genes are repressed than activated by Twist1 in mutant Htt–expressing neurons (Fig. 5, A and B). KEGG pathway analysis showed that the Twist1-dependent repressed genes in mutant Htt–expressing neurons are significantly enriched in pathways relevant to neuronal function, including neuroactive ligand-receptor interaction, calcium signaling pathway, and cAMP signaling pathway (Fig. 5F), suggesting that dysregulation of the Twist1 target genes are important for neuronal function and thus may contribute to mutant Htt–induced neurotoxicity.
Transcription is coordinately regulated by a multiprotein complex consisting of transcription factors and chromatin modifiers, such as histone deacetylases and methyltransferases. Several transcriptional and epigenetic regulators have also been reported to interact and cooperate with Twist1 to control transcription of specific genes (40, 64–67). To gain insight into the mechanism of Twist1-mediated transcriptional repression in HD neurons, we searched for possible regulators of Twist1-dependent gene changes using Expression2Kinase (X2K) software with the ChIP Enrichment Analysis (ChEA) database (68). Interestingly, through this analysis, we found that core or regulatory components of polycomb repressive complex 2 (PRC2), PRC1, and RE1 silencing transcription factor (REST) are potential regulators of Twist1-dependent repressed genes (Fig. 5G and Table S8), raising the interesting possibility that these repressors may be involved in Twist1-dependent transcriptional repression in mutant Htt–expressing neurons. PRC2 and PRC1 are major epigenetic regulators and play important roles in a wide range of biological processes in embryonic development and disease through silencing of target genes by modification of histones (69, 70). Together, our results demonstrated that Twist1 is a key transcription factor driving abnormal expression of a subset of genes and neurotoxicity in mutant Htt–expressing neurons.
Knockdown of Twist1 restores normal Bdnf expression and promoter methylation in a primary neuron model of HD
BDNF is an important trophic factor involved in a wide variety of neuronal functions in development as well as in the mature nervous system, and the abnormal reduction of Bdnf mRNA and protein has been implicated in HD pathogenesis (23, 26, 27). The human and rodent Bdnf genes have a complex genomic structure composed of at least eight different noncoding exons and a common coding exon (71, 72). Distinct Bdnf transcripts consisting of a different 5′-UTR exon linked by the coding exon are driven by specific promoters but generate the same protein. We previously showed that Bdnf transcripts containing exons IV and VI (hereafter Bdnf IV and VI transcripts) are specifically down-regulated by mutant Htt in cultured cortical neurons (21). Down-regulation of the Bdnf IV and VI transcripts has also been observed in human and mouse HD brain (23, 26, 73), suggesting that dysregulation of these transcripts is relevant for reduction of BDNF in HD. We therefore tested the possibility that Twist1 might dysregulate Bdnf IV and VI transcripts in mutant Htt–expressing cortical neurons (Fig. 6A). Knockdown of Twist1 increased the levels of Bdnf IV and VI transcripts by qRT-PCR analysis in mutant Htt–expressing neurons (Fig. 6A), suggesting that Twist1 represses these transcripts. These results are consistent with our RNA-Seq data, where the decreased levels of Bdnf mRNA (total Bdnf transcripts) in mutant Htt-72Q–expressing neurons (0.71-fold of Htt-25Q–expressing neurons) are restored by two different Twist1 shRNAs (1.31- and 1.55-fold by Twist1 shRNAs 1 and 2, respectively, compared with control shRNA) (Table S6). Together, our results indicate that Twist1 contributes to the reduction of Bdnf in HD neurons.
Figure 6.

Twist1 knockdown blocks abnormal promoter methylation and expression of Bdnf in mutant Htt–expressing cortical neurons. A, DIV 5 cortical neurons were co-transduced with lentivirus expressing Htt and Twist1 shRNA (1 or 2) or control luciferase (Ctrl) shRNA. Five days later, RNA was prepared and subjected to qRT-PCR. Knockdown of Twist1 with the two different shRNAs restored the expression of Bdnf exon IV and exon VI transcripts (Bdnf IV (left): ANOVA; *, p = 0.0001 compared with Htt-25Q neurons with control RNAi; #, p = 0.011 (shTwist1#1); #, p = 0.0007 (shTwist1#2) compared with Htt-72Q neurons with control RNAi, n = 8; Bdnf VI (right): ANOVA; *, p = 0.0001 compared with Htt-25Q neurons with control RNAi; #, p = 0.0002 (shTwist1#1); #, p = 0.0003 (shTwist1#2) compared with Htt-72Q neurons with control RNAi, n = 8). B, DIV 5 cortical neurons transduced with Htt–expressing lentivirus were treated with FdCyd or DMSO (vehicle). Five days later, RNA was prepared and subjected to qRT-PCR analysis. The Twist1 RNA levels in Htt-72Q–expressing neurons were not significantly altered by FdCyd treatment (n = 4). C, genomic DNA was purified from primary cortical neurons transduced as in A at 5 days after infection and was subjected to MeDIP with anti-5-mC antibody followed by qPCR. The increased levels of 5-mC were found in the Bdnf exon IV promoter of Htt-72Q–expressing neurons compared with that of Htt-25Q neurons (ANOVA; *, p = 0.047, n = 8), and knockdown of Twist1 with two different Twist1 shRNAs (1 and 2) could inhibit the increase in Bdnf promoter IV methylation in Htt-72Q–expressing neurons (ANOVA; #, p = 0.0264 (Twist1 shRNA 1); #, p = 0.012 (Twist1 shRNA 2) compared with Htt-72Q plus control shRNA, n = 8). D, a model for the role of Twist1 in mutant Htt–induced down-regulation of Bdnf in neurons. Twist1 is up-regulated by mutant Htt and triggers down-regulation of Bdnf in mutant Htt–expressing cortical neurons. The increased levels of H3K4me3 are associated with Twist1 up-regulation (Fig. 4K). Twist1 is required for increased DNA methylation at Bdnf promoter IV. Whether Twist1-dependent promoter methylation is a general mechanism for other genes repressed by mutant Htt remains to be determined. Data represent mean + S.E. (error bars) (A–C).
To understand the mechanism of Twist1-mediated repression of Bdnf, we considered our recent findings that mutant Htt induces hypermethylation of the Bdnf promoter IV and causes down-regulation of Bdnf IV transcript and that pharmacological inhibition of DNMTs blocks the mutant Htt–induced increase in DNA methylation and subsequent neuronal death (21). These observations raised the possibility that the Twist1-dependent pathway may intersect with DNA methylation in mutant Htt–expressing neurons. We first examined whether mutant Htt–induced aberrant DNA methylation contributes to up-regulation of Twist1. We asked whether DNMT inhibitor 5-fluoro-2′-deoxycytidine (FdCyd), which protects neurons from mutant Htt–induced toxicity, could reverse the mutant Htt–triggered increase in Twist1 mRNA (Fig. 6B). DNMT inhibition had little to no effect on Twist1 levels, suggesting that abnormal DNA methylation does not cause Twist1 up-regulation (Fig. 6B). We next tested the possibility that Twist1 lies upstream of aberrant mutant Htt–induced DNA methylation and is necessary for the hypermethylation of Bdnf promoter IV in mutant Htt–expressing cortical neurons. Methylated DNA immunoprecipitation (MeDIP) experiments using anti-5-methylcytosine (5-mC) antibody demonstrated that Twist1 knockdown blocks the mutant Htt–induced increase in promoter IV methylation (Fig. 6C), suggesting that Twist1 operates upstream of DNA methylation–mediated gene repression. Together, our findings suggest that mutant Htt causes increased promoter methylation and repression of a specific Bdnf transcript in cortical neurons in a Twist1-dependent manner (Fig. 6D).
Discussion
Here, taking advantage of a mutant Htt–expressing primary cortical neuron system and genome-wide RNA-Seq analysis, we demonstrate that mutant Htt expression induces robust transcriptional changes that overlap with changes observed in brains of HD patients and mouse models. We find that bHLH transcription factor Twist1 is substantially up-regulated by mutant Htt in primary neurons, which is recapitulated in human and mouse HD brains in vivo, and is required for a subset of mutant Htt–induced transcriptional alterations. In addition, we demonstrate that Twist1 is essential for mutant Htt–induced neurotoxicity, indicating that Twist1 up-regulation is functionally important for mutant Htt–expressing neurons. In addition, using Bdnf as a model gene, we showed that Twist1 is required for mutant Htt–induced hypermethylation of the Bdnf promoter IV and subsequent down-regulation of the transcript driven by this promoter. Our study thus reveals a novel transcriptional mechanism important for mutant Htt–induced neurotoxicity, which can potentially be targeted to protect HD neurons.
Using HD model neurons, our findings demonstrate for the first time the critical role of Twist1 in mutant Htt–induced neurotoxicity. Defining the role and therapeutic potential of Twist1 in HD in vivo using animal models represents an important future goal. In addition to attenuating Twist1 expression in mutant Htt–expressing neurons, manipulating key downstream Twist1 targets may represent an alternative, and potentially more specific, means of blocking neuronal dysfunction and death in HD. Further mechanistic studies are needed to identify the specific Twist1 target genes that contribute to mutant Htt–induced toxicity.
Our genome-wide RNA analysis demonstrates that Twist1 knockdown could rescue a subset of differentially expressed genes, which are both up- and down-regulated, in mutant Htt–expressing cortical neurons, providing evidence that Twist1 plays an important role in mutant Htt–induced transcriptional alterations in neurons. Twist1 can activate or repress transcription of target genes by recruiting other transcriptional regulators and chromatin modifiers to the regulatory region of specific genes (40, 64–67, 74, 75). Interestingly, our analysis of the ChEA database suggests that transcriptional repressors, including PRC1 and PRC2, may cooperate with Twist1 to repress transcription of specific genes in mutant Htt–expressing neurons. Interestingly, previous studies with cancer cells and mesenchymal stem cells have suggested that Twist1 recruits PRC1 and PRC2 to target gene loci, leading to transcriptional repression (64, 66). Although these studies were performed in the context of nonneuronal cells, it is possible that a similar mechanism plays a role in HD neurons. In future studies, identification of the neuron-specific Twist1 protein complex will help determine how specific sets of genes are regulated in neurons by this transcription factor.
BDNF is an important neurotrophic factor that has been strongly implicated in the etiology of HD (23, 26, 27, 29). We have previously shown that mutant Htt down-regulates Bdnf IV and VI transcripts in cortical neuron cultures (21). These transcripts have also been found to be down-regulated in the brains of HD patients and mouse models, suggesting that the reduction of these transcripts is clinically relevant (23, 26, 73). Our findings demonstrate that Twist1 is required for down-regulation of the Bdnf IV and VI transcripts in mutant Htt–expressing cortical neurons. Interestingly, the regulatory region of the Bdnf exon IV has several E-box sequences (CANNTG) that are conserved between human and mouse, including CATATG (−49 to −44 bp from the TSS of mouse Bdnf exon IV), which is known to be a preferential binding sequence for the Twist1 homodimer (61). This observation raises the intriguing possibility that Bdnf IV may be a direct binding target of Twist1. The specific genes dysregulated by direct binding of Twist1 in mutant Htt–expressing neurons remain to be determined in future studies. Together, our findings provide evidence that Twist1 plays a functionally important role in mutant Htt–induced neuronal death, probably by altering the expression of key genes.
Our previous study demonstrated that mutant Htt–induced down-regulation of Bdnf IV transcripts relies on DNA methylation in cortical neurons (21). In the present study, we show that Twist1 is essential for mutant Htt–induced hypermethylation of Bdnf promoter IV. Given that cross-talk between Twist1 and DNMT3A or DNMT3B has been observed in cancer cells (65, 67), it will be interesting to test the hypothesis that Twist1 recruits DNMTs to target loci in HD neurons.
The exact mechanism of Twist1 up-regulation in mutant Htt–expressing neurons remains an important open question. It is possible that mutant Htt up-regulates Twist1 by abnormally interacting with or sequestering epigenetic or transcriptional regulators of Twist1. Alternatively, mutant Htt–induced cell signaling may influence Twist1 transcription by activating or inactivating its upstream regulators. Our data showed that mutant Htt increases levels of the transcriptionally active H3K4me3 mark in the regulatory region of Twist1 in cortical neurons. Supporting these findings, recent genome-wide integrated analysis of H3K4me3 and RNA expression profiles from the cortex of R6/2 HD mice in vivo revealed increased levels of the H3K4me3 mark at the Twist1 locus (11), suggesting a mechanism for Twist1 up-regulation in HD. These observations raise the possibility that the activity of enzymes catalyzing H3K4me3 may be altered by mutant Htt by the mechanism(s) suggested above. In addition, a recent study has shown that inhibition of the histone H3 Lys-27 methyltransferase complex PRC2 in neurons in mice causes up-regulation of PRC2 target genes encoding transcription factors, including Twist1, and leads to neurodegeneration (76), suggesting that PRC2 inhibition may be involved in the up-regulation of Twist1 in the context of mutant Htt. However, whether PRC2 is inhibited in HD neurons remains to be examined. Our study reveals a critical role for Twist1 in mutant Htt–induced transcriptional dysregulation and toxicity in neurons. As Twist1 up-regulation has also been observed in the brains of Alzheimer's disease patients (77), our findings may have ramifications for other neurodegenerative conditions.
Experimental procedures
Antibodies and reagents
Mouse monoclonal anti-Twist1 (Twist2C1a, sc-81417, Santa Cruz Biotechnology, Inc.) and anti-β-actin (sc-47778, Santa Cruz Biotechnology) antibodies were used for immunoblotting. Mouse monoclonal anti-Htt antibody (MAB5492, Millipore) was used for immunofluorescence and immunoblotting. Rabbit monoclonal anti-H3K4me3 antibody (05-745R, clone 15-10C-E4, Millipore) was used for ChIP. Mouse monoclonal anti-NF (165 kDa) (clone 2H3, Developmental Studies Hybridoma Bank) was used for immunofluorescence. The secondary antibody for immunofluorescence, goat-anti mouse IgG (H+L) conjugated with Alexa Fluor 488 or Alexa Fluor 568, Hoechst 33342, and SYTOX Green were purchased from Thermo Fisher Scientific. FdCyd was purchased from Sigma (F5307).
Plasmids
Lentiviral plasmids expressing Htt-25Q and Htt-72Q under the control of the mouse PGK (Pgk1) promoter (mPGK-Httex1–25Q and mPGK-Httex1–72Q) were kindly provided by D. Krainc (Northwestern University, Chicago, IL). Twist1 RNAi and Pou4f1 RNAi lentiviral constructs (pLKO.1-puro), developed at the Broad Institute of MIT and Harvard, were purchased from Sigma-Aldrich. The primer sequences in the shRNA vectors targeting Twist1 and Pou4f1 are as follows: pLKO.1-Twist1 shRNA 1 (TRCN0000095076), CCGGGCCCTCGGACAAGCTGAGCAACTCGAGTTGCTCAGCTTGTCCGAGGGCTTTTTG; pLKO.1-Twist1 shRNA 2 (TRCN0000095077), CCGGAGCAAGATTCAGACCCTCAAACTCGAGTTTGAGGGTCTGAATCTTGCTTTTTTG; pLKO.1-Pou4f1 shRNA 1 (TRCN0000095335), CCGGGATGAAATTCTCTGCCACTTACTCGAGTAAGTGGCAGAGAATTTCATCTTTTTG; pLKO.1-Pou4f1 shRNA 2 (TRCN0000095337), CCGGGTACCACACGATGAATAGCGTCTCGAGACGCTATTCATCGTGTGGTACTTTTTG; pLKO.1-Pou4f1 shRNA 3 (TRCN0000095338), CCGGCAGAAGCGGATGAAATTCTCTCTCGAGAGAGAATTTCATCCGCTTCTGTTTTTG.
The FLAG-tagged Twist1 rescue construct (Twist1-Res), which harbors nine-base mismatches in the region targeted by Twist1 RNAi (Twist1 shRNA 2) (TCTAAAATCCAAACACTGAAG, mismatches underscored), was generated by a PCR-based method, and the Twist1-Res cDNA was subcloned into pRRLsinPGK vector.
Primary neuron cultures, lentiviral transduction, and drug treatment
Mouse primary cortical neurons were prepared from embryonic day 15.5 Swiss Webster mouse fetuses (Taconic) and transduced with lentivirus at DIV 5 as described previously (21). Lentiviral particles were prepared by transfecting 293LE cells with a lentiviral plasmid along with packaging plasmid psPAX2 and envelope plasmid pCMV-SVG and purified from the conditioned medium as described previously (21). Equal numbers of viral particles of Htt-25Q– and Htt-72Q–expressing lentiviruses were used for transduction of neurons on the basis of viral copy number measured using the Lenti-X qRT-PCR titration kit (Clontech). In lentivirus-mediated knockdown experiments in Htt-expressing neurons, DIV 5 primary neurons were cotransduced with shRNA- and Htt-expressing lentiviruses. pLKO.1-luciferase shRNA was used as control for pLKO.1-Twist1 shRNA and pLKO.1-Pou4f1 shRNA. For the experiments to test the effects of DNMT inhibitor FdCyd on Twist1 mRNA expression, neurons were treated with the drug 6 h after Htt lentiviral infection at DIV 5. One half of the medium was changed again at DIV 8 with the medium containing new drug, and neurons were harvested at DIV 10 for qRT-PCR analysis.
Measurements of cell viability, cell death, and neurite degeneration in primary neurons
The viability of the transduced primary cortical neurons that are grown on a 96-well plate was assessed for mitochondrial metabolic activity at 9 days postinfection (DIV 14) using 3-(4,5-dimethylthiazol-2-yl)-5-(3-carboxymethoxyphenyl)-2-(4-sulfophenyl)-2H-tetrazolium (MTS) (Promega) per the manufacturer's instructions. MTS-reducing activity was normalized for each condition to Htt-25Q lentiviruses cotransduced with control RNAi lentivirus (= 1). Cell death of the transduced primary cortical neurons at 8 days after Htt lentivirus infection (DIV 13) was assessed using SYTOX Green (Thermo Fisher Scientific), a fluorescent nucleic acid stain that is impermeant to live cells. SYTOX Green was added to culture medium at a final concentration of 0.1 μm along with Hoechst 33342 (Thermo Fisher Scientific) at a final concentration of 1 μg/ml. Neurons were then incubated at 37 °C in a CO2 incubator for 15 min, and images were captured (five random fields per well) using an Operetta high-content imaging system (PerkinElmer Life Sciences) with a ×20 objective lens. The percentage of dead cells was quantified by counting the number of SYTOX Green-positive dead cells over total cells labeled with Hoechst using an ImageJ-based macro. Degeneration of neurites was assessed by the quantitative measurement of NF immunofluorescence intensity from the images captured (nine random fields per well) using an Operetta high-content imaging system (PerkinElmer Life Sciences) with a ×20 objective lens as described previously (21).
HD mouse models
R6/2 mice, which carry the promoter sequence and exon 1 of a mutant human HTT gene, were obtained from the Jackson Laboratory (Bar Harbor, ME) (stock no. 002810), and a colony was maintained by breeding R6/2 males with B6CBAF1 females (Jackson Laboratory). PCR genotyping was performed as described previously (55). To maintain mice carrying the similar number of CAG repeats, a second PCR analysis was conducted using a primer set amplifying across the CAG repeats (ATGAAGGCCTTCGAGTCCCTCAAGTCCTTC and GGCGGCTGAGGAAGCTGAGGA) (78). zQ175 knock-in mice were obtained from the Jackson laboratory (stock no. 370437; CHDI Foundation stock 81003003) and were maintained in the C57BL6/J background. PCR genotyping and CAG repeat length analyses for zQ175 mice were performed as described previously (79). The CAG repeat length of R6/2 and zQ175 mice was also determined by Laragen Inc. (Culver City, CA) using tail DNA. The R6/2 and zQ175 mice used for experiments carried 170 ± 5 repeats and 190 ± 10 repeats, respectively. All live vertebrate experiments were performed in compliance with the National Institutes of Health Guide for the Care and Use of Laboratory Animals. Animal protocols were approved by the institutional animal care and use committees of Washington University.
qRT-PCR
RNAs were isolated from cultured neurons 5 days after infection of Htt lentiviruses and mouse brain using the RNeasy Plus Mini Kit (Qiagen) and RNeasy Plus Universal Mini Kit (Qiagen), respectively. Reverse transcription was performed with the High-Capacity cDNA Reverse Transcription Kit (Applied Biosystems). qPCR was performed using Power SYBR Green PCR Master Mix (Applied Biosystems) on the CFX Connect Real-Time System (Bio-Rad). β-actin was used as a reference gene for data normalization unless otherwise stated. Relative mRNA levels were calculated using the ΔΔCt method. Sequences of the primers used are as follows: Twist1 forward, TAGAAGTCTGAACACTCGTT; Twist1 reverse, AATTCCTCTGATTGTTACCATT; Pou4f1 forward, CTTCACGGTTCTCCAAAGGA; Pou4f1 reverse, AGAGACAGAAGCAGAAGCGG; Egr3 forward, TTGCCTGACAATCTGTACCCC; Egr3 reverse, TAATGGGCTACCGAGTCGCT; Egr4 forward, TATCCTGGAGGCGACTTCTTG; Egr4 reverse, AGATGCCAGACATGAGGTTGA; Bdnf exon IX (protein coding) forward, GACAAGGCAACTTGGCCTAC; Bdnf exon IX (protein coding) reverse, CGTGCTCAAAAGTGTCAGCC; Bdnf exon IV forward, CAGAGCAGCTGCCTTGATGTT; Bdnf exon IV reverse, GCCTTGTCCGTGGACGTTTA; Bdnf exon VI forward, TTGGGGCAGACGAGAAAGCGC; Bdnf exon VI reverse, AGGATGGTCATCACTCTTCTC; Drd2 forward, CTGGAGCCAAAAGCAGTCTG; Drd2 reverse, TCCTTCAGGTTTCCGACGCC; Ppp1r1b forward, CCAACCCCTGCCATGCTTT; Ppp1r1b reverse, TTGGGTCTCTTCGACTTTGGG; β-actin (Actb) forward, AGTGTGACGTTGACATCCGTA; β-actin (Actb) reverse, GCCAGAGCAGTAATCTCCTTCT; Hprt forward, TTGACACTGGTAAAACAATGCAAAC; Hprt reverse, GAGAGGTCCTTTTCACCAGCA.
RNA-Seq analysis, data acquisition, quality control, and processing
Total RNAs were prepared from primary cortical neurons 5 days after lentiviral infection (n = 4 cultures/condition) using the RNeasy Plus Mini Kit. The integrity of total RNA was validated by an Agilent bioanalyzer. A library was prepared from 0.5–1 μg of RNA treated with the Ribo-Zero rRNA removal kit (Epicenter) per the manufacturer's protocol. cDNA was blunt-ended, an A base was added to the 3′ ends, and then Illumina sequencing adapters were ligated to the ends. Ligated fragments were then amplified for 12 cycles using primers incorporating unique index tags. Fragments were sequenced on Illumina Hi-Seq-2500 or Hi-Seq-3000 using single reads extending 50 bases, targeting 25–30 million reads/sample. RNA-Seq was performed with primary cortical neurons expressing 1) control empty vector, 2) Htt-25Q, and 3) Htt-72Q in Fig. 1 and primary cortical neurons expressing 1) Htt-25Q and control luciferase RNAi, 2) Htt-72Q and control luciferase RNAi, 3) Htt-72Q and Twist1 RNAi 1, and 4) Htt-72Q and Twist1 RNAi 2 in Fig. 5. RNA-Seq reads were aligned to the Ensembl release 76 assembly with STAR version 2.0.4b. Gene counts were generated by Subread:featureCount version 1.4.5, and transcript counts were produced by Sailfish version 0.6.3. Sequencing performance was assessed for total number of aligned reads, total number of uniquely aligned reads, genes and transcripts detected, ribosomal fraction known junction saturation, and read distribution over known gene models with RSeQC version 2.3. All gene-level and transcript counts were imported into the R/Bioconductor package EdgeR, and TMM normalization size factors were calculated to adjust for samples for differences in library size. Genes or transcripts not expressed in any sample were excluded from further analysis. The TMM size factors and the matrix of counts were then imported into R/Bioconductor package Limma, and weighted likelihoods based on the observed mean-variance relationship of every gene/transcript were then calculated for all samples with the Voom function. Performance of the samples was assessed with a Spearman correlation matrix and multidimensional scaling plots. Gene/transcript performance was assessed with plots of residual S.D. deviation of every gene to their average log-count with a robustly fitted trend line of the residuals. Generalized linear models with robust dispersion estimates were then created to test for gene/transcript level differential expression. An additive model was applied for the differential expression analysis. Differentially expressed genes and transcripts were then filtered for FDR-adjusted p < 0.05. A heat map of the significant results was generated with the R package heatmap3. Gene Ontology and KEGG pathway analyses were performed using the Database for Annotation, Visualization and Integrated Discovery (DAVID) bioinformatics resources version 6.8 (NIAID, National Institutes of Health) (11).
Transcriptional regulatory network analysis
Gene regulatory networks were constructed as described in a previous study with some modifications (54). 1093 differentially expressed genes (|log2FC| > 1, FDR < 0.01, average CPM > 0.5) in Htt-72Q– versus Htt-25Q–expressing primary cortical neurons from our RNA-Seq were used for the regulatory network analysis. Interactions between these genes were identified using GeneGo's MetaCore (Thomson Reuters), the comprehensive manually curated, knowledge-based database, which also indicated whether interacting genes were transcription factors. Thus, transcription factors (|log2FC| > 1.5) were first selected based on the annotated interaction list. From these transcription factors, we further selected ones that are known to interact with at least one other transcription factor, resulting in the identification of 13 transcription factors. Transcription factor-target networks were constructed using the same interaction database. Because many transcription factors work in conjunction with each other to regulate genes, we incorporated this information into the regulatory network by finding targets that are potentially regulated by more than one of the 13 transcription factors, resulting in the identification of 20 targets. The interactions in the network include transcriptional regulation, physical binding, and phosphorylation. The regulatory network was visualized using Cytoscape.
Motif analysis
The DNA sequences of promoter regions (2 kb around the TSS) of selected genes were isolated from mouse reference genome (mm10 assembly) and were used to perform motif analysis. The Twist1 motif position weight matrix was obtained from the JASPAR database (62), and FIMO (63) was used to de novo discover the potential Twist1 binding motif based on its position weight matrix at the stringent cutoff p value < 0.0001. The prediction was further processed and cleaned by an in-house transcript.
MeDIP
Genomic DNA was isolated from primary cortical neurons using QIAamp DNA Mini Kit (Qiagen) and fragmented by sonication using Bioruptor (Diagenode). 5-mC–containing DNA fragments were enriched from 1 μg of the sonicated genomic DNA by immunoprecipitation (IP) with mouse monoclonal anti-5mC antibody (Eurogentec, catalog no. BI-MECY-0100) as described previously (21). IP and 10% input DNA samples were purified using the MinElute PCR purification kit (Qiagen) and subjected to qPCR with Bdnf promoter IV and Gapdh (internal control) primers to measure the enrichment of the DNA fragment containing the Bdnf promoter IV region. The percentage input was calculated by normalizing IP to input DNA using the formula, 2((Ct(10% input) − 3.32) − Ct(IP)) × 100, as described previously (80). The sequences of the primers used are as follows: MeDIP-Bdnf IV forward, GCGCGGAATTCTGATTCTGGTA; MeDIP-Bdnf IV reverse, CTGCCTTGACGTGAGCTGTC; Gapdh forward, CTCTGCTCCTCCCTGTTCC; Gapdh reverse, TCCCTAGACCCGTACAGTGC. The MeDIP-Bdnf IV primer set amplifies the region, −112 to −25 bp from the TSS, of the mouse Bdnf promoter IV.
ChIP-qPCR
Mouse primary cortical neurons were subjected to ChIP assay with anti-H3K4me3 rabbit mAb (Millipore 05-745R; clone 15-10C-E4). ChIP was performed as described previously (81). The percentage input was calculated as 2((Ct(10% input) − 3.32) − Ct(IP)) × 100 and compared between WT and mutant Htt–expressing neurons. Sequences of the primers used for qPCR are as follows: mTwist1 promoter forward, GAAAAGTCCCTCCTCCCCAC; mTwist1 promoter reverse, GTGGACTTGGCGGCTCTTAT; mTwist1 exon 1 forward, CCGCCCGCGAGATGATG; mTwist1 exon 1 reverse, CTGTTGCTCAGGCTGTCGTC.
Preparation of brain lysates
Mouse brain lysates were prepared in TNE buffer (10 mm Tris, pH 8.0, 150 mm NaCl, 1 mm EDTA, 1% Nonidet P-40) containing protease inhibitors and phosphatase inhibitors using a Dounce homogenizer. Because the anti-Twist1 antibody used for immunoblotting was a monoclonal mouse IgG, we precleared the lysates with Dynabeads protein G (Thermo Fisher Scientific) to remove endogenous IgG from brain tissues before using them for immunoblotting.
Statistical analysis
Statistical differences were tested using GraphPad Prism version 7.0. Two-tailed unpaired Student's t test was used for comparisons between two groups. For the experiments with more than two groups, one-way ANOVA was performed, followed by post hoc tests, Fisher's least significant difference for comparison among three groups, and Bonferroni's or Dunnett's test for comparison among three or more than three groups. The data presented are from at least three independent experiments.
Author contributions
H. Y. conceived the study, supervised the research project, and wrote the paper; H. Y. and Y. P. designed experiments; Y. P., Y. Z., J. P., and L. Z. performed experiments; Y. P., Y. Z., H. Y., W. Y., E. T., S. L., M. K. S., and B. Z. analyzed data; Y. S. developed a macro for quantitative analysis of cell death. A. H. K. provided conceptual input and critically read the manuscript. All authors reviewed the results and approved the final version of the manuscript.
Supplementary Material
Acknowledgments
We thank the members of the Yano and Kim laboratories for helpful discussions and technical support. We thank the Genome Technology Access Center in the Department of Genetics at Washington University School of Medicine for help with genomic analysis. The Center is supported in part by NCI, National Institutes of Health (NIH), Cancer Center Support Grant P30 CA91842 to the Siteman Cancer Center and by ICTS/CTSA Grant UL1TR000448 from the National Center for Research Resources (NCRR)/NIH and the NIH Roadmap for Medical Research.
This work was supported by National Institutes of Health Grants K01 AG033724 (to H. Y.), R21 NS096603 (to H. Y.), R01 NS094670 (to A. H. K.), the McDonnell Center for Cellular and Molecular Neurobiology at Washington University, and the Hope Center for Neurological Disorders at Washington University. The authors declare that they have no conflicts of interest with the contents of this article. The content is solely the responsibility of the authors and does not necessarily represent the official views of the National Institutes of Health.
This article contains Tables S1–S8.
- HD
- Huntington's disease
- H3K4me3
- histone H3 lysine 4 trimethylation
- DNMT
- DNA methyltransferase
- FDR
- false discovery rate
- bHLH
- basic helix-loop-helix
- DIV
- days in vitro
- GO
- gene ontology
- CPM
- counts per million
- TF
- transcription factor
- qPCR and qRT-PCR
- quantitative PCR and RT-PCR, respectively
- NF
- neurofilament
- TSS
- transcription start site
- BDNF
- brain-derived neurotrophic factor
- FdCyd
- 5-fluoro-2′-deoxycytidine
- MeDIP
- methylated DNA immunoprecipitation
- 5-mC
- 5-methylcytosine
- MTS
- 3-(4,5-dimethylthiazol-2-yl)-5-(3-carboxymethoxyphenyl)-2-(4-sulfophenyl)-2H-tetrazolium
- IP
- immunoprecipitation
- GAPDH
- glyceraldehyde-3-phosphate dehydrogenase
- ANOVA
- analysis of variance.
References
- 1. Walker F. O. (2007) Huntington's disease. Lancet 369, 218–228 10.1016/S0140-6736(07)60111-1 [DOI] [PubMed] [Google Scholar]
- 2. Ross C. A., Aylward E. H., Wild E. J., Langbehn D. R., Long J. D., Warner J. H., Scahill R. I., Leavitt B. R., Stout J. C., Paulsen J. S., Reilmann R., Unschuld P. G., Wexler A., Margolis R. L., and Tabrizi S. J. (2014) Huntington disease: natural history, biomarkers and prospects for therapeutics. Nat. Rev. Neurol. 10, 204–216 10.1038/nrneurol.2014.24 [DOI] [PubMed] [Google Scholar]
- 3. Huntington's Disease Collaborative Research Group (1993) A novel gene containing a trinucleotide repeat that is expanded and unstable on Huntington's disease chromosomes. Cell 72, 971–983 10.1016/0092-8674(93)90585-E [DOI] [PubMed] [Google Scholar]
- 4. Sugars K. L., and Rubinsztein D. C. (2003) Transcriptional abnormalities in Huntington disease. Trends Genet. 19, 233–238 10.1016/S0168-9525(03)00074-X [DOI] [PubMed] [Google Scholar]
- 5. Cha J. H. (2007) Transcriptional signatures in Huntington's disease. Prog. Neurobiol. 83, 228–248 10.1016/j.pneurobio.2007.03.004 [DOI] [PMC free article] [PubMed] [Google Scholar]
- 6. Seredenina T., and Luthi-Carter R. (2012) What have we learned from gene expression profiles in Huntington's disease? Neurobiol. Dis. 45, 83–98 10.1016/j.nbd.2011.07.001 [DOI] [PubMed] [Google Scholar]
- 7. Cha J. H. (2000) Transcriptional dysregulation in Huntington's disease. Trends Neurosci. 23, 387–392 10.1016/S0166-2236(00)01609-X [DOI] [PubMed] [Google Scholar]
- 8. Li S. H., and Li X. J. (2004) Huntingtin-protein interactions and the pathogenesis of Huntington's disease. Trends Genet. 20, 146–154 10.1016/j.tig.2004.01.008 [DOI] [PubMed] [Google Scholar]
- 9. Landles C., and Bates G. P. (2004) Huntingtin and the molecular pathogenesis of Huntington's disease: fourth in molecular medicine review series. EMBO Rep. 5, 958–963 10.1038/sj.embor.7400250 [DOI] [PMC free article] [PubMed] [Google Scholar]
- 10. Kim S., and Kim K. T. (2014) Therapeutic approaches for inhibition of protein aggregation in Huntington's disease. Exp. Neurobiol. 23, 36–44 10.5607/en.2014.23.1.36 [DOI] [PMC free article] [PubMed] [Google Scholar]
- 11. Vashishtha M., Ng C. W., Yildirim F., Gipson T. A., Kratter I. H., Bodai L., Song W., Lau A., Labadorf A., Vogel-Ciernia A., Troncosco J., Ross C. A., Bates G. P., Krainc D., Sadri-Vakili G., et al. (2013) Targeting H3K4 trimethylation in Huntington disease. Proc. Natl. Acad. Sci. U.S.A. 110, E3027–E3036 10.1073/pnas.1311323110 [DOI] [PMC free article] [PubMed] [Google Scholar]
- 12. Ng C. W., Yildirim F., Yap Y. S., Dalin S., Matthews B. J., Velez P. J., Labadorf A., Housman D. E., and Fraenkel E. (2013) Extensive changes in DNA methylation are associated with expression of mutant huntingtin. Proc. Natl. Acad. Sci. U.S.A. 110, 2354–2359 10.1073/pnas.1221292110 [DOI] [PMC free article] [PubMed] [Google Scholar]
- 13. McFarland K. N., Das S., Sun T. T., Leyfer D., Xia E., Sangrey G. R., Kuhn A., Luthi-Carter R., Clark T. W., Sadri-Vakili G., and Cha J. H. (2012) Genome-wide histone acetylation is altered in a transgenic mouse model of Huntington's disease. PLoS One 7, e41423 10.1371/journal.pone.0041423 [DOI] [PMC free article] [PubMed] [Google Scholar]
- 14. McFarland K. N., Das S., Sun T. T., Leyfer D., Kim M. O., Xia E., Sangrey G. R., Kuhn A., Luthi-Carter R., Clark T. W., Sadri-Vakili G., and Cha J. H. (2013) Genome-wide increase in histone H2A ubiquitylation in a mouse model of Huntington's disease. J. Huntingtons Dis. 2, 263–277 [DOI] [PubMed] [Google Scholar]
- 15. Valor L. M., Guiretti D., Lopez-Atalaya J. P., and Barco A. (2013) Genomic landscape of transcriptional and epigenetic dysregulation in early onset polyglutamine disease. J. Neurosci. 33, 10471–10482 10.1523/JNEUROSCI.0670-13.2013 [DOI] [PMC free article] [PubMed] [Google Scholar]
- 16. Wang F., Yang Y., Lin X., Wang J. Q., Wu Y. S., Xie W., Wang D., Zhu S., Liao Y. Q., Sun Q., Yang Y. G., Luo H. R., Guo C., Han C., and Tang T. S. (2013) Genome-wide loss of 5-hmC is a novel epigenetic feature of Huntington's disease. Hum. Mol. Genet. 22, 3641–3653 10.1093/hmg/ddt214 [DOI] [PubMed] [Google Scholar]
- 17. Benn C. L., Sun T., Sadri-Vakili G., McFarland K. N., DiRocco D. P., Yohrling G. J., Clark T. W., Bouzou B., and Cha J. H. (2008) Huntingtin modulates transcription, occupies gene promoters in vivo, and binds directly to DNA in a polyglutamine-dependent manner. J. Neurosci. 28, 10720–10733 10.1523/JNEUROSCI.2126-08.2008 [DOI] [PMC free article] [PubMed] [Google Scholar]
- 18. Ikegame T., Bundo M., Murata Y., Kasai K., Kato T., and Iwamoto K. (2013) DNA methylation of the BDNF gene and its relevance to psychiatric disorders. J. Hum. Genet. 58, 434–438 10.1038/jhg.2013.65 [DOI] [PubMed] [Google Scholar]
- 19. Day J. J., and Sweatt J. D. (2010) DNA methylation and memory formation. Nat. Neurosci. 13, 1319–1323 10.1038/nn.2666 [DOI] [PMC free article] [PubMed] [Google Scholar]
- 20. Bird A. (2002) DNA methylation patterns and epigenetic memory. Genes Dev. 16, 6–21 10.1101/gad.947102 [DOI] [PubMed] [Google Scholar]
- 21. Pan Y., Daito T., Sasaki Y., Chung Y. H., Xing X., Pondugula S., Swamidass S. J., Wang T., Kim A. H., and Yano H. (2016) Inhibition of DNA methyltransferases blocks mutant huntingtin-induced neurotoxicity. Sci. Rep. 6, 31022 10.1038/srep31022 [DOI] [PMC free article] [PubMed] [Google Scholar]
- 22. Villar-Menéndez I., Blanch M., Tyebji S., Pereira-Veiga T., Albasanz J. L., Martín M., Ferrer I., Pérez-Navarro E., and Barrachina M. (2013) Increased 5-methylcytosine and decreased 5-hydroxymethylcytosine levels are associated with reduced striatal A2AR levels in Huntington's disease. Neuromolecular Med. 15, 295–309 10.1007/s12017-013-8219-0 [DOI] [PubMed] [Google Scholar]
- 23. Zuccato C., and Cattaneo E. (2007) Role of brain-derived neurotrophic factor in Huntington's disease. Prog. Neurobiol. 81, 294–330 10.1016/j.pneurobio.2007.01.003 [DOI] [PubMed] [Google Scholar]
- 24. Greenberg M. E., Xu B., Lu B., and Hempstead B. L. (2009) New insights in the biology of BDNF synthesis and release: implications in CNS function. J. Neurosci. 29, 12764–12767 10.1523/JNEUROSCI.3566-09.2009 [DOI] [PMC free article] [PubMed] [Google Scholar]
- 25. Zuccato C., and Cattaneo E. (2009) Brain-derived neurotrophic factor in neurodegenerative diseases. Nat. Rev. Neurol. 5, 311–322 10.1038/nrneurol.2009.54 [DOI] [PubMed] [Google Scholar]
- 26. Zuccato C., Ciammola A., Rigamonti D., Leavitt B. R., Goffredo D., Conti L., MacDonald M. E., Friedlander R. M., Silani V., Hayden M. R., Timmusk T., Sipione S., and Cattaneo E. (2001) Loss of huntingtin-mediated BDNF gene transcription in Huntington's disease. Science 293, 493–498 10.1126/science.1059581 [DOI] [PubMed] [Google Scholar]
- 27. Strand A. D., Baquet Z. C., Aragaki A. K., Holmans P., Yang L., Cleren C., Beal M. F., Jones L., Kooperberg C., Olson J. M., and Jones K. R. (2007) Expression profiling of Huntington's disease models suggests that brain-derived neurotrophic factor depletion plays a major role in striatal degeneration. J. Neurosci. 27, 11758–11768 10.1523/JNEUROSCI.2461-07.2007 [DOI] [PMC free article] [PubMed] [Google Scholar]
- 28. Gharami K., Xie Y., An J. J., Tonegawa S., and Xu B. (2008) Brain-derived neurotrophic factor over-expression in the forebrain ameliorates Huntington's disease phenotypes in mice. J. Neurochem. 105, 369–379 10.1111/j.1471-4159.2007.05137.x [DOI] [PMC free article] [PubMed] [Google Scholar]
- 29. Xie Y., Hayden M. R., and Xu B. (2010) BDNF overexpression in the forebrain rescues Huntington's disease phenotypes in YAC128 mice. J. Neurosci. 30, 14708–14718 10.1523/JNEUROSCI.1637-10.2010 [DOI] [PMC free article] [PubMed] [Google Scholar]
- 30. Apostol B. L., Simmons D. A., Zuccato C., Illes K., Pallos J., Casale M., Conforti P., Ramos C., Roarke M., Kathuria S., Cattaneo E., Marsh J. L., and Thompson L. M. (2008) CEP-1347 reduces mutant huntingtin-associated neurotoxicity and restores BDNF levels in R6/2 mice. Mol. Cell. Neurosci. 39, 8–20 10.1016/j.mcn.2008.04.007 [DOI] [PubMed] [Google Scholar]
- 31. Duan W., Peng Q., Masuda N., Ford E., Tryggestad E., Ladenheim B., Zhao M., Cadet J. L., Wong J., and Ross C. A. (2008) Sertraline slows disease progression and increases neurogenesis in N171-82Q mouse model of Huntington's disease. Neurobiol. Dis. 30, 312–322 10.1016/j.nbd.2008.01.015 [DOI] [PMC free article] [PubMed] [Google Scholar]
- 32. Sathasivam K., Neueder A., Gipson T. A., Landles C., Benjamin A. C., Bondulich M. K., Smith D. L., Faull R. L., Roos R. A., Howland D., Detloff P. J., Housman D. E., and Bates G. P. (2013) Aberrant splicing of HTT generates the pathogenic exon 1 protein in Huntington disease. Proc. Natl. Acad. Sci. U.S.A. 110, 2366–2370 10.1073/pnas.1221891110 [DOI] [PMC free article] [PubMed] [Google Scholar]
- 33. Landles C., Sathasivam K., Weiss A., Woodman B., Moffitt H., Finkbeiner S., Sun B., Gafni J., Ellerby L. M., Trottier Y., Richards W. G., Osmand A., Paganetti P., and Bates G. P. (2010) Proteolysis of mutant huntingtin produces an exon 1 fragment that accumulates as an aggregated protein in neuronal nuclei in Huntington disease. J. Biol. Chem. 285, 8808–8823 10.1074/jbc.M109.075028 [DOI] [PMC free article] [PubMed] [Google Scholar]
- 34. Schilling G., Klevytska A., Tebbenkamp A. T., Juenemann K., Cooper J., Gonzales V., Slunt H., Poirer M., Ross C. A., and Borchelt D. R. (2007) Characterization of huntingtin pathologic fragments in human Huntington disease, transgenic mice, and cell models. J. Neuropathol. Exp. Neurol. 66, 313–320 10.1097/nen.0b013e318040b2c8 [DOI] [PubMed] [Google Scholar]
- 35. DiFiglia M., Sapp E., Chase K. O., Davies S. W., Bates G. P., Vonsattel J. P., and Aronin N. (1997) Aggregation of huntingtin in neuronal intranuclear inclusions and dystrophic neurites in brain. Science 277, 1990–1993 10.1126/science.277.5334.1990 [DOI] [PubMed] [Google Scholar]
- 36. Ross C. A., and Tabrizi S. J. (2011) Huntington's disease: from molecular pathogenesis to clinical treatment. Lancet Neurol. 10, 83–98 10.1016/S1474-4422(10)70245-3 [DOI] [PubMed] [Google Scholar]
- 37. Li H., Li S. H., Johnston H., Shelbourne P. F., and Li X. J. (2000) Amino-terminal fragments of mutant huntingtin show selective accumulation in striatal neurons and synaptic toxicity. Nat. Genet. 25, 385–389 10.1038/78054 [DOI] [PubMed] [Google Scholar]
- 38. Graham R. K., Deng Y., Slow E. J., Haigh B., Bissada N., Lu G., Pearson J., Shehadeh J., Bertram L., Murphy Z., Warby S. C., Doty C. N., Roy S., Wellington C. L., Leavitt B. R., et al. (2006) Cleavage at the caspase-6 site is required for neuronal dysfunction and degeneration due to mutant huntingtin. Cell 125, 1179–1191 10.1016/j.cell.2006.04.026 [DOI] [PubMed] [Google Scholar]
- 39. Ansieau S., Morel A. P., Hinkal G., Bastid J., and Puisieux A. (2010) TWISTing an embryonic transcription factor into an oncoprotein. Oncogene 29, 3173–3184 10.1038/onc.2010.92 [DOI] [PubMed] [Google Scholar]
- 40. Qin Q., Xu Y., He T., Qin C., and Xu J. (2012) Normal and disease-related biological functions of Twist1 and underlying molecular mechanisms. Cell Res. 22, 90–106 10.1038/cr.2011.144 [DOI] [PMC free article] [PubMed] [Google Scholar]
- 41. Cepeda C., Hurst R. S., Calvert C. R., Hernández-Echeagaray E., Nguyen O. K., Jocoy E., Christian L. J., Ariano M. A., and Levine M. S. (2003) Transient and progressive electrophysiological alterations in the corticostriatal pathway in a mouse model of Huntington's disease. J. Neurosci. 23, 961–969 10.1523/JNEUROSCI.23-03-00961.2003 [DOI] [PMC free article] [PubMed] [Google Scholar]
- 42. Cepeda C., Wu N., André V. M., Cummings D. M., and Levine M. S. (2007) The corticostriatal pathway in Huntington's disease. Prog. Neurobiol. 81, 253–271 10.1016/j.pneurobio.2006.11.001 [DOI] [PMC free article] [PubMed] [Google Scholar]
- 43. Milnerwood A. J., and Raymond L. A. (2007) Corticostriatal synaptic function in mouse models of Huntington's disease: early effects of huntingtin repeat length and protein load. J. Physiol. 585, 817–831 10.1113/jphysiol.2007.142448 [DOI] [PMC free article] [PubMed] [Google Scholar]
- 44. Cattaneo E., Zuccato C., and Tartari M. (2005) Normal huntingtin function: an alternative approach to Huntington's disease. Nat. Rev. Neurosci. 6, 919–930 10.1038/nrn1806 [DOI] [PubMed] [Google Scholar]
- 45. Yano H., Baranov S. V., Baranova O. V., Kim J., Pan Y., Yablonska S., Carlisle D. L., Ferrante R. J., Kim A. H., and Friedlander R. M. (2014) Inhibition of mitochondrial protein import by mutant huntingtin. Nat. Neurosci. 17, 822–831 10.1038/nn.3721 [DOI] [PMC free article] [PubMed] [Google Scholar]
- 46. Huang D. W., Sherman B. T., Tan Q., Collins J. R., Alvord W. G., Roayaei J., Stephens R., Baseler M. W., Lane H. C., and Lempicki R. A. (2007) The DAVID Gene Functional Classification Tool: a novel biological module-centric algorithm to functionally analyze large gene lists. Genome Biol. 8, R183 10.1186/gb-2007-8-9-r183 [DOI] [PMC free article] [PubMed] [Google Scholar]
- 47. Labadorf A., Hoss A. G., Lagomarsino V., Latourelle J. C., Hadzi T. C., Bregu J., MacDonald M. E., Gusella J. F., Chen J. F., Akbarian S., Weng Z., and Myers R. H. (2015) RNA sequence analysis of human huntington disease brain reveals an extensive increase in inflammatory and developmental gene expression. PLoS One 10, e0143563 10.1371/journal.pone.0143563 [DOI] [PMC free article] [PubMed] [Google Scholar]
- 48. Hodges A., Strand A. D., Aragaki A. K., Kuhn A., Sengstag T., Hughes G., Elliston L. A., Hartog C., Goldstein D. R., Thu D., Hollingsworth Z. R., Collin F., Synek B., Holmans P. A., Young A. B., et al. (2006) Regional and cellular gene expression changes in human Huntington's disease brain. Hum. Mol. Genet. 15, 965–977 10.1093/hmg/ddl013 [DOI] [PubMed] [Google Scholar]
- 49. Ryan A. K., and Rosenfeld M. G. (1997) POU domain family values: flexibility, partnerships, and developmental codes. Genes Dev. 11, 1207–1225 10.1101/gad.11.10.1207 [DOI] [PubMed] [Google Scholar]
- 50. Porcher C., Chagraoui H., and Kristiansen M. S. (2017) SCL/TAL1: a multifaceted regulator from blood development to disease. Blood 129, 2051–2060 10.1182/blood-2016-12-754051 [DOI] [PubMed] [Google Scholar]
- 51. Sheng H. Z., Moriyama K., Yamashita T., Li H., Potter S. S., Mahon K. A., and Westphal H. (1997) Multistep control of pituitary organogenesis. Science 278, 1809–1812 10.1126/science.278.5344.1809 [DOI] [PubMed] [Google Scholar]
- 52. Mallo M., and Alonso C. R. (2013) The regulation of Hox gene expression during animal development. Development 140, 3951–3963 10.1242/dev.068346 [DOI] [PubMed] [Google Scholar]
- 53. Golson M. L., and Kaestner K. H. (2016) Fox transcription factors: from development to disease. Development 143, 4558–4570 10.1242/dev.112672 [DOI] [PMC free article] [PubMed] [Google Scholar]
- 54. Deshmukh H., Yu J., Shaik J., MacDonald T. J., Perry A., Payton J. E., Gutmann D. H., Watson M. A., and Nagarajan R. (2011) Identification of transcriptional regulatory networks specific to pilocytic astrocytoma. BMC Med. Genomics 4, 57 10.1186/1755-8794-4-57 [DOI] [PMC free article] [PubMed] [Google Scholar]
- 55. Mangiarini L., Sathasivam K., Seller M., Cozens B., Harper A., Hetherington C., Lawton M., Trottier Y., Lehrach H., Davies S. W., and Bates G. P. (1996) Exon 1 of the HD gene with an expanded CAG repeat is sufficient to cause a progressive neurological phenotype in transgenic mice. Cell 87, 493–506 10.1016/S0092-8674(00)81369-0 [DOI] [PubMed] [Google Scholar]
- 56. Menalled L. B., Kudwa A. E., Miller S., Fitzpatrick J., Watson-Johnson J., Keating N., Ruiz M., Mushlin R., Alosio W., McConnell K., Connor D., Murphy C., Oakeshott S., Kwan M., Beltran J., et al. (2012) Comprehensive behavioral and molecular characterization of a new knock-in mouse model of Huntington's disease: zQ175. PLoS One 7, e49838 10.1371/journal.pone.0049838 [DOI] [PMC free article] [PubMed] [Google Scholar]
- 57. Langfelder P., Cantle J. P., Chatzopoulou D., Wang N., Gao F., Al-Ramahi I., Lu X. H., Ramos E. M., El-Zein K., Zhao Y., Deverasetty S., Tebbe A., Schaab C., Lavery D. J., Howland D., et al. (2016) Integrated genomics and proteomics define huntingtin CAG length-dependent networks in mice. Nat. Neurosci. 19, 623–633 10.1038/nn.4256 [DOI] [PMC free article] [PubMed] [Google Scholar]
- 58. Jeong H., Cohen D. E., Cui L., Supinski A., Savas J. N., Mazzulli J. R., Yates J. R. 3rd, Bordone L., Guarente L., and Krainc D. (2011) Sirt1 mediates neuroprotection from mutant huntingtin by activation of the TORC1 and CREB transcriptional pathway. Nat. Med. 18, 159–165 10.1038/nm.2559 [DOI] [PMC free article] [PubMed] [Google Scholar]
- 59. O'Rourke M. P., and Tam P. P. (2002) Twist functions in mouse development. Int. J. Dev. Biol. 46, 401–413 [PubMed] [Google Scholar]
- 60. Castanon I., Von Stetina S., Kass J., and Baylies M. K. (2001) Dimerization partners determine the activity of the Twist bHLH protein during Drosophila mesoderm development. Development 128, 3145–3159 [DOI] [PubMed] [Google Scholar]
- 61. Bouard C., Terreux R., Honorat M., Manship B., Ansieau S., Vigneron A. M., Puisieux A., and Payen L. (2016) Deciphering the molecular mechanisms underlying the binding of the TWIST1/E12 complex to regulatory E-box sequences. Nucleic Acids Res. 44, 5470–5489 10.1093/nar/gkw334 [DOI] [PMC free article] [PubMed] [Google Scholar]
- 62. Mathelier A., Fornes O., Arenillas D. J., Chen C. Y., Denay G., Lee J., Shi W., Shyr C., Tan G., Worsley-Hunt R., Zhang A. W., Parcy F., Lenhard B., Sandelin A., and Wasserman W. W. (2016) JASPAR 2016: a major expansion and update of the open-access database of transcription factor binding profiles. Nucleic Acids Res. 44, D110–D115 10.1093/nar/gkv1176 [DOI] [PMC free article] [PubMed] [Google Scholar]
- 63. Grant C. E., Bailey T. L., and Noble W. S. (2011) FIMO: scanning for occurrences of a given motif. Bioinformatics 27, 1017–1018 10.1093/bioinformatics/btr064 [DOI] [PMC free article] [PubMed] [Google Scholar]
- 64. Cakouros D., Isenmann S., Cooper L., Zannettino A., Anderson P., Glackin C., and Gronthos S. (2012) Twist-1 induces Ezh2 recruitment regulating histone methylation along the Ink4A/Arf locus in mesenchymal stem cells. Mol. Cell. Biol. 32, 1433–1441 10.1128/MCB.06315-11 [DOI] [PMC free article] [PubMed] [Google Scholar]
- 65. Vesuna F., Lisok A., Kimble B., Domek J., Kato Y., van der Groep P., Artemov D., Kowalski J., Carraway H., van Diest P., and Raman V. (2012) Twist contributes to hormone resistance in breast cancer by downregulating estrogen receptor-α. Oncogene 31, 3223–3234 10.1038/onc.2011.483 [DOI] [PMC free article] [PubMed] [Google Scholar]
- 66. Yang M. H., Hsu D. S., Wang H. W., Wang H. J., Lan H. Y., Yang W. H., Huang C. H., Kao S. Y., Tzeng C. H., Tai S. K., Chang S. Y., Lee O. K., and Wu K. J. (2010) Bmi1 is essential in Twist1-induced epithelial-mesenchymal transition. Nat. Cell Biol. 12, 982–992 10.1038/ncb2099 [DOI] [PubMed] [Google Scholar]
- 67. Zhao X., Deng R., Wang Y., Zhang H., Dou J., Li L., Du Y., Chen R., Cheng J., and Yu J. (2017) Twist1/Dnmt3a and miR186 establish a regulatory circuit that controls inflammation-associated prostate cancer progression. Oncogenesis 6, e315 10.1038/oncsis.2017.16 [DOI] [PMC free article] [PubMed] [Google Scholar]
- 68. Chen E. Y., Xu H., Gordonov S., Lim M. P., Perkins M. H., and Ma'ayan A. (2012) Expression2Kinases: mRNA profiling linked to multiple upstream regulatory layers. Bioinformatics 28, 105–111 10.1093/bioinformatics/btr625 [DOI] [PMC free article] [PubMed] [Google Scholar]
- 69. Margueron R., and Reinberg D. (2011) The Polycomb complex PRC2 and its mark in life. Nature 469, 343–349 10.1038/nature09784 [DOI] [PMC free article] [PubMed] [Google Scholar]
- 70. Morey L., and Helin K. (2010) Polycomb group protein-mediated repression of transcription. Trends Biochem. Sci. 35, 323–332 10.1016/j.tibs.2010.02.009 [DOI] [PubMed] [Google Scholar]
- 71. Aid T., Kazantseva A., Piirsoo M., Palm K., and Timmusk T. (2007) Mouse and rat BDNF gene structure and expression revisited. J. Neurosci. Res. 85, 525–535 10.1002/jnr.21139 [DOI] [PMC free article] [PubMed] [Google Scholar]
- 72. Pruunsild P., Kazantseva A., Aid T., Palm K., and Timmusk T. (2007) Dissecting the human BDNF locus: bidirectional transcription, complex splicing, and multiple promoters. Genomics 90, 397–406 10.1016/j.ygeno.2007.05.004 [DOI] [PMC free article] [PubMed] [Google Scholar]
- 73. Zuccato C., Marullo M., Conforti P., MacDonald M. E., Tartari M., and Cattaneo E. (2008) Systematic assessment of BDNF and its receptor levels in human cortices affected by Huntington's disease. Brain Pathol. 18, 225–238 [DOI] [PMC free article] [PubMed] [Google Scholar]
- 74. Dobrian A. D. (2012) A tale with a Twist: a developmental gene with potential relevance for metabolic dysfunction and inflammation in adipose tissue. Front. Endocrinol. 3, 108 [DOI] [PMC free article] [PubMed] [Google Scholar]
- 75. Franco H. L., Casasnovas J., Rodríguez-Medina J. R., and Cadilla C. L. (2011) Redundant or separate entities?–roles of Twist1 and Twist2 as molecular switches during gene transcription. Nucleic Acids Res. 39, 1177–1186 10.1093/nar/gkq890 [DOI] [PMC free article] [PubMed] [Google Scholar]
- 76. von Schimmelmann M., Feinberg P. A., Sullivan J. M., Ku S. M., Badimon A., Duff M. K., Wang Z., Lachmann A., Dewell S., Ma'ayan A., Han M. H., Tarakhovsky A., and Schaefer A. (2016) Polycomb repressive complex 2 (PRC2) silences genes responsible for neurodegeneration. Nat. Neurosci. 19, 1321–1330 10.1038/nn.4360 [DOI] [PMC free article] [PubMed] [Google Scholar]
- 77. Podtelezhnikov A. A., Tanis K. Q., Nebozhyn M., Ray W. J., Stone D. J., and Loboda A. P. (2011) Molecular insights into the pathogenesis of Alzheimer's disease and its relationship to normal aging. PLoS One 6, e29610 10.1371/journal.pone.0029610 [DOI] [PMC free article] [PubMed] [Google Scholar]
- 78. Mangiarini L., Sathasivam K., Mahal A., Mott R., Seller M., and Bates G. P. (1997) Instability of highly expanded CAG repeats in mice transgenic for the Huntington's disease mutation. Nat. Genet. 15, 197–200 10.1038/ng0297-197 [DOI] [PubMed] [Google Scholar]
- 79. Levine M. S., Klapstein G. J., Koppel A., Gruen E., Cepeda C., Vargas M. E., Jokel E. S., Carpenter E. M., Zanjani H., Hurst R. S., Efstratiadis A., Zeitlin S., and Chesselet M. F. (1999) Enhanced sensitivity to N-methyl-d-aspartate receptor activation in transgenic and knockin mouse models of Huntington's disease. J. Neurosci. Res. 58, 515–532 10.1002/(SICI)1097-4547(19991115)58:4%3C515::AID-JNR5%3E3.0.CO%3B2-F [DOI] [PubMed] [Google Scholar]
- 80. Taiwo O., Wilson G. A., Morris T., Seisenberger S., Reik W., Pearce D., Beck S., and Butcher L. M. (2012) Methylome analysis using MeDIP-seq with low DNA concentrations. Nat. Protoc. 7, 617–636 10.1038/nprot.2012.012 [DOI] [PubMed] [Google Scholar]
- 81. Gujar A. D., Le S., Mao D. D., Dadey D. Y., Turski A., Sasaki Y., Aum D., Luo J., Dahiya S., Yuan L., Rich K. M., Milbrandt J., Hallahan D. E., Yano H., Tran D. D., and Kim A. H. (2016) An NAD+-dependent transcriptional program governs self-renewal and radiation resistance in glioblastoma. Proc. Natl. Acad. Sci. U.S.A. 113, E8247–E8256 10.1073/pnas.1610921114 [DOI] [PMC free article] [PubMed] [Google Scholar]
Associated Data
This section collects any data citations, data availability statements, or supplementary materials included in this article.