

Summary
Silence of FMR1 causes loss of fragile X mental retardation protein (FMRP) and dysregulated translation at synapses, resulting in the intellectual disability and autistic symptoms of Fragile X Syndrome (FXS). Synaptic dysfunction hypotheses for how intellectual disabilities like cognitive inflexibility arise in FXS, predict impaired neural coding in the absence of FMRP. We tested the prediction by comparing hippocampus place cells in wild-type and FXS-model mice. Experience-driven CA1 synaptic function and synaptic plasticity changes are excessive in Fmr1-null mice, but CA1 place fields are normal. However, Fmr1-null discharge relationships to local field potential oscillations are abnormally weak, stereotyped, and homogeneous; also discharge coordination within Fmr1-null place cell networks is weaker and less reliable than wild-type. Rather than disruption of single-cell neural codes, these findings point to invariant tuning of single-cell responses and inadequate discharge coordination within neural ensembles as a pathophysiological basis of cognitive inflexibility in FXS.
Keywords: Fragile X Syndrome, Fmr1, FMRP, place cell, learning, memory, synaptic plasticity, neural coordination, intellectual disability, autism
Introduction
Fragile X syndrome (FXS) is a neurodevelopmental disorder, and is the most common inherited form of intellectual disability and single-gene cause of autism spectrum disorders (ASD) characterized by inflexible behaviors. FXS results from silencing the X-linked FMR1 gene and subsequent loss of its protein product fragile X mental retardation protein (FMRP) (Colak et al., 2014; Pieretti et al., 1991). FMRP is a negative regulator of protein synthesis, and because it binds to over 400 mRNAs, the consequences of FMRP loss are diverse and not fully characterized (Brown et al., 2001; Darnell et al., 2011).
Synaptic dysfunction is the dominant hypothesis to explain the intellectual disability associated with FMRP absence, but these studies of synaptic function have only been performed in brain slices from task-naïve animals (Bear et al., 2004; Waung and Huber, 2009). FMRP absence in Fmr1-null mice dysregulates translation of mRNAs that encode dendrite-localized proteins that contribute to synaptic development and function in both pre- and post-synaptic sites, resulting in abnormal dendritic morphology likely due to altered levels of scaffold proteins and glutamate receptors in postsynaptic densities (Bassell and Warren, 2008; Bhakar et al., 2012; Braun and Segal, 2000; Comery et al., 1997; Deng et al., 2011; Patel et al., 2013). One of the best-characterized forms of FMRP-related synaptic dysfunction in brain slices from task-naïve Fmr1-null mice, is excessive group 1 mGluR-stimulated long-term depression (mGluR-LTD), indicating that some abnormalities associated with FMRP loss depend on neural activity (Bear et al., 2004; Dolen et al., 2010; Huber et al., 2002). Although alterations in hippocampal long-term potentiation (LTP) have been elusive (Godfraind et al., 1996), abnormal features of LTP in hippocampus and neocortical circuits have also been reported in brain slices from task-naïve mice after reducing or eliminating FMRP (Chen et al., 2014; Hu et al., 2008; Hunsaker et al., 2012; Larson et al., 2005; Lauterborn et al., 2007; Yun and Trommer, 2011). Abnormal activity-dependent synaptic physiology in task-naïve Fmr1-null mice, as well as other mutant models of syndromic forms of ASD, have led synaptic dysfunction hypotheses to predict disrupted tuning of the discharge of individual neurons to represent information that underlies intellectual ability (Zoghbi and Bear, 2012), which we will here call the “disruption hypothesis.” However, learning and memory are relatively normal in Fmr1-null animals (Bakker et al., 1994; Bhattacharya et al., 2012; Brennan et al., 2006; D’Hooge et al., 1997; Kooy et al., 1996; Zhao et al., 2005), highlighting the gap in understanding how synaptic dysfunction, measured in task-naïve mice, is related to intellectual disability in FXS and similar disorders. Accordingly, we take a systems approach to understand how FMRP loss causes intellectual disability by studying the “missing middle” level of biological function (Laughlin et al., 2000), assessed by the electrophysiology of synaptic populations (local field potentials, LFPs) and the action potential discharge in ensembles of single neurons.
Like FXS patients (Hooper et al., 2008), Fmr1-null mice exhibit cognitive inflexibility (Chen et al., 2014; Kooy et al., 1996; Krueger et al., 2011). This inflexibility has been measured using dorsal hippocampus-sensitive and synaptic plasticity-dependent active place avoidance task variants that test the ability to discriminate between established and novel spatial memories (Cimadevilla et al., 2001; Hsieh et al., 2017; Kubik and Fenton, 2005; Pastalkova et al., 2006; Pavlowsky et al., 2017; Tsokas et al., 2016). Fmr1-null and wild-type (WT) mice learn and remember equally well the stationary location of a mild foot-shock on a slowly rotating arena in the standard active place avoidance task variant. However, the Fmr1-null mice are impaired when required to discriminate between long-term memory of the initially-learned shock location and the current shock location after the shock zone is either changed or eliminated (Radwan et al., 2016). At the same time, the spectral content of concurrently-recorded LFPs along the dorsal hippocampal somatodendritic axis is indistinguishable between Fmr1-null and WT mice, but the somatodendritic organization of phase-amplitude coupled (PAC) 30-100 Hz gamma oscillation amplitudes and ~8 Hz theta oscillation phases is abnormal. The aberrations are extreme when cognitive inflexibility manifests in memory conflict and memory extinction tests of flexibility; whereas WT PAC is attenuated when the shock zone is changed or eliminated, Fmr1-null PAC persists (Radwan et al., 2016). These observations suggest an alternative “hyperstable/discoordination” hypothesis, that neural information processing is excessively stable and consequently poorly coordinated in the absence of FMRP, leading to inflexible and poorly coordinated neural representations and behavior. We evaluated the disruption and the hyperstable/discoordination hypotheses, which make different predictions for how loss of FMRP affects neural information processing.
To evaluate predictions of the neural information disruption and hyperstability/discoordination hypotheses, we used the neural representation of location in the discharge of hippocampus place cells as a model of flexible cognitive information processing (Fenton, 2015a; Kelemen and Fenton, 2016; Moser et al., 2015; O’Keefe and Nadel, 1978). Whereas the disruption hypothesis asserts altered Fmr1-null hippocampus place coding such as poor quality place fields, the hyperstable/discoordination hypothesis predicts normal place coding that is abnormally indifferent to environmental conditions.
Results
Exaggerated baseline and learning-induced changes of synaptic function in Fmr1-null mice
We began by examining synaptic function in the gene knockout Fmr1-null mouse using ex vivo hippocampal slice physiology. In agreement with prior work (Franklin et al., 2014; Godfraind et al., 1996; Hu et al., 2008; Lauterborn et al., 2007), we find that CA3 Schaffer collateral to CA1 synaptic efficacy and potentiation does not differ between WT and Fmr1-null brain slices taken from task-naïve mice (Fig. 1). We then tested whether synaptic function of task-experienced mice differs, measured one day after memory and control training. Fmr1-null mice performed as well as WT mice (Fig. S1) in the hippocampus- and LTP-dependent active place avoidance task (Cimadevilla et al., 2001; Pastalkova et al., 2006), replicating a prior report (Radwan et al., 2016). We observed training-induced changes in synaptic function, consistent with prior findings using extended training protocols (Park et al., 2015; Pavlowsky et al., 2017). Specifically, greater synaptic efficacy was observed in the trained WT group compared to the home cage group as well as the exposed WT control group that experienced the training environment but were never shocked (Fig. 1A). Synaptic responses from the exposed Fmr1-null group were almost twice as large as the task-naive Fmr1-null and the WT groups (Fig. 1B); synaptic responses in the Fmr1-null trained group were also enhanced, similar to the exposed Fmr1-null group (Fig. 1B). Synaptic potentiation after 100-Hz high frequency stimulation was indistinguishable between the WT and Fmr1-null task-naïve home cage groups, as previously reported (Godfraind et al., 1996; Hu et al., 2008). Potentiation was also similar in the WT task-naïve and exposed control groups and potentiation in these groups was greater than the potentiation in the WT trained group (Fig. 1C), as has been reported after extended training (Pavlowsky et al., 2017). The early and late phases of the potentiation were increased in the exposed Fmr1-null group compared to the Fmr1-null task-naive and trained groups, as well as the WT groups (Fig. 1C,D). Moreover, the difference in the amplitude of synaptic potentiation between the WT trained and exposed groups (Fig. 1C) was substantially smaller than the difference between the Fmr1-null trained and the exposed and task-naive Fmr1-null mice (Fig. 1D). These observations indicate that experience-dependent CA1 synaptic function changes are enhanced in Fmr1-null animals and that experience-driven modulation of CA1 synaptic function is intensified in Fmr1-null mice compared to mice that express FMRP.
Figure 1. See also Figure S1. Abnormal experience-dependent changes of baseline and plastic hippocampal CA3→CA1 synaptic function in Fmr1-null mice.
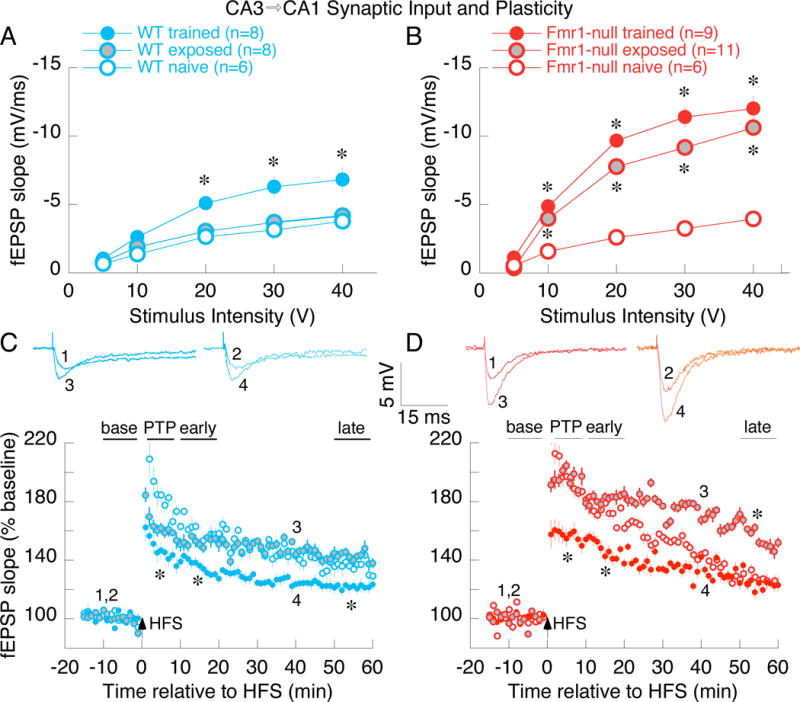
A&B) Comparing efficacy of baseline synaptic transmission in WT (A) and Fmr1-null (B), mice that are either naïve, or after control exposure or memory training in the active place avoidance task. WT and Fmr1-null synaptic responses are indistinguishable in naïve mice (A,B open circles). Memory training enhances responses in both genotypes (A,B filled colored circles); the enhancement is greater in Fmr1-null mice, which unlike WT, show enhancement even after control exposure (B, gray circles). Two-way genotype x training ANOVA on the area under the curve confirmed significant effects of training (F2,42 = 25.7, p = 10−8, ηp2 = 0.55) and the genotype x training interaction (F1,42 = 3.49, p = 0.04, ηp2 = 0.13). Post-hoc Tukey tests confirmed the pattern Fmr1-null-naïve = WT-naïve = WT-exposed < Fmr1-null-exposed = Fmr1-null-trained = WT-trained. C&D) Synaptic potentiation to 100-Hz high-frequency stimulation (HFS) in WT (C) and Fmr1-null (D) mice. HFS induces post-tetanic potentiation (PTP), early-potentiation, and late-potentiation. Potentiation at each phase appears similar in the naïve WT and Fmr1-null mice (C,D open circles) and similar in WT naïve and exposed mice (C, open and gray circles, respectively). Potentiation is greater in exposed than naïve Fmr1-null mice (D, open and gray circles, respectively), but not different between exposed and naïve WT mice (C, open and gray circles respectively). Potentiation is reduced in trained mice of both genotypes (C,D filled colored circles), except late potentiation in trained and task-naive Fmr1-null mice is not different, but is less that in Fmr1-null exposed mice. The genotype x training x phase 3-way repeated measures ANOVA on synaptic plasticity showed significant effects of phase (F3,40 = 214.2, p = 10−24, ηp2 = 1.0), and the genotype x phase (F3,40 = 5.28, p = 0.003, ηp2 = 0.84) and training x phase (F6,80 = 10.6, p = 10−8, ηp2 = 0.80) interactions so each post-stimulus phase was analyzed separately by 2-way genotype x training ANOVA. The de novo protein-synthesis independent PTP and early potentiation changes were greater in exposed Fmr1-null mice than in exposed WT mice (genotype effects - PTP: t42 = 2.79, p = 0.008, d = 1.4; early potentiation: t42 = 3.62, p = 0.0008, d = 1.9) and smaller in trained compared to naïve and exposed mice for each genotype (training effects - PTP: F2,42 = 13.72, p = 10−5, ηp2 = 0.40; early potentiation: F2,42 = 14.42, p = 10−5, ηp2 = 0.41). De novo protein-synthesis dependent late potentiation was not different between the genotypes (t42 = 0.84, p = 0.4, d = 0.51) but it was weakest in the trained groups (training effect: F2,42 = 19.36, p = 10−6, η 2p = 0.48). *p < 0.05 relative to task-naive. In C and D, traces 1 and 2 represent baseline fEPSP responses and traces 3 and 4 represent potentiated fEPSP responses from exposed and trained mice, respectively.
Non-spatial and spatial single-cell discharge features of CA1 place cells are intact in Fmr1-null mice
We then compared the characteristics of dorsal CA1 single unit discharge in freely-behaving WT and Fmr1-null mice in fixed environments (Fig. S2). Of the 1115 single unit waveform clusters that were identified, 499 were recorded from 12 WT mice and 616 were recorded from 9 Fmr1-null mice. When the single unit isolation quality was sufficiently high (IsoIBG and IsoINN each > 4 bits) in standard recordings, these were classified as putative principal cells or interneurons. Thus 226 WT and 334 Fmr1-null presumptive cells comprised the dataset, and were subclassified into functional classes as place cells, putative non-spatial pyramidal cells, and putative interneurons, henceforth referred to without the ‘putative’ adjective. A lower proportion of these were classified as interneurons in WT mice (28, 12.4%) than Fmr1-null mice (98, 29.3%; test of proportions z = 9.4, p = 10−17). However, according to standard criteria (Fig. S3) (Fenton et al., 2008; Fox and Ranck, 1975, 1981), when the putative principal cells were classified as place cells (WT n = 108 (47.8%), Fmr1-null n = 141 (42.2%), the prevalence was lower in the Fmr1-null mice (test of proportions z = 2.04, p = 0.02). The fundamental extracellular waveform and non-spatial discharge characteristics of the classified cells were indistinguishable between the genotypes (Fig. S3 for firing rate, burst propensity, inter-spike interval, and firing rate comparisons). Furthermore, the fundamental measures of spatial discharge quality did not differ between either the WT and Fmr1-null place cells or interneurons (Table S1). Nor did the response to changing the environment enclosure from a square to a circular cylinder appear to differ between the genotypes for the subset of cells that were tested (Fig. S4). Consistent with remapping, the firing rate maps recorded in the two enclosures were typically uncorrelated such that both the WT (n = 25, r = 0.054±0.028, t24=1.92, p = 0.07, r2 = 0.003) and the Fmr1-null (n = 31, r = 0.050±0.027, t30 = 1.89, p = 0.07, r2 = 0.003) distributions of rate map similarities were indistinguishable from independence, although 8/25 WT and 8/31 Fmr1-null place cells were significantly positively correlated (proportions test z = 0.85, p = 0.3). Importantly, the WT and Fmr1-null distributions of z-transformed similarity values were not distinguishable (t54 = 0.10, p = 0.9, d = 0.03). These findings of normal place cell spatial firing properties are unexpected according to disruption hypotheses (Fig. 2).
Figure 2. See also Figure S2 and S3. Similar spatial properties of WT and Fmr1-null CA1 place cells and interneurons in a fixed environment.
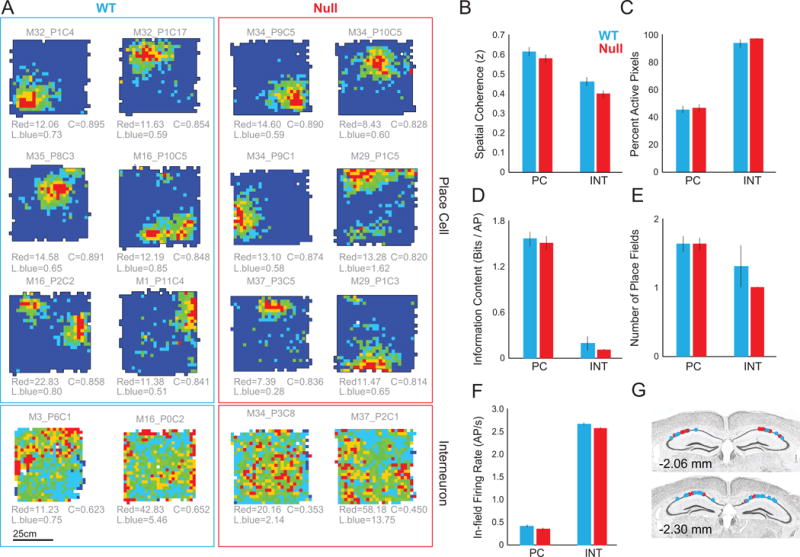
Place cells and interneurons recorded in the box from the A) WT and Fmr1-null mice. Spatial firing quality differs between place cells and interneurons but not between genotypes as assessed by 2-way genotype x cell class ANOVAs. B) Spatial coherence (genotype: F1,340 = 0.60; p = 0.44; ηp2 = 0.0018; cell class: F2,340 = 211.2; p = 10−60; ηp2 = 0.55; interaction; F2,340 = 2.2; p = 0.11; ηp2 = 0.013). C) Proportion of the environment in which the cell discharged (genotype: F1,340 = 3.7; p = 0.06; ηp2 = 0.011; cell class: F2,340 = 105.2; p = 10−36; ηp2 = 0.38; interaction; F1,340 = 2.3; p = 0.10; ηp2 = 0.013). D) Information content (genotype: F1,340 = 3.6; p = 0.06; ηp2 = 0.011; cell class: F2,340 = 58.2; p = 10−22; ηp2 = 0.26; interaction; F2,340 = 2.8; p = 0.06; ηp2 = 0.016). E) Number of place fields (genotype: F1,340 = 0.13; p = 0.72; ηp2 = 0.00038; cell class: F2,340 = 4.0; p = 0.02; ηp2 = 0.023; interaction; F2,340 = 2.2; p = 0.11; ηp2 = 0.013). F) In-field firing rate (genotype: F1,340 = 0.24; p = 0.62; ηp2 = 0.0011; cell class: F2,340 = 188.6; p = 10−56; ηp2 = 0.45; interaction: F2,340=0.009; p = 0.92; ηp2 = 0.00004). G) WT photomicrograph illustrating the placement of recording electrodes in dorsal CA1.
Abnormal spike-field coordination in CA1 of Fmr1-null mice
Although the power spectra of LFP oscillations recorded from the CA1 pyramidal cell layer is indistinguishable between the genotypes in ~8 Hz theta and 30-100 Hz gamma ranges (Fig. S5A), the cross-frequency organization of theta and gamma oscillations differs (Radwan et al., 2016), motivating us to examine how oscillations organize the discharge of individual cells (Fig. S5). Oscillations in the LFP organize discharge in cell-specific and frequency-specific patterns (Fig. 3A). Because locomotion speed influences frequency and amplitude of both theta (McFarland et al., 1975) and gamma (Chen et al., 2011) oscillations, we decided to limit all spike-field analyses only to running states where speed > 2 cm/s although all analyses led to the same conclusions when speed was limited to a narrow speed range of 2-4 cm/s (data not shown). While hyperactivity was previously associated with Fmr1-null behavior in open field environments (Sorensen et al., 2015), during the electrophysiological recordings we did not observe any WT versus Fmr1-null differences in locomotion speed, nor differences in the linearity (opposite of crookedness) of how the mice walked (Fig. 6B). The modulation of place cell discharge in the theta (~8 Hz) and low gamma (~40 Hz) bands is similar between the genotypes (Fig. 3B; Theta: t169 = 0.78, p = 0.44, d = 0.12; Gamma: t169 = 0.61, p = 0.53, d = 0.09). However, the modulation is weaker in Fmr1-null compared to WT non-spatial pyramidal cells (Fig. 3B, C; Theta: t50 = 3.52, p = 0.0009, d = 1.03; Gamma: t50 = 4.25, p < 0.0001, d = 1.15) and interneurons (Fig. 3B, C; Theta: t75 = 3.93, p = 0.0002, d = 1.04; Gamma: t75 = 5.02, p < 0.0001, d = 1.08). We next compared the discharge phase angle in the theta and gamma bands amongst cells of each of the three functional classes. WT place cells discharged at the theta trough, on an earlier theta phase compared to Fmr1-null place cells (Fig. 3B; WT: 353.9±67.3°, Fmr1-null: 32.1±53.1°; Watson-Williams multi-sample test for equal means F1,169 = 8.97, p = 0.003, d = 5.39). In the gamma range, WT place cells discharged on a later gamma phase compared to Fmr1-null (Fig. 3B; WT: 332.2±63.6°, Fmr1-null: 238.8±74.5°, F1,169 = 26.88, p = 10−7, d = 1.34) while WT interneuron cells discharged on an earlier gamma phase compared to Fmr1-null (WT: 218.6±75.0°, Fmr1-null: 10.6±76.4°, F1,75 = 10.52, p = 0.002, d = 2.75). The strength of phase modulation of spiking across the full LFP oscillation frequency spectrum is shown in Fig. 3C for the three functional classes; illustrating there are clear genotypic differences, with a general tendency for Fmr1-null cells to be more weakly modulated than the WT counterpart.
Figure 3. See also Figure S5. Abnormal organization of Fmr1-null principal cell spiking by LFP oscillations.
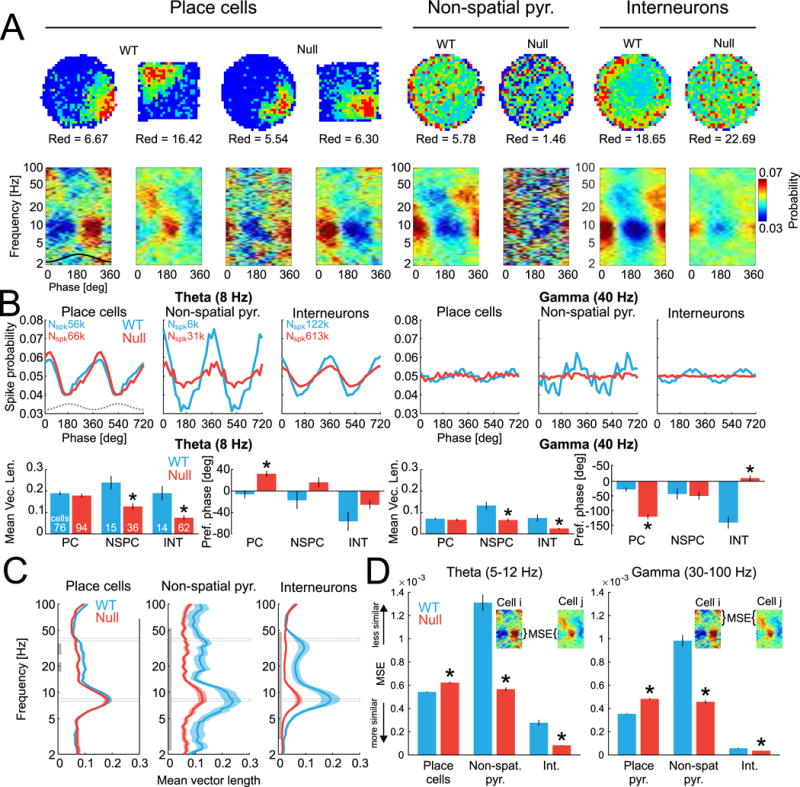
A) Cell-specific spatial firing rate maps and phase-frequency discharge probability histograms of place cells, non-spatial putative pyramidal cells, and putative interneurons. B) Top: Average phase modulation of discharge probabilities for theta (8Hz) and gamma (40 Hz) bands, computed from all spikes of the corresponding functional category. Bottom: Quantification of the phase modulation estimated as mean vector length (left) and the phase preference measured as distance from trough (0°), averaged across individual cells. Cell counts are the same for the theta and gamma bands. C) Coupling strength between spikes and field measured as mean Rayleigh vector length across wide-band frequencies and averaged across cells. The Rayleigh vector is a test statistic for assessing circular homogeneity. The gray vertical line indicates continuous bands with p < 0.05 for at least 3 neighboring frequencies. Gray rectangles mark the theta and gamma frequencies that are used for the group statistics in panel B. D) Mean square error (MSE) differences between phase-frequency discharge probability histograms across all pairs of cells for the theta (5-12 Hz; left) and gamma (30-100 Hz; right) frequency bands. Lower MSE indicates increased similarity. *p < 0.05 between genotypes. Note that while Rayleigh vector length measures polar homogeneity of a sample distribution, MSE measures distinctiveness between a pair of distributions.
Figure 6. Active place avoidance behavior of a subset of mice that contributed single unit data.
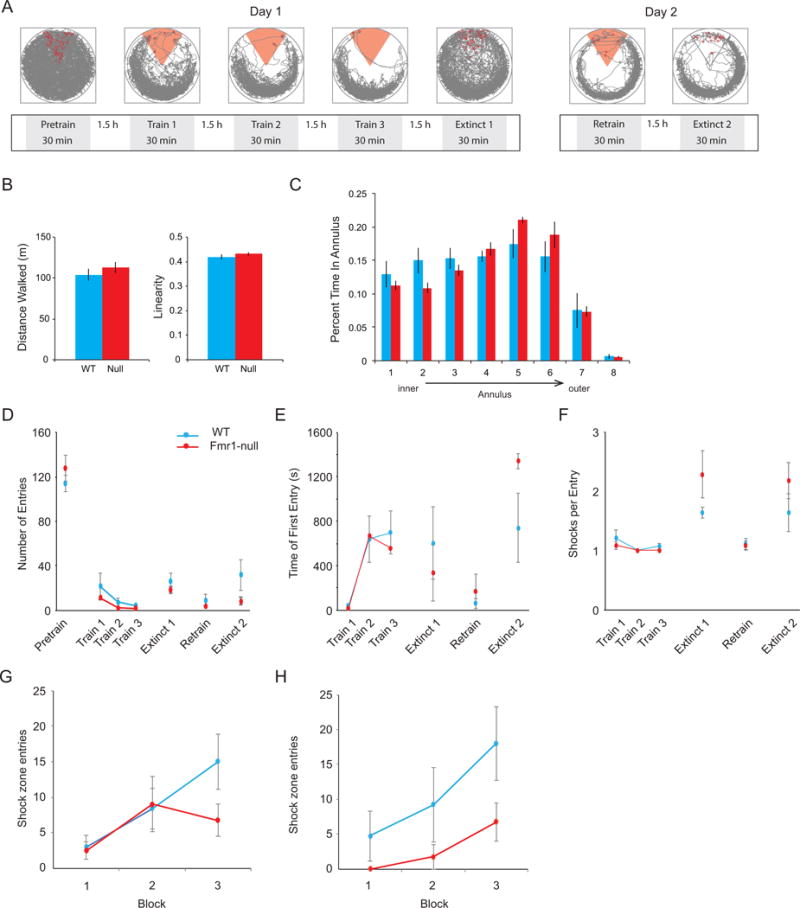
A) Schematic of active place avoidance experimental design with examples of the mouse’s path to illustrate spatial occupancy. On day 1, WT (n = 5) and Fmr1-Null (n = 4) mice were first habituated to the rotating arena in a pretraining trial before receiving three trials of avoidance training with shock turned on, after which an extinction trial was conducted with the shock off. On day 2, mice were first retrained in one trial before a second extinction trial was conducted. The red sector indicates the active shock zone. B) During pretraining open field behavior, there were no genotype differences in total distance travelled (t7 = 1.03, p = 0.5, d = 0.88) or linearity of motion (t7 = 2.97, p = 0.2, d = 0.50). C) A two-way ANOVA was conducted on the influence of genotype and annular region of the environment on the time spent in each of the eight equal-area annuli. While there was an effect of annulus (F7,56 = 330.49, p = 10−43, ηp2 = 0.98), there were no effects of genotype (F1,56 = 1.48, p = 0.2, ηp2 = 0.025) or the genotype x annulus interaction (F7,56 = 0.83, p = 0.6, ηp2 = 0.094). These lack of differences indicate that WT and Fmr1-null mice were not distinct in the ways in which they sampled and moved through the environment either in the presence or absence of shock. D-F) Both WT and Fmr1-null mice learned equally well to avoid the shock zone. The genotype x session repeated measures ANOVA showed no effects of genotype on number of entries (F1,28 = 0.045, p = 0.8, ηp2 = 0.0016), time-to-first entry (F1,28 = 0.10, p = 0.8, ηp2 = 0.0036), or shocks/entry (F1,28 = 1.19, p = 0.28, ηp2 = 0.041) indicating that WT and Fmr1-null did not differ in ability to learn the location of the shock zone, retain location information across trials, or in motivation to escape the shock zone. There was an effect of session on the number of entries (F3,28 = 134.03, p = 10−18, p-η2 = 0.93), the time-to-first-entry (F3,28 = 12.44, p = 10−5, ηp2 = 0.57) and shocks/entry (F3,28 = 147.91, p = 10−17, ηp2 = 0.94), but no interaction (F3,28 = 1.14, p = 0.4, ηp2 = 0.11; F3,28 = 0.1, p = 0.9, ηp2 = 0.014; F3,28 = 0.43, p = 0.7, ηp2 = 0.044) on these measures, respectively. These analyses indicate that the groups could not be distinguished in learning to avoid the shock zone. G) The two-way ANOVA was conducted on the influence of genotype and 10-min time block on the number of errors (entrances into the former shock zone) for each of the two extinction sessions. During the first extinction session the effect of block (F2,21 = 4.24, p = 0.03, ηp2 = 0.29) was significant but not the effects of genotype (F1,21 = 1.33, p = 0.3, ηp2 = 0.06) or the interaction (F2,21 = 1.39, p = 0.3, ηp2 = 0.12), suggesting equivalent extinction learning in WT and Fmr1-null mice. H) During the second extinction session, there were significant effects of genotype (F1,18 = 7.00, p = 0.02, ηp2 = 0.28) and of block (F2,18 = 3.98, p = 0.04, ηp2 = 0.31), and no interaction (F2,18 = 0.40, p = 0.7, ηp2 = 0.043), indicating that although both genotypes learned throughout the second extinction session, the Fmr1-null entered the original shock zone less frequently during each time block. This pattern of initially similar WT and Fmr1-null avoidance but greater avoidance in the Fmr1-null during a second extinction session has been reported (Radwan et al., 2016).
We then investigated the heterogeneity of the phase-frequency discharge probability relationships amongst cells of each of the three functional classes in the theta and gamma bands by computing the mean-square error (MSE) between the phase-frequency discharge probability histograms of all pairs of cells (Fig. 3D). These relationships were the most stereotyped (corresponding to low MSE) for interneurons in both genotypes while the relationships were the least stereotyped (corresponding to high MSE) for non-spatial pyramidal cells in both genotypes. The relationship was more stereotyped in WT compared to Fmr1-null place cells in the theta (5-12 Hz) and gamma (30-100 Hz) frequency ranges (Fig. 3D; theta: t7219 = 6.16; p = 10−10, d = 0.14; gamma: t7219 = 11.32; p = 10−29, d = 0.27). The non-spatial pyramidal cells and interneurons were more stereotyped in Fmr1-null mice compared to WT mice in both the theta and gamma ranges (Fig. 3D; theta: non-spatial pyramidal cells: t733 = 15.30; p = 10−46, d = 1.61; interneurons: t1980 = 14.46; p = 10−45, d = 1.55; gamma: non-spatial pyramidal cells: t733 = 12.92; p = 10−34, d = 1.36; interneurons: t1980 = 5.02; p = 10−7, d = 0.54). These data indicate that while individual place cells in the Fmr1-null mice are less organized by the phase of theta and gamma oscillations in the LFP than in WT mice, the Fmr1-null non-place encoding pyramidal cells and interneurons are nonetheless more stereotyped in the particular ways that spiking is organized by the oscillations that arise from population synaptic activity.
Reduced spatial discharge coordination and weaker network states in the short-time scale discharge dynamics of Fmr1-null place cells
We next examined the reliability of spatial discharge by measuring overdispersion during passes through the place fields (Fenton et al., 2010; Fenton and Muller, 1998; Jackson and Redish, 2007). The overdispersion of WT mouse place cells in standard environments was comparable to what has been reported for rats (Fenton et al., 2010; Fenton and Muller, 1998; Hok et al., 2012; Jackson and Redish, 2007). Overdispersion was lower (spatial firing was more reliable) in Fmr1-null mice when the unit of analysis is a pass through a place field (WT n = 6776 passes, σ2 = 5.81; Fmr1-null n = 9102 passes, σ2 = 4.89) compared by parametric statistics (F-test: F6775,9101 = 1.19, p = 10−17) and non-parametric statistics (Levene’s test F1, 15874 = 22.21, p = 10−6). Overdispersion was also marginally lower in Fmr1-null mice when the unit of analysis is a place cell (WT: n = 80; σ2 = 5.98±0.44; Fmr1-null: n = 98; σ2 = 5.02±0.3; t176 = 1.87, one-tailed p = 0.03; Mann–Whitney U = 3,386, one-tailed p = 0.06, d = 0.28).
This greater spatial discharge reliability of individual Fmr1-null place cells is accompanied by significantly less spatial discharge covariance (Fig. 4A) of the Fmr1-null cell pairs with overlapping place fields and at least 30 passes through both firing fields (Fig. 4B; n = 249 pairs, average r = 0.04±0.01) compared to WT cell pairs (n = 109 pairs, average r = 0.09±0.03; t356 = 2.39 p = 0.02; Mann-Whitney U = 12,424, p = 0.2, d = 0.27). Moreover, this genotypic difference in cell-pair discharge covariance disappears after random permutations to disrupt the correspondence between the normalized firing values (z) for the cells in each pair, confirming that the cell-pair covariance difference is unlikely to be spurious (t356 = 0.8 p = 0.4; Mann-Whitney U = 5,834; p = 0.9). In fact, the difference is maintained when at least 40 qualified passes were required, providing increased confidence in the covariance estimates (WT n = 56 pairs, Fmr1-null n = 173 pairs, average WT r = 0.19±0.04, Fmr1-null r = 0.06±0.01; t227 = 4.2 p = 10−4; Mann-Whitney U = 3,791; p < 0.01, d = 0.62). These findings indicate that loss of FMRP selectively reduces the positively coordinated firing rate fluctuations between place cells on the timescale of the 1-5 seconds that it takes to traverse a firing field (Fenton and Muller, 1998).
Figure 4. Weak network states of Fmr1-null place cell ensembles estimated by the set of spike train correlations.
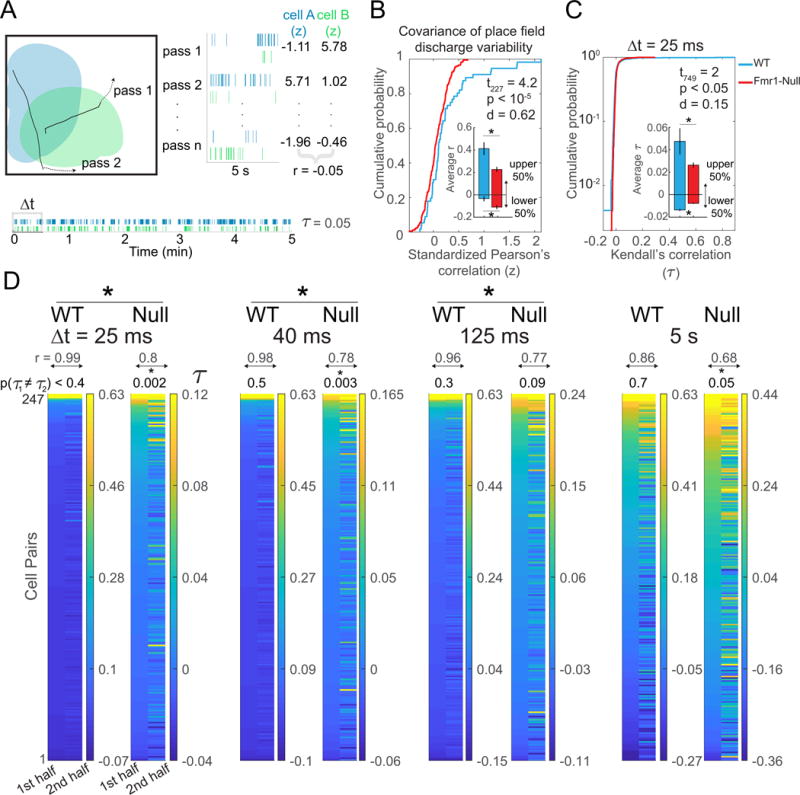
A) Schematic illustrating two place cell firing fields that are overlapping, with two 5-s trajectories that pass through both fields. Bottom: 5-min spike rasters from example cells and Right: a 5-s raster subsample with corresponding standardized firing (z) values depicted for n passes. B) Pearson’s correlation of the two sets of z values describes the covariance of the place field discharge variability between the two cells. These WT and Fmr1-null cumulative probability distributions of all the pairwise correlations illustrate reduced covariance of the Fmr1-null place field discharge variability (t227 = 4.2 p = 10−4; Mann-Whitney U = 3,791; p < 0.01, d = 0.62). Inset shows average Pearson’s correlation for the upper and lower 50% of the distribution, which indicates that the genotypic difference is due to the more strongly coupled cell pairs (upper 50% of distribution: t = 5 p < 10−5, Mann-Whitney U = 723, p = 0.001,113 d = 0.47; lower 50% of distribution, t112 = 3.1 p = 0.002, Mann-Whitney U = 747, p = 0.003, d = 0.11). C) Weaker temporal coupling within Fmr1-null place cell ensembles compared to WT ensembles measured by Kendall’s correlation (τ), here assessed at the gamma Δt = 25-ms time scale. Inset shows average correlation for the upper and lower 50% of the distribution indicates that the genotypic difference is due to less extreme strongly coupled cell pairs as well as less extreme weakly coupled cell pairs in Fmr1-null mice (upper 50% of distribution, t374 = 2.5 p < 0.01, WT n = 124, Fmr1-null = 252, Mann-Whitney U = 13,774 p = 0.06, d = 0.17; lower 50% of distribution, t373 = 6.4 p < 3×10⁻¹⁰, WT n = 123, Fmr1-null = 252, Mann-Whitney U = 8,390, p = 5.5×10⁻¹³, d = 0.57). D) Kendall’s correlation computed at a particular resolution (Δt) estimates coupling of the two spike trains. Each pair of columns depicts the two PCorr vectors of τ between the set of simultaneously recorded place cell spike trains during 5-min intervals (PCorr vectors of Fmr1-null cell pairs were down-sampled to 247 for better visual comparison with WT, only, total n = 504; each color scale set to 70% max and min τ value of respective PCorr vectors). The correlations from the earlier interval are sorted high to low and the cell-pair identities are preserved across intervals, to illustrate the recurrence of the network state that the vectors estimate. Recurrence is estimated by the PCo, Pearson correlation of the two PCorr vectors (r), which is given at the top of each vector pair. Across the gamma (25 and 40 ms), theta (125 ms) and behavioral (5 s) timescales, positive correlations between Fmr1-null place cells tend to be less prevalent and the network state is less likely to recur (df = 246 and 503 for the WT and Fmr1-null respectively; Δt = 25ms: t749 = 2.0 p = 0.05, Mann-Whitney U =51 894, p = 0.0002, d = 0.15; Δt = 40 ms: t749 = 1.8 p = 0.07 Mann-Whitney U =53 512, p = 0.002, d = 0.14; Δt = 125ms: t749 = 1.4 p = 0.16, Mann-Whitney U = 55 708, p = 0.02, d = 0.11; Δt = 250ms: t749 = 1.2 p = 0.2, Mann-Whitney U = 57 466 p = 0.09, d = 0.09; Δt = 1s: t749 = 1 p = 0.3 Mann-Whitney U = 60 801 p = 0.6, d = 0.09; Δt = 5s: t749 = 1.6 p < 0.1, Mann-Whitney U = 60 313 p = 0.5, d = 0.13). The p value for the paired t test comparison between the two halves of the recording is given at the top of each PCorr pair to estimate the recurrence of the correlations across the two halves of the recording (Δt = 25ms: WT t246= 0.9 p = 0.4; Fmr1-null t503= 3.03 p = 0.002, d = 0.12; Δt = 40 ms: WT t246= 0.6 p = 0.5; Fmr1-null t503= 3 p = 0.003, d = 0.12; Δt = 125ms: WT t246= 1.02 p = 0.3; Fmr1-null t503= 1.7 p = 0.09, d = 0.07; Δt = 250ms: WT t246= 1.0 p = 0.3; Fmr1-null t503= 2.4 p = 0.02, d = 0.06; Δt = 1s: WT t246= 0.9 p = 0.4; Fmr1-null t503= 2.6 p = 0.001, d = 0.06; Δt = 5s: t246= 0.3 p = 0.7; Fmr1-null t = 2.0 p = 0.046, d = 0.11). *p < 0.05 between genotypes.
We continued by examining whether Fmr1-null place cells form weaker network states as suggested by this weak spatial discharge coordination. The location-independent, time scale-specific Kendall’s correlation (τ) between each pair of simultaneously-recorded principal cells directly estimates the strength of the network states (Neymotin et al., 2017; Schneidman et al., 2006). At the 25-ms (Fig. 4C,D) and 40-ms time scales of gamma oscillations, as well as the 125-ms time scale of theta oscillations, Fmr1-null cell pair discharge correlations (n = 504 pairs) were significantly weaker than those of WT cell pairs (n = 247 pairs; Fig. 4D; Δt = 25 ms: WT τ = 0.017±0.006, Fmr1-null τ = 0.009±0.0012, Mann-Whitney U = 51,894, p = 0.0002, d = 0.15; Δt = 40 ms: WT τ = 0.02±0.007, Fmr1-null τ = 0.01±0.002, Mann-Whitney U = 53,512, p = 0.002, d = 0.14; Δt = 125 ms: WT τ = 0.02±0.008, Fmr1-null τ = 0.017±0.003, Mann-Whitney U = 55,708, p = 0.02, d = 0.11). The same trend was observed at 1s and 5s time scales, however the differences did not reach significance (Δt = 1 s: WT τ = 0.04±0.01, Fmr1-null τ = 0.03±0.005, Mann-Whitney U = 60,801, p = 0.6, d = 0.09; Δt = 5 s: WT τ = 0.03±0.01, Fmr1-null τ = 0.01±0.008, Mann-Whitney U = 60,313, p = 0.5, d = 0.13). Thus, weaker network states of principal cell discharge result from loss of FMRP at sub-second time scales of gamma and theta oscillations. These states are also less likely to recur in Fmr1-null ensembles compared to WT ensembles, estimated by Pearson’s correlation of the vector of Kendall correlations from the two halves of a recording, known as population coordination (PCo; Neymotin et al., 2017). Not only was WT PCo greater at the various time scales, but pair-wise t tests could not reject the hypothesis that the WT vector of Kendall correlations from the two halves of a recording are the same whereas the corresponding Fmr1-null comparisons were all significantly different, indicating the Fmr1-null correlated discharge activity was unstable at time scales from 25 ms to 5 s in comparison to WT (Fig. 4D). These genotypic differences were unlikely to be due to differences in locomotion because the changes in locomotion across the two halves of the session were not distinct between the WT and Fmr1-null mice (Fig. S5B; genotype: F1,27 = 0.94, p = 0.94, ηp2 = 0.005; epoch: F1,27 = 7.39, p = 0.01, ηp2 = 0.012; interaction: F1,27 = 2.16, p = 0.15,ηp2 = 0.012).
Similar to place cell ensembles, Fmr1-null cell pair discharge correlations of non-spatial pyramidal cells (n = 203 pairs) were significantly weaker than those of WT cell pairs (n = 252 pairs; Δt = 25 ms: WT τ = 0.03±0.006, Fmr1-null τ = 0.007±0.002, Mann-Whitney U = 22 437, p = 0.03, d = 0.28; Δt = 40 ms: WT τ = 0.03±0.006, Fmr1-null τ = 0.008±0.002, Mann-Whitney U = 22 318, p = 0.02, d = 0.26; Δt = 125 ms: WT τ = 0.04±0.007, Fmr1-null τ = 0.01±0.003, Mann-Whitney U = 21 745, p = 0.007, d = 0.29). The same trend was observed at 1-s and 5-s time scales, however 5-s differences did not reach significance (Δt = 1 s: WT τ = 0.06±0.008, Fmr1-null τ = 0.03±0.007, Mann-Whitney U = 21,977, p = 0.01, d = 0.24; Δt = 5 s: WT τ = 0.08±0.009, Fmr1-null τ = 0.05±0.01, Mann-Whitney U = 23,333, p = 0.12, d = 0.12). Thus, weaker network states of non-spatial principal cell discharge result from loss of FMRP at sub-second time scales of gamma and theta oscillations, as well as behavioral time scales.
To test if these findings of weaker network states are general or specific for the active behaviors in the arena, we also examined the spike train correlations in the subset of place cells (WT: n = 125 cell pairs from 35 cells in 6 mice; Fmr1-null: n = 195 cell pairs from 39 cells in 4 mice) that were also recorded during quiet wakefulness and sleep. Spike train correlations did not differ at the gamma time scale (Δt = 25 ms: WT τ = 0.007 ± 0.002, Fmr1-null τ = 0.006 ± 0.002 Mann-Whitney U = 11,248, p = 0.24, d = 0.06; Δt = 40 ms: WT τ = 0.01±0.003, Fmr1-null τ = 0.007±0.003 Mann-Whitney U = 11,026, p = 0.15, d = 0.09), whereas the Fmr1-null correlation distribution was weaker at theta and 1-s time scales (Δt = 125ms: WT τ = 0.015±0.006, Fmr1-null τ = 0.006±0.005, Mann-Whitney U = 10,583, p < 0.05, d = 0.13; Δt = 250ms: WT τ = 0.02±0.007, Fmr1-null τ = 0.006±0.006, Mann-Whitney U = 10,397 p = 0.03, d = 0.14; Δt = 1s: WT τ = 0.02±0.01, Fmr1-null τ = 0.002±0.01, Mann-Whitney U = 10,629 p < 0.05, d = 0.13; Δt = 5s: WT τ = 0.02±0.014, Fmr1-null τ = 3×10⁻⁵ ±0.012, Mann-Whitney U = 10,917 p = 0.12, d = 0.10). These genotypic differences were mainly due to lower Fmr1-null correlations in the lower half of the distribution (data not shown). These findings during quiet behaviors confirm that network states are weaker in the interactions amongst Fmr1-null place cells across multiple behavior states, but should be interpreted with caution because genotypic differences in behaviors and sleep stages were not investigated during the analyzed period of quiet behaviors.
During dissociation of spatial frames, the fluctuations of spatial-frame specific place cell discharge is more weakly coordinated in Fmr1-null than in wild-type ensembles
Continuous rotation of the circular arena dissociates the environment into the spatial frames of the stationary room and the rotating arena, allowing us to examine the ability of place cell ensembles to dynamically switch between representing locations in the dissociated spatial frames on sub-second timescales (Kelemen and Fenton, 2010, 2016). Although mice in the rotating arena were not performing an explicit navigation or spatial memory task and were not shocked or otherwise manipulated, place cell discharge alternated between signaling locations in the stationary and rotating spatial frames in both genotypes (Fig. 5). The session-averaged frame-specific spatial firing was better organized in the room frame, and this preference was similar for the two genotypes (Fig. S6). Figure 5A illustrates the dynamics of frame-specific discharge during rotation, measured as the time series of ΔIpos. This frame-specificity spontaneously alternates between the stationary and rotating frames and is overall stronger in the Fmr1-null mice compared to WT (Fig. 5B). Place cells from both genotypes tended to preferentially signal stationary locations over rotating locations.
Figure 5. See also Figure S6. Abnormal spatial frame-specific place cell discharge in Fmr1-null place cells during environmental dissociation.
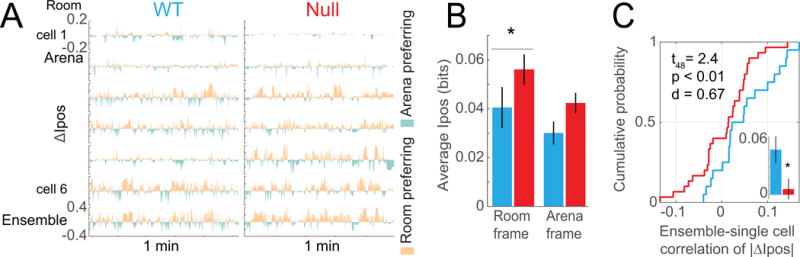
A) WT and Fmr1-null single-cell examples of ΔIpos time series illustrating the spatial frame-specific positional information alternation between the stationary room and rotating arena frames. Ipos is computed at 133 ms resolution. Each time series depicts the cell-specific difference between Ipos in the room frame and Ipos in the arena frame (ΔIpos). The ensemble ΔIpos time series is depicted on the bottom row. B) Average ± s.e.m. of the room-specific and arena-specific Ipos values for WT (n = 20 cells) and Fmr1-null (n = 31 cells). Room-specific Ipos is greater in Fmr1-null compared to WT (Mann-Whitney U = 208, p < 0.05, d = 0.45) whereas Arena-specific Ipos is only marginally greater in Fmr1-null (Mann-Whitney U = 213, p = 0.06, d = 0.57). C) Cumulative probability distributions and average ± s.e.m. (inset) summarizing the correlations of frame-specific positional discharge fluctuations |ΔIpos| between single place cells and the rest of the ensemble (WT n = 20, Fmr1-null n = 30, t48 = 2.4, p < 0.01, d = 0.67). *p < 0.05 between genotypes.
We then examined how well these dynamics were correlated amongst the network of cells by asking how the frame-specific spatial coding dynamics of a single cell is correlated with the frame-specific spatial coding fluctuations of the remaining ensemble of cells. The ensemble fluctuations of frame-specific discharge (|ΔIpos|) were computed for all simultaneously recorded cells except one, and the correlation of the ensemble and “left-out” single cell |ΔIpos| time series was calculated. The association between the ensemble and single left-out cells was weaker in Fmr1-null compared to WT place cells (Fig. 5C), further indicating weaker network states in the Fmr1-null mice.
Correlated network discharge predicts cognitive performance
Finally, we explored whether the estimates of neural coordination that can distinguish Fmr1-null and WT mice can also predict cognitive ability. Nine of the mice (5 WT and 4 Fmr1-null) from which we recorded place cell ensemble activity also subsequently received active place avoidance training to assess their cognitive ability (Fig. 6). We took the most commonly used measure of place avoidance, the number of errors (entrances to the shock zone) during training as an index of cognitive ability that did not differ between the genotypes. Despite the modest number of subjects, this index of poor performance was positively correlated with inconsistently coordinated discharge during passes across the firing fields of pairs of place cells, which was estimated by the correlating avoidance performance with the S.E.M. of the covariance in place cell discharge as the mouse traverses a pair of firing fields (e.g. Fig. 4B; r = 0.61, p = 0.04, r2 = 0.37). This relationship hints that poor cognitive performance may be associated with weakly correlated network discharge. We thus examined the extent to which place avoidance performance can be predicted from the average Kendall correlation amongst the pairs of place cells that were recorded from a single mouse (e.g. Fig. 4C-D), because this value estimates the strength of correlated network activity (Schneidman et al., 2006). Indeed, place avoidance performance was negatively correlated with Kendall’s correlation; the relationship was strongest at the gamma and theta time scales of 25 ms (r = −0.87, 1-tailed p = 0.001, r2 = 0.75) and 40 ms (r = −0.80, 1-tailed p = 0.005, r2 = 0.63), 125 ms (r = −0.62, 1-tailed p = 0.04, r2 = 0.38), whereas the relationship was no longer significant at 250-ms (r = −0.47, 1-tailed p = 0.1, r2 = 0.22) time scales and longer.
Discussion
Experience-dependent synaptic function abnormalities, and intact place cell tuning in Fmr1-null mice
The basic place cell properties that we measured are disrupted by a variety of genetic manipulations that affect synaptic plasticity, including deletion of NMDA receptors (Dragoi and Tonegawa, 2013; McHugh et al., 1996; McHugh et al., 2007; Nakazawa et al., 2002; Nakazawa et al., 2003), the kinases PKA (Rotenberg et al., 2000), and CaMKII (Cho et al., 1998; Rotenberg et al., 1996), but effects of Fmr1 deletion on hippocampal information processing during behavior have not been previously described. The absence of the gene product, FMRP dysregulates translation of hundreds of mRNAs, modifying the expression of channel proteins (Brown et al., 2001; Gross et al., 2011), and altering neuronal excitability and synaptic function in hippocampus, and possibly throughout the brain as assessed by in vitro studies (Deng et al., 2011; Gibson et al., 2008; Zhang and Alger, 2010; Zhong et al., 2010). Such consequences have motivated disruption hypotheses that predict impaired information processing in the neural networks of individuals without FMRP. However, the present findings appear incompatible with disruption hypotheses and strongly support alternative hyperstable/discoordination hypotheses for the consequences of FMRP loss in a neural circuit leading to intellectual disability in FXS. While we confirmed that Schaffer collateral synaptic transmission and plasticity are indistinguishable between naïve WT and Fmr1-null brain slices as previously reported (Franklin et al., 2014; Godfraind et al., 1996; Hu et al., 2008; Lauterborn et al., 2007), we also uncovered substantial abnormalities in the Fmr1-null mice, but only after spatial experience (Fig. 1). The experience-dependent increase in synaptic transmission and synaptic plasticity were observed 24-h after active behavior in a novel environment as we have shown before in WT mice (Pavlowsky et al., 2017), but the changes are excessive in Fmr1-null mice; manifest whether or not place learning was conditioned. WT mice only express such changes after conditioning (Fig. 1). This, the first demonstration of these abnormalities of the Fmr1-null mouse, are consistent with reduced translation repression causing excessive experience-dependent long-term changes in synaptic function. While this has been hypothesized on the basis of exaggerated mGluR-LTD, it has not been generalized to enhanced plasticity (Bear et al., 2004; Zoghbi and Bear, 2012). The present demonstration, one of the first demonstrating that synaptic transmission and potentiating synaptic plasticity are abnormally enhanced in the absence of FMRP, highlights the importance and value of incorporating behavioral assessment into studies of brain slices to assess cellular and network parameters to understand mechanisms of behavior and cognition.
This study is also one of the first to extend the investigation of the mechanisms of behavior and cognition in FXS to a freely-behaving mouse model of the disorder. We find that in freely-behaving Fmr1-null mice, the basic single-cell electrophysiological properties of dorsal CA1 neurons are normal. Although we classified more single units as putative interneurons in Fmr1-null mice and a lower proportion of the putative principal cells as place cells, these differences could easily be due to sampling biases. Importantly, the place cell discharge properties were nonetheless normal, suggesting complex information processing is also intact (Fig. 2). Indeed, the spatial firing properties of Fmr1-null and WT place cells were indistinguishable, even across changed environments (Fig. S4) and if anything, place fields were better preserved during the challenge of arena rotation (Fig. S6) that dissociates space into two distinct spatial frames. Rotation disturbs rat place cells if there has been no spatial training (Zinyuk et al., 2000). While disruption was not observed in non-spatially trained mice (Figs. 5; S6), the similarly intact place cell responses of Fmr1-null and WT mice parallels the intact memory and navigation that Fmr1-null mice display (Fig. S1) during place avoidance tasks on the rotating arena (Radwan et al., 2016). Indeed, like others (Bakker et al., 1994; Bhattacharya et al., 2012; Brennan et al., 2006; D’Hooge et al., 1997; Zhao et al., 2005), the most reliable cognitive deficits we have previously detected in Fmr1-null mice is cognitive inflexibility; impaired ability to update learned avoidance of a shock zone when the location of shock changed (Radwan et al., 2016; see also Fig. S7). If one interprets the hippocampus place code as a dedicated code (see Fenton, 2015a), then these findings directly contradict predictions from disruption hypotheses: place cell cognitive information processing appears normal despite abnormal experience-dependent synaptic function. Importantly, we have argued that the hippocampus place code is not a dedicated code and instead should be interpreted as an ensemble code comprised of neurons with mixed selectivity responses (Fenton et al., 2008; Park et al., 2011; Xie et al., 2016). This interpretation emphasizes the temporal interactions in the discharge between cells, called neural coordination, and deemphasizes single cell discharge properties like firing rates and place fields, in light of multimodal response tuning (Buzsaki, 2010; Fenton, 2015a, b; Fusi et al., 2007; Harris et al., 2003; Phillips and Singer, 1997). Indeed, our correlation analyses find that estimates of cognitive performance in the place avoidance task are predicted by estimates of correlated place cell network discharge on the time scales of gamma and theta; no such relationship was identified between cognitive variables and single cell measures of place field quality (e.g. Map Coherence: r = −0.32, p = 0.2, r2 = 0.11, Information Content: r = 0.27, p = 0.24, r2 = 0.07). Together these findings point to the importance of neural coordination as a potential neural measure of cognition, and that these can be accomplished by pair-wise estimates of the characteristics of higher-order hippocampus network dynamics (Meshulam et al., 2017; Schneidman et al., 2006).
Neural discoordination in the hippocampus network of Fmr1-null mice
Consistent with alternative hyperstable/discoordination hypotheses that interpret the hippocampus place code as an ensemble code, hippocampal discharge is by no means normal in Fmr1-null mice. The substantial abnormalities argue for a different conceptualization of the pathophysiology that can explain cognitive dysfunction in FXS and autism, and perhaps other conditions that are characterized by cognitive information processing deficits (Phillips and Silverstein, 2003; Uhlhaas and Singer, 2007). The coordinated activity between groups of hippocampal principal cells is abnormal in Fmr1-null mice, indicating a dissociation between intact single cell properties and the temporal coordination of their interactions at the level of the hippocampus information processing network, as predicted by discoordination hypotheses for cognitive dysfunction both generally (Fenton, 2015b; Lee et al., 2014) and in the case of FXS in particular (Radwan et al., 2016). Accordingly, inferences from single cell properties can be misleading, and instead, it may be the temporally-organized interactions amongst cells that provide informative indicators of cognitive function (Buzsaki, 2010; Fenton, 2015a, b; Johnson et al., 2009; Okun et al., 2015; Suh et al., 2013).
Relationships between the discharge of single CA1 cells and oscillations in the LFP generated by synaptic interactions amongst large numbers of cells reveal abnormally weak coupling between individual cells and the population in Fmr1-null mice (Fig. 3B). Furthermore, the set of these weak relationships is abnormally stereotyped. Within this abnormal weakly-correlated network state, we also observed a substantially reduced variety of spike-phase relationships between non-spatially tuned cells and theta oscillations in the Fmr1-null LFP (Fig. 3C). Thus, activity within the Fmr1-null hippocampus network of principal cells forms an abnormally invariant and weak spatial firing network infrastructure within which the intact single cell location-specific activity of place cells is embedded. Because principal cells in hippocampus drive inhibition that organizes network dynamics crucial for information processing (reviewed in Buzsaki, 2010), it is possibly pathological that in Fmr1-null mice there is an increased prevalence of non-spatial pyramidal cells, with spiking that is poorly organized by the ongoing LFP (Fig. 3B), forming a relatively functionally-homogeneous group of neurons (Fig. 3C). This may be one of the contributors to both the weak network states (Fig. 4) and the paradoxically rigid single place cell properties of Fmr1-null mice during arena rotation (Figs. 5).
System-level origins of intellectual disability in FXS
The interactions between the spike trains of multiple cells provide crucial additional evidence that despite their intact place tuning properties, individual Fmr1-null place cells form abnormally weakly coordinated networks at the time scale of inhibition-associated gamma and theta oscillations, as well as an abnormally weakly coordinated network of cells at multiple longer time scales up to a few seconds (Fig. 5). Together these findings provide a novel conceptual picture of intellectual disability in FXS and the associated autistic features; Fmr1-null neural circuits are comprised of functionally normal individual cells (Fig. 2) that express stereotypically weak discharge relationships to the phases of ongoing oscillations in the LFP and form correspondingly weak network states because they inadequately cohere into common-function neural ensembles (Fig. 4; 5D). This viewpoint can account for findings that basic learning and memory are intact whereas cognitive and memory inflexibility characterize FXS-model mice (Radwan et al., 2016). If correct, this should engender optimism because therapeutic approaches may only need to target the mechanisms of coordination rather than the potentially less easy to manipulate mechanisms that establish and tune the response properties of individual cells.
Going forward, in the pursuit of novel therapies, it will be important to identify proximal mechanisms of the discoordination associated with FMRP absence. Initial clues point to inhibition abnormality in the regulation of spike timing (Anastassiou et al., 2010), more so than increased excitability which may also explain increased seizure likelihood in the absence of FMRP (Dolen et al., 2007; Zhong et al., 2010).
STAR METHODS
CONTACT FOR REAGENT AND RESOURCE SHARING
Further information and requests for resources and reagents should be directed to the Lead Contact André Fenton (afenton@nyu.edu).
EXPERIMENTAL MODEL AND SUBJECT DETAILS
Wild-type mice with a mixed C57BL6/129 background were used as well as Fmr1-null mice carrying the Fmr1tm1Cgr allele on the same mixed C57BL6/129 background (Jackson Lab strain number 003025). The mutant mice were obtained from Jackson Laboratories (Bar Harbor, ME) to establish local colonies, and housed in a room with a 12-h light/dark cycle (light on at 7 am) with access to food and water ad libitum. All experimental procedures were performed as approved by the Institutional Animal Care and Use Committees of NYU and the SUNY, Downstate Medical Center, and according to NIH and institutional guidelines and the Public Health Service Policy on Humane Care and Use of Laboratory Animals.
METHOD DETAILS
Ex vivo slice electrophysiology
Male WT (n = 22) and Fmr1-null mice (n = 26) aged 3-4 months were anesthetized with isoflurane (5% in 100% O2 for 3 min) 30 min after behavioral examination. They were rapidly decapitated and the brain removed to obtain transverse hippocampal slices (400 μm) from the right dorsal hippocampus. Slices were incubated for 2 hours in oxygenated aCSF (in mM: 119 NaCl, 4.9 KCl, 1.5 MgSO4, 2.5 CaCl2, 26.2 NaHCO3, 1 NaH2PO4 and 11 Glucose saturated with 95% O2, 5% CO2), and then were placed in a submerged chamber subfused with aCSF at 35-36°C for recording. A pair of stimulation (bipolar; FHC & Co, ME, USA) and recording electrodes (borosilicate glass pipette filled with aCSF; 5-10 MΩ) was used to evoke and record field excitatory postsynaptic potentials (fEPSP) at the CA1 stratum radiatum. Stimulus-response curves were obtained by delivering square pulses (50 μs) at increasing voltages (0-40 V). For synaptic potentiation studies, the test pulse intensity was set at 40% of the maximum fEPSP slope amplitude and sampled once per minute. After a stable baseline response was established, a single 1-s 100-Hz stimulation (high-frequency stimulation, HFS) was delivered to induce long-lasting potentiation. All data sets were normalized to baseline (pre-HFS) values. Slope amplitudes between conditions were compared at three phases of potentiation relative to the baseline: i) post-tetanic potentiation (PTP) measured by averaging during the first 8 min after HFS, early-potentiation measured by averaging during the 10-20 min after HFS, and late-potentiation measured by averaging during 50-60 min after HFS, measured relative to the 10 min baseline before HFS.
In vivo electrophysiology
Male WT (n = 12) and Fmr1-null mice (n = 9) aged 4-6 months were anesthetized by isoflurane inhalation (1.5% with 1 L/min oxygen) and implanted with a microdrive. Either a customized 8-tetrode Open Ephys Flexdrive (http://www.open-ephys.org (Voigts et al., 2013)) or a 4-tetrode customized Versadrive (Neuralynx, Bozeman, MT) was used. Tetrodes were aimed at the dorsal hippocampus (−2.0 mm posterior to bregma, ± 1.75 mm lateral from midline). The Flexdrive targeted both hippocampi. The tetrodes were constructed from 18-μm Nichrome or Platinum Iridium wire and the tips were plated with gold or platinum, respectively, to reduce impedances to 200-250 kOhms. The microdrive was secured to the skull using bone screws and dental cement; one screw served as the ground electrode. The mouse recovered for at least a week before electrophysiological procedures began.
Tetrodes were slowly advanced over two weeks until hippocampal single units could be identified. An electrode without single unit activity was selected as a reference. Extracellular action potential signals were amplified 4-12k times and 0.6-6 kHz band-pass filtered. LFP signals from the same electrodes were amplified 1000 times and 0.1-500 Hz band-pass filtered. Electrophysiology data were recorded using a 64-channel Axona recording system (Axona, St. Albans, UK).
Histology
After data collection concluded, the mice were euthanized by pentobarbital overdose. The mice were transcardially perfused with 4% formalin, brains removed, cryoprotected with 30% sucrose, sliced at 30 μm with a cryostat, and mounted on slides. Cresyl violet stain was used to determine the recording site for each tetrode, which had been targeted to the pyramidal cell layer of CA1.
Behavioral procedures
Constant conditions open-field and disk rotation
Four recording environments were used 1) a small box (28.5 w × 28.5 l × 17 h cm), 2) a large box with black walls (50 w × 50 l × 25 h cm), white acrylic floor, and a checkerboard card attached to one wall, 3) a 10-cm wide, ring with 40-cm outer diameter, and 4) a circular disk-shaped arena (40 cm diameter, 30 cm transparent wall) that could rotate at 0.75 rpm.
Electrophysiology recordings were performed while the mouse explored the small or large boxes, the ring or the disk that was positioned in the same location within the center of the room. A black curtain containing visual orienting cues was placed around the apparatus. The animal’s position was tracked at 30 frames/s using an overhead camera and software (Tracker, Bio-Signal Group Corp., Acton, MA) to detect a pair of infrared diodes attached to the animal’s microdrive. During arena rotation sessions, position was tracked in both the spatial frame of the room and the spatial frame of the arena. Tracking in the arena frame was performed relative to an infrared diode that was attached to the rotating arena but inaccessible to the animals.
Active place avoidance
For ex vivo physiology (Fig. 1 and Fig. S1), male WT and Fmr1-null mice aged 3-4 months were trained in a hippocampus-dependent two-frame active place avoidance task, consisting of a 40-cm diameter arena with a parallel rod floor that rotated at 1 rpm. The position of the animal was tracked as described above. Mice in the trained condition learned the “Room+Arena−“ task variant, in which avoiding a 60° sector was reinforced by a constant current foot shock (60 Hz, 500 ms, 0.2 mA) that was scrambled (5-poles) across pairs of the floor rods, triggered by entering the shock zone for more than 500 ms. Additional shocks occurred every 1.5 s until escape. Measures of place avoidance were computed by software (TrackAnalysis, Bio-Signal Group Corp., Acton, MA). Although TrackAnalysis returns a large number of performance measures, to assess place avoidance and to relate it to estimates of hippocampal function, we used the most commonly used and straightforward estimate of place avoidance, the number of errors (entrances to the shock zone) that were observed during a session. The behavioral protocol began with a 10-min session with shock off to habituate the mice to the rotating arena (pretrain). One hour later, three 10-min training sessions (60-min inter-trial interval) followed with the shock turned on. An additional conditioning session “24-h Retest” was performed the following day. Conditions were identical across all sessions except shock was off during pretraining.
For mice used for in vivo single unit and LFP recording, male WT and Fmr1-null mice aged 4-6 months were trained following similar procedures detailed above with the following differences. Mice received foot shock through a copper mesh arena floor, the sessions were 30-min, and inter-session intervals 1.5-h (Fig. S7), and shock was off during extinction.
Data analysis
Classification of cell types
Manual single unit isolation was performed using Wclust software (A.A. Fenton) to define clusters of action potential waveshape parameters in the high-dimensional waveshape parameter space (Fig. S2). The quality of this isolation was quantified using IsoIBG and IsoINN (Neymotin et al., 2011). These information theoretic measures are computed as the amount that a cluster’s identity reduces uncertainty of the 8 most effectively discriminating waveform parameter values. To compute IsoIBG the cluster is compared to all other action potentials, and in the case of IsoINN, the cluster is compared to the action potentials of the most similar (i.e. the nearest neighbour) cluster in the parameter space. Single units were considered sufficiently well isolated for study only if IsoIBG ≥; 4 bits and IsoINN ≥ 4 bits, which are criteria that were validated against the ground truth of simultaneous intra- and extracellular action potential recordings (Henze et al., 2000; Neymotin et al., 2011). Single units were classified as complex-spike or theta cells according to published criteria (Fenton et al., 2008; Ranck, 1973) (Fig. S3). Complex-spike cells appear to be pyramidal cells, whereas theta cells are likely local interneurons (Fox and Ranck, 1975). Pyramidal cells were judged to have long-duration waveforms (> 250 μs), low discharge rate (< 2 AP/s) and a tendency to fire in bursts (peak inter-spike interval < 10 ms). Interneurons had short-duration waveforms (< 250 μs), high discharge rate (> 2 AP/s), and were less likely to fire in bursts.
Characterization of place cells
Cell-specific spatial firing rate maps were created by calculating the total number of spikes observed in each 1.25 × 1.25 cm location, divided by the total time the mouse was in the location. Three qualities of spatial firing were computed from the firing rate map: the overall firing rate is the total spikes a cell discharged divided by the total recording time; spatial coherence describes the local smoothness of the firing rate distribution (Muller and Kubie, 1989); and spatial information content describes the reduction in uncertainty of the mouse’s position in the firing rate map given a particular firing rate (Skaggs et al., 1993). Single units were classified as place cells if the overall discharge rate was (0.1-2 AP/s), the spatial coherence (z score) was > 0.4, and the information content was > 0.4 bits/spike. The spatial similarity of two firing rate maps was computed as Fischer’s z-transformation of Pearson’s correlation for the firing rates in corresponding pixels of the two maps. The proportion of pixels in which the cell discharged was also computed. Note that while this measure is related to the size of a firing field, it does not directly measure firing fields and thus makes none of the arbitrary assumptions that are required to define a firing field, such as the firing rate threshold that distinguishes between in-field and out-of-field firing, nor does the measure rely on spatial smoothing or other such manipulations that make quantitative firing field definitions subjective, as discussed in (Maurer et al., 2006), and perhaps even inappropriate for understanding place coding (Meshulam et al., 2017).
Overdispersion
Overdispersion is the variance of a cell’s standardized firing rates for passes through the firing field (Fenton et al., 2010). The standardized firing rate (z) was computed for each 5-s interval as:
where obs is the number of observed action potentials and exp is the expected number on the assumption of Poisson firing. The expectation is the sum of the product of the time spent (ti) in a location during time interval i and the time-averaged rate at that location (ri) computed for all locations that were visited during the 5 seconds. Note that exp = 0 and z is undefined if the mouse does not visit the firing field during a 5-s interval. Only 5-s intervals when the mouse sampled a cell’s firing field well were studied. These were identified by exp ≥ average rate for the cell (Fenton et al., 2010). To study discharge covariations between pairs of cells, we selected 5-s epochs when the mouse crossed the firing fields of both cells as epochs when expected spatial firing (exp) of each cell was above the individual cell’s average rate.
Functional coupling of cell pairs
The functional coupling of spike trains from pairs of cells was estimated using Kendall’s correlation (Neymotin et al., 2017). The time series was generated by counting the number of spikes the cell fired during each time interval. We examined gamma (25 and 40 ms), theta (125 and 250 ms), as well as 1-s and 5-s (time to cross place field) intervals. Distributions of the population of pair-wise correlations within an ensemble of cells are called PCorr, which is the vector of pairwise correlations. PCorr captures higher-order network correlations, as weak pair-wise correlations imply strong network states (Schneidman et al., 2006). We used PCo, the Pearson correlation of a pair of PCorr vectors to describe the recurrence of these network states (Neymotin et al., 2017).
Frame-specific spatial firing analysis
During arena rotation, spatial discharge of a neuron can be represented in either the stationary spatial frame of the room or the rotating spatial frame of the arena. At each moment, discharge can signal location in one frame or the other. To decode which spatial frame is being represented by location-specific CA1 discharge, we computed the momentary positional information Ipos as described previously (Kelemen and Fenton, 2010). Ipos(t) estimates the location-specific firing of a cell during a brief time interval (Δt = 133 ms). It is defined as:
| (1) |
pi is the probability of the cell firing i spikes during the interval; pi|x is the probability of firing i spikes if the mouse is in location x. Although Ipos(t) can be positive or negative, the absolute value is large whenever the number of spikes observed at the location is distinct or “surprising” compared to the location-independent probability of observing the same number of spikes. The value |Ipos(t)| is given the shorthand, Ipos.
A cell’s spatial frame preference was estimated by first calculating Ipos separately for each spatial frame, then by computing the difference ΔIpos = Ipos(room) − Ipos(arena).
To estimate ensemble Ipos(t), we first computed the frame-specific sum of the Ipos(t) values at each moment. The ensemble difference ΔIpos between the room and arena frame was computed at each time interval to estimate the momentary frame preference in the ensemble discharge. The Pearson correlation between the time series of ensemble ΔIpos values and the time series of an individual cell’s ΔIpos values was used to estimate the coordination between an ensemble and a single cell’s frame-specific fluctuations in positional information. This coordination was estimated for each cell in the ensemble by computing the ensemble ΔIpos time series after leaving the cell out of the ensemble.
Spike-field coordination
Phase-frequency discharge probability plots were computed to characterize the likelihood that a cell’s discharge is phase-organized by frequency-specific oscillations in the LFP. For each analysis, the LFP and spike were recorded from the same tetrode, the tetrode wire with the fewest artifacts was selected for the LFP analysis. The LFP signal was convolved with a group of complex Morlet wavelets in the logarithmic range between 2 and 100 Hz. The instantaneous phase of the frequency band-specific LFP signals was obtained from the complex time series. The oscillation phase discharge probability was computed independently for each frequency band. The frequency-specific phase distribution of spiking was normalized by dividing the discharge distribution by the total number of action potentials in a given recording.
QUANTIFICATION AND STATISTICAL ANALYSES
Average ± s.e.m. values are reported throughout the manuscript. Statistical evaluation of data in figures is presented in the legend. Parametric comparisons of the two genotypes were performed by t test, which because of the Central Limit Theorem is valid and robust even when the normality assumption is violated so long as the sample sizes are large enough (Lumley et al., 2002). Sample sizes greater than 30 tend to be large enough and sizes of 50 are sufficient for skewed distributions (Ratcliffe, 1968). Statistical comparisons in the present work were based on sample distributions with n > 50, making them sufficiently large for the validity of the parametric t test (and ANOVA). Nonetheless, because non-parametric tests of inference are commonly used when sample normality is violated, we also report the Mann-Whitney-Wilcoxon test statistic U when both samples are not normally distributed according to the Shapiro-Wilk test. Comparisons of binomial proportions used the proportions z test. Multiple factor comparisons were performed by ANOVA, with repeated measures, followed by Tukey post-hoc tests as appropriate. Statistical comparisons between distributions of correlations (r) were performed on Fisher z-transformed correlation values . Significance was set at < 0.05.
DATA AND SOFTWARE AVAILABILITY
Custom code for spike train analyses found in figures 3, 4, 5 and S5 can be found on GitHub (see Key Resources Table). Further information and requests for data and code used for spike analyses should be directed to the Lead Contact André Fenton (afenton@nyu.edu).
KEY RESOURCES TABLE
| REAGENT or RESOURCE | SOURCE | IDENTIFIER |
|---|---|---|
| Antibodies | ||
| Bacterial and Virus Strains | ||
| Biological Samples | ||
| Chemicals, Peptides, and Recombinant Proteins | ||
| Critical Commercial Assays | ||
| Deposited Data | ||
| Raw data | This paper | CRCNS.org |
| Experimental Models: Cell Lines | ||
| Experimental Models: Organisms/Strains | ||
| Mouse: B6.129P2-Fmr1tm1Cgr/J | The Jackson Laboratory | JAX: 003025 |
| Oligonucleotides | ||
| Recombinant DNA | ||
| Software and Algorithms | ||
| Data acquisition software: DacqUSB | Axona, Ltd., St. Albans, U.K. | V1.2.2 |
| Data acquisition software: Tracker | Bio-Signal Group Corp., Acton, MA | V2.37 |
| Analysis software: TrackAnalysis | Bio-Signal Group Corp., Acton, MA | V2.52 |
| Analysis code: Phase Frequency Spike Probability Plots As in Figure 3 and S5 | FentonLab | https://github.com/FentonLab/SpikeField.git |
| Analysis code: Compute Kendall’s tau amongst pairs of spike trains in a BPF file as in Figure 4 | FentonLab | https://github.com/FentonLab/CorrelateBPFSpikeTrainEpisodes.git |
| Analysis code: Compute the Ipos (momentary positional information) time series for the spike trains in a BPF file as in Figure 5 | FentonLab | https://github.com/FentonLab/PositionalInfo.git |
| Other | ||
Supplementary Material
Acknowledgments
Supported by Simons Foundation grant SFARI 294388 and NIH grant R01MH099128 to AAF and R21NS091830 to JMA, NIMH studentship MH96331-5 to ZNT, and a Canadian Institutes of Health Research (CIHR) fellowship to FTS
Footnotes
Publisher's Disclaimer: This is a PDF file of an unedited manuscript that has been accepted for publication. As a service to our customers we are providing this early version of the manuscript. The manuscript will undergo copyediting, typesetting, and review of the resulting proof before it is published in its final citable form. Please note that during the production process errors may be discovered which could affect the content, and all legal disclaimers that apply to the journal pertain.
Supplemental Information. Supplemental Information includes six figures and two tables, and can be found with this article online.
Author Contributions
FTS and ZNT collected and analyzed place cell data; ZNT, DD, AAF analyzed spike train data; JMA, BMC, AAF collected and analysed ex vivo data; AAF supervised research and wrote the manuscript with contributions from all authors.
Declaration of Interests
The authors declare no competing interests.
References
- Anastassiou CA, Montgomery SM, Barahona M, Buzsaki G, Koch C. The effect of spatially inhomogeneous extracellular electric fields on neurons. J Neurosci. 2010;30:1925–1936. doi: 10.1523/JNEUROSCI.3635-09.2010. [DOI] [PMC free article] [PubMed] [Google Scholar]
- Bakker CE, Verheij C, Willemsen R, Vanderhelm R, Oerlemans F, Vermey M, Bygrave A, Hoogeveen AT, Oostra BA, Reyniers E, et al. Fmr1 knockout mice: a model to study fragile X mental retardation. The Dutch-Belgian Fragile X Consortium. Cell. 1994;78:23–33. [PubMed] [Google Scholar]
- Bassell GJ, Warren ST. Fragile X syndrome: loss of local mRNA regulation alters synaptic development and function. Neuron. 2008;60:201–214. doi: 10.1016/j.neuron.2008.10.004. [DOI] [PMC free article] [PubMed] [Google Scholar]
- Bear MF, Huber KM, Warren ST. The mGluR theory of fragile X mental retardation. Trends Neurosci. 2004;27:370–377. doi: 10.1016/j.tins.2004.04.009. [DOI] [PubMed] [Google Scholar]
- Bhakar AL, Dolen G, Bear MF. The pathophysiology of fragile X (and what it teaches us about synapses) Annu Rev Neurosci. 2012;35:417–443. doi: 10.1146/annurev-neuro-060909-153138. [DOI] [PMC free article] [PubMed] [Google Scholar]
- Bhattacharya A, Kaphzan H, Alvarez-Dieppa AC, Murphy JP, Pierre P, Klann E. Genetic removal of p70 S6 kinase 1 corrects molecular, synaptic, and behavioral phenotypes in fragile X syndrome mice. Neuron. 2012;76:325–337. doi: 10.1016/j.neuron.2012.07.022. [DOI] [PMC free article] [PubMed] [Google Scholar]
- Braun K, Segal M. FMRP involvement in formation of synapses among cultured hippocampal neurons. Cereb Cortex. 2000;10:1045–1052. doi: 10.1093/cercor/10.10.1045. [DOI] [PubMed] [Google Scholar]
- Brennan FX, Albeck DS, Paylor R. Fmr1 knockout mice are impaired in a leverpress escape/avoidance task. Genes Brain Behav. 2006;5:467–471. doi: 10.1111/j.1601-183X.2005.00183.x. [DOI] [PubMed] [Google Scholar]
- Brown V, Jin P, Ceman S, Darnell JC, O’Donnell WT, Tenenbaum SA, Jin X, Feng Y, Wilkinson KD, Keene JD, et al. Microarray identification of FMRP-associated brain mRNAs and altered mRNA translational profiles in fragile X syndrome. Cell. 2001;107:477–487. doi: 10.1016/s0092-8674(01)00568-2. [DOI] [PubMed] [Google Scholar]
- Buzsaki G. Neural syntax: cell assemblies, synapsembles, and readers. Neuron. 2010;68:362–385. doi: 10.1016/j.neuron.2010.09.023. [DOI] [PMC free article] [PubMed] [Google Scholar]
- Chen T, Lu JS, Song Q, Liu MG, Koga K, Descalzi G, Li YQ, Zhuo M. Pharmacological rescue of cortical synaptic and network potentiation in a mouse model for fragile X syndrome. Neuropsychopharmacology. 2014;39:1955–1967. doi: 10.1038/npp.2014.44. [DOI] [PMC free article] [PubMed] [Google Scholar]
- Chen Z, Resnik E, McFarland JM, Sakmann B, Mehta MR. Speed controls the amplitude and timing of the hippocampal gamma rhythm. PLoS One. 2011;6:e21408. doi: 10.1371/journal.pone.0021408. [DOI] [PMC free article] [PubMed] [Google Scholar]
- Cho YH, Giese KP, Tanila H, Silva AJ, Eichenbaum H. Abnormal hippocampal spatial representations in alphaCaMKIIT286A and CREBalphaDelta-mice. Science. 1998;279:867–869. doi: 10.1126/science.279.5352.867. [DOI] [PubMed] [Google Scholar]
- Cimadevilla JM, Wesierska M, Fenton AA, Bures J. Inactivating one hippocampus impairs avoidance of a stable room-defined place during dissociation of arena cues from room cues by rotation of the arena. Proc Natl Acad Sci U S A. 2001;98:3531–3536. doi: 10.1073/pnas.051628398. [DOI] [PMC free article] [PubMed] [Google Scholar]
- Colak D, Zaninovic N, Cohen MS, Rosenwaks Z, Yang WY, Gerhardt J, Disney MD, Jaffrey SR. Promoter-Bound Trinucleotide Repeat mRNA Drives Epigenetic Silencing in Fragile X Syndrome. Science. 2014;343:1002–1005. doi: 10.1126/science.1245831. [DOI] [PMC free article] [PubMed] [Google Scholar]
- Comery TA, Harris JB, Willems PJ, Oostra BA, Irwin SA, Weiler IJ, Greenough WT. Abnormal dendritic spines in fragile X knockout mice: maturation and pruning deficits. Proc Natl Acad Sci U S A. 1997;94:5401–5404. doi: 10.1073/pnas.94.10.5401. [DOI] [PMC free article] [PubMed] [Google Scholar]
- D’Hooge R, Nagels G, Franck F, Bakker CE, Reyniers E, Storm K, Kooy RF, Oostra BA, Willems PJ, De Deyn PP. Mildly impaired water maze performance in male Fmr1 knockout mice. Neuroscience. 1997;76:367–376. doi: 10.1016/s0306-4522(96)00224-2. [DOI] [PubMed] [Google Scholar]
- Darnell JC, Van Driesche SJ, Zhang C, Hung KY, Mele A, Fraser CE, Stone EF, Chen C, Fak JJ, Chi SW, et al. FMRP stalls ribosomal translocation on mRNAs linked to synaptic function and autism. Cell. 2011;146:247–261. doi: 10.1016/j.cell.2011.06.013. [DOI] [PMC free article] [PubMed] [Google Scholar]
- Deng PY, Sojka D, Klyachko VA. Abnormal presynaptic short-term plasticity and information processing in a mouse model of fragile X syndrome. J Neurosci. 2011;31:10971–10982. doi: 10.1523/JNEUROSCI.2021-11.2011. [DOI] [PMC free article] [PubMed] [Google Scholar]
- Dolen G, Carpenter RL, Ocain TD, Bear MF. Mechanism-based approaches to treating fragile X. Pharmacol Ther. 2010;127:78–93. doi: 10.1016/j.pharmthera.2010.02.008. [DOI] [PubMed] [Google Scholar]
- Dolen G, Osterweil E, Rao BS, Smith GB, Auerbach BD, Chattarji S, Bear MF. Correction of fragile X syndrome in mice. Neuron. 2007;56:955–962. doi: 10.1016/j.neuron.2007.12.001. [DOI] [PMC free article] [PubMed] [Google Scholar]
- Dragoi G, Tonegawa S. Development of schemas revealed by prior experience and NMDA receptor knock-out. Elife. 2013;2:e01326. doi: 10.7554/eLife.01326. [DOI] [PMC free article] [PubMed] [Google Scholar]
- Fenton AA. Coordinating with the “Inner GPS”. Hippocampus. 2015a;25:763–769. doi: 10.1002/hipo.22451. [DOI] [PubMed] [Google Scholar]
- Fenton AA. Excitation-inhibition discoordination in rodent models of mental disorders. Biol Psychiatry. 2015b;77:1079–1088. doi: 10.1016/j.biopsych.2015.03.013. [DOI] [PMC free article] [PubMed] [Google Scholar]
- Fenton AA, Kao HY, Neymotin SA, Olypher AV, Vayntrub Y, Lytton WW, Nandor L. Unmasking the CA1 ensemble place code by exposures to small and large environments: more place cells and multiple, irregularly-arranged, and expanded place fields in the larger space. J Neurosci. 2008;28:11250–11262. doi: 10.1523/JNEUROSCI.2862-08.2008. [DOI] [PMC free article] [PubMed] [Google Scholar]
- Fenton AA, Lytton WW, Barry JM, Lenck-Santini PP, Zinyuk LE, Kubik S, Bures J, Poucet B, Muller RU, Olypher AV. Attention-like modulation of hippocampus place cell discharge. J Neurosci. 2010;30:4613–4625. doi: 10.1523/JNEUROSCI.5576-09.2010. [DOI] [PMC free article] [PubMed] [Google Scholar]
- Fenton AA, Muller RU. Place cell discharge is extremely variable during individual passes of the rat through the firing field. Proc Natl Acad Sci U S A. 1998;95:3182–3187. doi: 10.1073/pnas.95.6.3182. [DOI] [PMC free article] [PubMed] [Google Scholar]
- Fox SE, Ranck JB., Jr Localization and anatomical identification of theta and complex spike cells in dorsal hippocampal formation of rats. Exp Neurol. 1975;49:299–313. doi: 10.1016/0014-4886(75)90213-7. [DOI] [PubMed] [Google Scholar]
- Fox SE, Ranck JB., Jr Electrophysiological characteristics of hippocampal complex-spike cells and theta cells. Exp Brain Res. 1981;41:399–410. doi: 10.1007/BF00238898. [DOI] [PubMed] [Google Scholar]
- Franklin AV, Rusche JR, McMahon LL. Increased long-term potentiation at medial-perforant path-dentate granule cell synapses induced by selective inhibition of histone deacetylase 3 requires Fragile X mental retardation protein. Neurobiol Learn Mem. 2014;114:193–197. doi: 10.1016/j.nlm.2014.06.008. [DOI] [PMC free article] [PubMed] [Google Scholar]
- Fusi S, Asaad WF, Miller EK, Wang XJ. A neural circuit model of flexible sensorimotor mapping: learning and forgetting on multiple timescales. Neuron. 2007;54:319–333. doi: 10.1016/j.neuron.2007.03.017. [DOI] [PMC free article] [PubMed] [Google Scholar]
- Gibson JR, Bartley AF, Hays SA, Huber KM. Imbalance of neocortical excitation and inhibition and altered UP states reflect network hyperexcitability in the mouse model of fragile X syndrome. J Neurophysiol. 2008;100:2615–2626. doi: 10.1152/jn.90752.2008. [DOI] [PMC free article] [PubMed] [Google Scholar]
- Godfraind JM, Reyniers E, De Boulle K, D’Hooge R, De Deyn PP, Bakker CE, Oostra BA, Kooy RF, Willems PJ. Long-term potentiation in the hippocampus of fragile X knockout mice. Am J Med Genet. 1996;64:246–251. doi: 10.1002/(SICI)1096-8628(19960809)64:2<246::AID-AJMG2>3.0.CO;2-S. [DOI] [PubMed] [Google Scholar]
- Gross C, Yao X, Pong DL, Jeromin A, Bassell GJ. Fragile X mental retardation protein regulates protein expression and mRNA translation of the potassium channel Kv4.2. J Neurosci. 2011;31:5693–5698. doi: 10.1523/JNEUROSCI.6661-10.2011. [DOI] [PMC free article] [PubMed] [Google Scholar]
- Harris KD, Csicsvari J, Hirase H, Dragoi G, Buzsaki G. Organization of cell assemblies in the hippocampus. Nature. 2003;424:552–556. doi: 10.1038/nature01834. [DOI] [PubMed] [Google Scholar]
- Henze DA, Borhegyi Z, Csicsvari J, Mamiya A, Harris KD, Buzsaki G. Intracellular features predicted by extracellular recordings in the hippocampus in vivo. J Neurophysiol. 2000;84:390–400. doi: 10.1152/jn.2000.84.1.390. [DOI] [PubMed] [Google Scholar]
- Hok V, Chah E, Reilly RB, O’Mara SM. Hippocampal dynamics predict interindividual cognitive differences in rats. J Neurosci. 2012;32:3540–3551. doi: 10.1523/JNEUROSCI.6449-11.2012. [DOI] [PMC free article] [PubMed] [Google Scholar]
- Hooper SR, Hatton D, Sideris J, Sullivan K, Hammer J, Schaaf J, Mirrett P, Ornstein PA, Bailey DP., Jr Executive functions in young males with fragile X syndrome in comparison to mental age-matched controls: baseline findings from a longitudinal study. Neuropsychology. 2008;22:36–47. doi: 10.1037/0894-4105.22.1.36. [DOI] [PubMed] [Google Scholar]
- Hsieh C, Tsokas P, Serrano P, Hernandez AI, Tian D, Cottrell JE, Shouval HZ, Fenton AA, Sacktor TC. Persistent increased PKMzeta in long-term and remote spatial memory. Neurobiol Learn Mem. 2017;138:135–144. doi: 10.1016/j.nlm.2016.07.008. [DOI] [PMC free article] [PubMed] [Google Scholar]
- Hu H, Qin Y, Bochorishvili G, Zhu Y, van Aelst L, Zhu JJ. Ras signaling mechanisms underlying impaired GluR1-dependent plasticity associated with fragile X syndrome. J Neurosci. 2008;28:7847–7862. doi: 10.1523/JNEUROSCI.1496-08.2008. [DOI] [PMC free article] [PubMed] [Google Scholar]
- Huber KM, Gallagher SM, Warren ST, Bear MF. Altered synaptic plasticity in a mouse model of fragile X mental retardation. Proc Natl Acad Sci U S A. 2002;99:7746–7750. doi: 10.1073/pnas.122205699. [DOI] [PMC free article] [PubMed] [Google Scholar]
- Hunsaker MR, Kim K, Willemsen R, Berman RF. CGG trinucleotide repeat length modulates neural plasticity and spatiotemporal processing in a mouse model of the fragile X premutation. Hippocampus. 2012;22:2260–2275. doi: 10.1002/hipo.22043. [DOI] [PMC free article] [PubMed] [Google Scholar]
- Jackson J, Redish AD. Network dynamics of hippocampal cell-assemblies resemble multiple spatial maps within single tasks. Hippocampus. 2007;17:1209–1229. doi: 10.1002/hipo.20359. [DOI] [PubMed] [Google Scholar]
- Johnson A, Fenton AA, Kentros C, Redish AD. Looking for cognition in the structure within the noise. Trends Cogn Sci. 2009;2:55–64. doi: 10.1016/j.tics.2008.11.005. [DOI] [PMC free article] [PubMed] [Google Scholar]
- Kelemen E, Fenton AA. Dynamic grouping of hippocampal neural activity during cognitive control of two spatial frames. PLoS Biol. 2010;8:e1000403. doi: 10.1371/journal.pbio.1000403. [DOI] [PMC free article] [PubMed] [Google Scholar]
- Kelemen E, Fenton AA. Coordinating different representations in the Hippocampus. Neurobiol Learn Mem. 2016;129:50–59. doi: 10.1016/j.nlm.2015.12.011. [DOI] [PubMed] [Google Scholar]
- Kooy RF, D’Hooge R, Reyniers E, Bakker CE, Nagels G, De Boulle K, Storm K, Clincke G, De Deyn PP, Oostra BA, Willems PJ. Transgenic mouse model for the fragile X syndrome. Am J Med Genet. 1996;64:241–245. doi: 10.1002/(SICI)1096-8628(19960809)64:2<241::AID-AJMG1>3.0.CO;2-X. [DOI] [PubMed] [Google Scholar]
- Krueger DD, Osterweil EK, Chen SP, Tye LD, Bear MF. Cognitive dysfunction and prefrontal synaptic abnormalities in a mouse model of fragile X syndrome. Proc Natl Acad Sci U S A. 2011;108:2587–2592. doi: 10.1073/pnas.1013855108. [DOI] [PMC free article] [PubMed] [Google Scholar]
- Kubik S, Fenton AA. Behavioral evidence that segregation and representation are dissociable hippocampal functions. J Neurosci. 2005;25:9205–9212. doi: 10.1523/JNEUROSCI.1707-05.2005. [DOI] [PMC free article] [PubMed] [Google Scholar]
- Larson J, Jessen RE, Kim D, Fine AK, du Hoffmann J. Age-dependent and selective impairment of long-term potentiation in the anterior piriform cortex of mice lacking the fragile X mental retardation protein. J Neurosci. 2005;25:9460–9469. doi: 10.1523/JNEUROSCI.2638-05.2005. [DOI] [PMC free article] [PubMed] [Google Scholar]
- Laughlin RB, Pines D, Schmalian J, Stojkovic BP, Wolynes P. The middle way. Proc Natl Acad Sci U S A. 2000;97:32–37. doi: 10.1073/pnas.97.1.32. [DOI] [PMC free article] [PubMed] [Google Scholar]
- Lauterborn JC, Rex CS, Kramar E, Chen LY, Pandyarajan V, Lynch G, Gall CM. Brain-derived neurotrophic factor rescues synaptic plasticity in a mouse model of fragile X syndrome. J Neurosci. 2007;27:10685–10694. doi: 10.1523/JNEUROSCI.2624-07.2007. [DOI] [PMC free article] [PubMed] [Google Scholar]
- Lee H, Dvorak D, Fenton AA. Targeting Neural Synchrony Deficits is Sufficient to Improve Cognition in a Schizophrenia-Related Neurodevelopmental Model. Front Psychiatry. 2014;5:15. doi: 10.3389/fpsyt.2014.00015. [DOI] [PMC free article] [PubMed] [Google Scholar]
- Lumley T, Diehr P, Emerson S, Chen L. The importance of the normality assumption in large public health data sets. Annu Rev Public Health. 2002;23:151–169. doi: 10.1146/annurev.publhealth.23.100901.140546. [DOI] [PubMed] [Google Scholar]
- Maurer AP, Cowen SL, Burke SN, Barnes CA, McNaughton BL. Organization of hippocampal cell assemblies based on theta phase precession. Hippocampus. 2006;16:785–794. doi: 10.1002/hipo.20202. [DOI] [PubMed] [Google Scholar]
- McFarland WL, Teitelbaum H, Hedges EK. Relationship between hippocampal theta activity and running speed in the rat. Journal of comparative and physiological psychology. 1975;88:324–328. doi: 10.1037/h0076177. [DOI] [PubMed] [Google Scholar]
- McHugh TJ, Blum KI, Tsien JZ, Tonegawa S, Wilson MA. Impaired hippocampal representation of space in CA1-specific NMDAR1 knockout mice. Cell. 1996;87:1339–1349. doi: 10.1016/s0092-8674(00)81828-0. [DOI] [PubMed] [Google Scholar]
- McHugh TJ, Jones MW, Quinn JJ, Balthasar N, Coppari R, Elmquist JK, Lowell BB, Fanselow MS, Wilson MA, Tonegawa S. Dentate gyrus NMDA receptors mediate rapid pattern separation in the hippocampal network. Science. 2007;317:94–99. doi: 10.1126/science.1140263. [DOI] [PubMed] [Google Scholar]
- Meshulam L, Gauthier JL, Brody CD, Tank DW, Bialek W. Collective Behavior of Place and Non-place Neurons in the Hippocampal Network. Neuron. 2017 doi: 10.1016/j.neuron.2017.10.027. [DOI] [PMC free article] [PubMed] [Google Scholar]
- Moser MB, Rowland DC, Moser EI. Place cells, grid cells, and memory. Cold Spring Harb Perspect Biol. 2015;7:a021808. doi: 10.1101/cshperspect.a021808. [DOI] [PMC free article] [PubMed] [Google Scholar]
- Muller RU, Kubie JL. The firing of hippocampal place cells predicts the future position of freely moving rats. J Neurosci. 1989;9:4101–4110. doi: 10.1523/JNEUROSCI.09-12-04101.1989. [DOI] [PMC free article] [PubMed] [Google Scholar]
- Nakazawa K, Quirk MC, Chitwood RA, Watanabe M, Yeckel MF, Sun LD, Kato A, Carr CA, Johnston D, Wilson MA, Tonegawa S. Requirement for hippocampal CA3 NMDA receptors in associative memory recall. Science. 2002;297:211–218. doi: 10.1126/science.1071795. [DOI] [PMC free article] [PubMed] [Google Scholar]
- Nakazawa K, Sun LD, Quirk MC, Rondi-Reig L, Wilson MA, Tonegawa S. Hippocampal CA3 NMDA receptors are crucial for memory acquisition of one-time experience. Neuron. 2003;38:305–315. doi: 10.1016/s0896-6273(03)00165-x. [DOI] [PubMed] [Google Scholar]
- Neymotin SA, Lytton WW, Olypher AV, Fenton AA. Measuring the Quality of Neuronal Identification in Ensemble Recordings. J Neurosci. 2011;31:16398–16409. doi: 10.1523/JNEUROSCI.4053-11.2011. [DOI] [PMC free article] [PubMed] [Google Scholar]
- Neymotin SA, Talbot ZN, Jung JQ, Fenton AA, Lytton WW. Tracking recurrence of correlation structure in neuronal recordings. J Neurosci Methods. 2017;275:1–9. doi: 10.1016/j.jneumeth.2016.10.009. [DOI] [PMC free article] [PubMed] [Google Scholar]
- O’Keefe J, Nadel L. The Hippocampus as a cognitive map. Oxford: Clarendon Press; 1978. [Google Scholar]
- Okun M, Steinmetz NA, Cossell L, Iacaruso MF, Ko H, Bartho P, Moore T, Hofer SB, Mrsic-Flogel TD, Carandini M, Harris KD. Diverse coupling of neurons to populations in sensory cortex. Nature. 2015;521:511–515. doi: 10.1038/nature14273. [DOI] [PMC free article] [PubMed] [Google Scholar]
- Park E, Dvorak D, Fenton AA. Ensemble Place Codes in Hippocampus: CA1, CA3, and Dentate Gyrus Place Cells Have Multiple Place Fields in Large Environments. PLoS One. 2011;6:e22349. doi: 10.1371/journal.pone.0022349. [DOI] [PMC free article] [PubMed] [Google Scholar]
- Park EH, Burghardt NS, Dvorak D, Hen R, Fenton AA. Experience-Dependent Regulation of Dentate Gyrus Excitability by Adult-Born Granule Cells. J Neurosci. 2015;35:11656–11666. doi: 10.1523/JNEUROSCI.0885-15.2015. [DOI] [PMC free article] [PubMed] [Google Scholar]
- Pastalkova E, Serrano P, Pinkhasova D, Wallace E, Fenton AA, Sacktor TC. Storage of spatial information by the maintenance mechanism of LTP. Science. 2006;313:1141–1144. doi: 10.1126/science.1128657. [DOI] [PubMed] [Google Scholar]
- Patel AB, Hays SA, Bureau I, Huber KM, Gibson JR. A target cell-specific role for presynaptic Fmr1 in regulating glutamate release onto neocortical fast-spiking inhibitory neurons. J Neurosci. 2013;33:2593–2604. doi: 10.1523/JNEUROSCI.2447-12.2013. [DOI] [PMC free article] [PubMed] [Google Scholar]
- Pavlowsky A, Wallace E, Fenton AA, Alarcon JM. Persistent modifications of hippocampal synaptic function during remote spatial memory. Neurobiol Learn Mem. 2017;138:182–197. doi: 10.1016/j.nlm.2016.08.015. [DOI] [PMC free article] [PubMed] [Google Scholar]
- Phillips WA, Silverstein SM. Convergence of biological and psychological perspectives on cognitive coordination in schizophrenia. Behav Brain Sci. 2003;26:65–82. doi: 10.1017/s0140525x03000025. discussion 82-137. [DOI] [PubMed] [Google Scholar]
- Phillips WA, Singer W. In search of common foundations for cortical computation. Behav Brain Sci. 1997;20:657–683. doi: 10.1017/s0140525x9700160x. discussion 683-722. [DOI] [PubMed] [Google Scholar]
- Pieretti M, Zhang FP, Fu YH, Warren ST, Oostra BA, Caskey CT, Nelson DL. Absence of expression of the FMR-1 gene in fragile X syndrome. Cell. 1991;66:817–822. doi: 10.1016/0092-8674(91)90125-i. [DOI] [PubMed] [Google Scholar]
- Radwan B, Dvorak D, Fenton A. Impaired cognitive discrimination and discoordination of coupled theta-gamma oscillations in Fmr1 knockout mice. Neurobiol Dis. 2016:125–138. doi: 10.1016/j.nbd.2016.01.003. [DOI] [PMC free article] [PubMed] [Google Scholar]
- Ranck JB., Jr Studies on single neurons in dorsal hippocampal formation and septum in unrestrained rats. I. Behavioral correlates and firing repertoires. Exp Neurol. 1973;41:461–531. doi: 10.1016/0014-4886(73)90290-2. [DOI] [PubMed] [Google Scholar]
- Ratcliffe JF. The Effect on the t Distribution of Non-Normality in the Sampled Population. Journal of the Royal Statistical Society Series C (Applied Statistics) 1968;17:42–48. [Google Scholar]
- Rotenberg A, Abel T, Hawkins RD, Kandel ER, Muller RU. Parallel instabilities of long-term potentiation, place cells, and learning caused by decreased protein kinase A activity. J Neurosci. 2000;20:8096–8102. doi: 10.1523/JNEUROSCI.20-21-08096.2000. [DOI] [PMC free article] [PubMed] [Google Scholar]
- Rotenberg A, Mayford M, Hawkins RD, Kandel ER, Muller RU. Mice expressing activated CaMKII lack low frequency LTP and do not form stable place cells in the CA1 region of the Hippocampus. Cell. 1996;87:1351–1361. doi: 10.1016/s0092-8674(00)81829-2. [DOI] [PubMed] [Google Scholar]
- Schneidman E, Berry MJ, 2nd, Segev R, Bialek W. Weak pairwise correlations imply strongly correlated network states in a neural population. Nature. 2006;440:1007–1012. doi: 10.1038/nature04701. [DOI] [PMC free article] [PubMed] [Google Scholar]
- Skaggs WE, McNaughton BL, Gothard KM, Markus EJ. An information theoretic approach to deciphering the hippocampal code. In: Hanson SJ, Cowan JD, Giles CL, editors. Advances in neural information processing. San Mateo, CA: Morgan Kaufmann Publishers; 1993. pp. 1030–1037. [Google Scholar]
- Sorensen EM, Bertelsen F, Weikop P, Skovborg MM, Banke T, Drasbek KR, Scheel-Kruger J. Hyperactivity and lack of social discrimination in the adolescent Fmr1 knockout mouse. Behav Pharmacol. 2015;26:733–740. doi: 10.1097/FBP.0000000000000152. [DOI] [PubMed] [Google Scholar]
- Suh J, Foster DJ, Davoudi H, Wilson MA, Tonegawa S. Impaired hippocampal ripple-associated replay in a mouse model of schizophrenia. Neuron. 2013;80:484–493. doi: 10.1016/j.neuron.2013.09.014. [DOI] [PMC free article] [PubMed] [Google Scholar]
- Tsokas P, Hsieh C, Yao Y, Lesburgueres E, Wallace EJ, Tcherepanov A, Jothianandan D, Hartley BR, Pan L, Rivard B, et al. Compensation for PKMzeta in long-term potentiation and spatial long-term memory in mutant mice. Elife. 2016;5 doi: 10.7554/eLife.14846. [DOI] [PMC free article] [PubMed] [Google Scholar]
- Uhlhaas PJ, Singer W. What do disturbances in neural synchrony tell us about autism? Biol Psychiatry. 2007;62:190–191. doi: 10.1016/j.biopsych.2007.05.023. [DOI] [PubMed] [Google Scholar]
- Voigts J, Siegle JH, Pritchett DL, Moore CI. The flexDrive: an ultra-light implant for optical control and highly parallel chronic recording of neuronal ensembles in freely moving mice. Front Syst Neurosci. 2013;7:8. doi: 10.3389/fnsys.2013.00008. [DOI] [PMC free article] [PubMed] [Google Scholar]
- Waung MW, Huber KM. Protein translation in synaptic plasticity: mGluR-LTD, Fragile X. Curr Opin Neurobiol. 2009;19:319–326. doi: 10.1016/j.conb.2009.03.011. [DOI] [PMC free article] [PubMed] [Google Scholar]
- Xie K, Fox GE, Liu J, Lyu C, Lee JC, Kuang H, Jacobs S, Li M, Liu T, Song S, Tsien JZ. Brain Computation Is Organized via Power-of-Two-Based Permutation Logic. Front Syst Neurosci. 2016;10:95. doi: 10.3389/fnsys.2016.00095. [DOI] [PMC free article] [PubMed] [Google Scholar]
- Yun SH, Trommer BL. Fragile X mice: reduced long-term potentiation and N-Methyl-D-Aspartate receptor-mediated neurotransmission in dentate gyrus. J Neurosci Res. 2011;89:176–182. doi: 10.1002/jnr.22546. [DOI] [PubMed] [Google Scholar]
- Zhang L, Alger BE. Enhanced endocannabinoid signaling elevates neuronal excitability in fragile X syndrome. J Neurosci. 2010;30:5724–5729. doi: 10.1523/JNEUROSCI.0795-10.2010. [DOI] [PMC free article] [PubMed] [Google Scholar]
- Zhao MG, Toyoda H, Ko SW, Ding HK, Wu LJ, Zhuo M. Deficits in trace fear memory and long-term potentiation in a mouse model for fragile X syndrome. J Neurosci. 2005;25:7385–7392. doi: 10.1523/JNEUROSCI.1520-05.2005. [DOI] [PMC free article] [PubMed] [Google Scholar]
- Zhong J, Chuang SC, Bianchi R, Zhao W, Paul G, Thakkar P, Liu D, Fenton AA, Wong RK, Tiedge H. Regulatory BC1 RNA and the fragile X mental retardation protein: convergent functionality in brain. PLoS One. 2010;5:e15509. doi: 10.1371/journal.pone.0015509. [DOI] [PMC free article] [PubMed] [Google Scholar]
- Zinyuk L, Kubik S, Kaminsky Y, Fenton AA, Bures J. Understanding hippocampal activity by using purposeful behavior: place navigation induces place cell discharge in both task-relevant and task-irrelevant spatial reference frames. Proc Natl Acad Sci U S A. 2000;97:3771–3776. doi: 10.1073/pnas.050576397. [DOI] [PMC free article] [PubMed] [Google Scholar]
- Zoghbi HY, Bear MF. Synaptic dysfunction in neurodevelopmental disorders associated with autism and intellectual disabilities. Cold Spring Harb Perspect Biol. 2012;4 doi: 10.1101/cshperspect.a009886. [DOI] [PMC free article] [PubMed] [Google Scholar]
Associated Data
This section collects any data citations, data availability statements, or supplementary materials included in this article.