Abstract
Objective:
The incidence of esophageal adenocarcinoma, one of the most lethal gastroenterological diseases, has been increasing since the 1960s. Prevention of esophageal adenocarcinoma is important because no early detection screening programs have been shown to reduce mortality. Obesity, gastroesophageal reflux disease, and tobacco smoking are risk factors for esophageal adenocarcinoma. Due to the high prevalence in Ohio of obesity (32.6%) and cigarette smoking (21.0%), this study sought to identify trends and patterns of these risk factors and esophageal adenocarcinoma in Ohio as compared with the United States.
Methods:
Data from the Ohio Cancer Incidence Surveillance System, Surveillance Epidemiology and End Results Program (SEER), and Behavioral Risk Factor Surveillance System were used. Incidence rates overall, by demographics and by county, as well as trends in incidence of esophageal adenocarcinoma and the percent of esophageal adenocarcinoma among esophageal cancers were examined. Trends in obesity and cigarette smoking in Ohio, and the prevalence of each by county, were reported.
Results:
There was an increasing trend in esophageal adenocarcinoma incidence in Ohio. Ohio’s average annual esophageal adenocarcinoma incidence rate was higher than the SEER rate overall and for each sex, race, and age group in 2009 to 2013. There was also an increasing prevalence of obesity in Ohio. Although the prevalence of cigarette smoking has been stable, it was high in Ohio compared with the United States.
Conclusions:
Health care providers and researchers should be aware of the esophageal adenocarcinoma incidence rates and risk factor patterns and tailor interventions for areas and populations at higher risk.
Keywords: Esophageal adenocarcinoma, SEER, risk factors, incidence, prevention, obesity, smoking
Introduction
Esophageal cancer is one of the deadliest cancers, with a 5-year relative survival probability of only 18% in the United States.1 The 2 primary histological types of esophageal cancer are esophageal squamous cell carcinoma (SCC), most often found in the middle or upper third of the esophagus, and esophageal adenocarcinoma (EAC), most often found in the lower third of the esophagus or in the junction of the esophagus and stomach.2 The incidence of EAC has been increasing since the 1960s in Western populations, including the United States,3–7 and EAC surpassed SCC to become the leading subtype of cancer of the esophagus in the United States in the 1990s.5,7,8 Many studies have shown that obesity (body mass index ⩾30), gastroesophageal reflux disease (GERD), and tobacco smoking are the predominant risk factors for EAC.5,7,9–11 These 3 risk factors combined account for more than 70% of all cases of EAC in the United States and other Western populations.12 Although alcohol is a strong risk factor for SCC of the esophagus, it is not a proven risk factor for EAC.5,7,13,14
Increasing EAC incidence and increasing or high prevalence of associated risk factors, along with poor survival for patients with advanced disease,15 makes EAC a considerable public health concern. Because no early detection screening programs for EAC in asymptomatic, average risk people have been shown to reduce mortality,16 risk factor reduction should be a priority. A descriptive analysis of Ohio EAC incidence rates and risk factors is essential for the identification of high-risk populations and geographic regions at high risk, to target public health programs. The purpose of this study was to evaluate patterns of obesity and current cigarette smoking, as well as incidence rates of EAC over time and by demographics (age, sex, and race) and geographic regions in Ohio, and to compare Ohio EAC incidence rates with those from the National Cancer Institute’s Surveillance Epidemiology and End Results Program (SEER).
Materials and Methods
Newly diagnosed, primary invasive esophageal cancer cases from the Ohio Department of Health Ohio Cancer Incidence Surveillance System (OCISS) database were used to calculate Ohio-specific cancer incidence rates and 95% confidence intervals. Comparison incidence rates and 95% confidence intervals were obtained from the SEER data. These 18 registries capture approximately 28% of the US population representing various US demographics.1 Esophageal cancers were grouped using site and morphology codes from the World Health Organization’s International Classification of Diseases for Oncology, Third Edition (ICD-O-3).17 SEER*Stat 8.2.1 was used to calculate age-adjusted EAC incidence rates and 95% confidence intervals for both Ohio and SEER.18 All incidence rates were expressed as the number of cases per 100 000 persons, age-adjusted to the 2000 US standard population.
Ohio obesity and current cigarette smoking prevalence estimates over time (1996-2014) were obtained directly from the 2015 Centers for Disease Control and Prevention’s (CDC) Behavioral Risk Factor Surveillance System (BRFSS).19 Obesity was derived from self-reported height and weight. The population denominators for the obesity and current cigarette smoking questions included all respondents except those with “missing,” “don’t know,” and “refused” responses. The BRFSS data prior to 2011 should not be compared with data from 2011 to 2014 due to changes in survey methodology.20 The BRFSS data prior to 2011 were weighted by age and sex using a poststratification method. Data from 2011 to 2014 were weighted by age, sex, race/ethnicity, geography, marital status, education, home ownership, and telephone source using an iterative proportional fitting (ranking) method.
The most recent county-level BRFSS prevalence estimates in Ohio for obesity (2012) and current cigarette smoking (2014) were obtained from the County Health Rankings and Roadmaps, A Robert Wood Johnson program.21 County-level prevalence was estimated using multilevel modeling techniques based on single-year 2014 BRFSS data and respondent demographics (age, sex, and race/ethnicity) as well as county-level poverty and county- and state-level contextual effects.22 Estimates for counties with no or limited data were generated using this approach and information from the entire BRFSS sample and the Census Vintage 2014 population estimates.23
Tertiles were used to create Ohio maps of EAC incidence rates, percent of esophageal cancers that were EAC, percent of Ohio adults who were obese, and percent of Ohio adults who were current cigarette smoking in adults. County incidence rates and percent of esophageal cancer cases that were EAC were suppressed if case counts were less than 5 to ensure stability of estimates. Maps were developed using Esri’s ArcMap 10.2.2.24
Results
Incidence
Table 1 shows the average annual, age-adjusted incidence rates and 95% confidence intervals of EAC in Ohio and SEER from 2009 to 2013. An average of 492 cases of EAC was reported each year in Ohio for an average annual incidence rate of 3.5 per 100 000 persons, which was significantly higher than the US incidence rate of 2.5 per 100 000. White men had the highest rate of EAC of all race/sex groups for both Ohio and SEER (7.1 and 5.7 per 100 000, respectively).
Table 1.
Average annual age-adjusted incidence rates per 100 000 and percent difference of EAC by sex, race, and age in Ohio and the United States, 2009 to 2013.
| Ohio |
United States |
Percent Difference |
|||||||
|---|---|---|---|---|---|---|---|---|---|
| Male | Female | Total | Male | Female | Total | Male, % | Female, % | Total, % | |
| Race | |||||||||
| White | 7.1 | 1.1 | 3.8 | 5.7 | 0.7 | 3.0 | 25 | 57 | 27 |
| Black | 1.7 | 0.4 | 1.0 | 1.3 | 0.3 | 0.7 | 31 | 33 | 43 |
| Age | |||||||||
| <60 | 2.1 | 0.3 | 1.2 | 1.3 | 0.2 | 0.7 | 62 | 50 | 71 |
| 60-69 | 24.1 | 3.1 | 13.1 | 18.2 | 1.9 | 9.6 | 32 | 63 | 36 |
| 70+ | 34.2 | 5.5 | 17.4 | 26.4 | 3.9 | 13.3 | 30 | 41 | 31 |
| Total | 6.6 | 1.0 | 3.5 | 4.9 | 0.6 | 2.5 | 35 | 67 | 40 |
Source: Ohio Cancer Incidence Surveillance System, Ohio Department of Health, 2016; Surveillance, Epidemiology, and End Results (SEER) Program, SEER Cancer Statistics Review 1975-2013, National Cancer Institute, 2016.
All rates were age-adjusted to the 2000 US standard population using 19 age groups.
The EAC incidence rates for men in Ohio (overall and by race) were also higher than SEER rates; however, the percent differences in EAC incidence rates between Ohio and SEER were lower than those for women. The overall Ohio EAC incidence rate for men was significantly higher in Ohio than SEER (6.6 and 4.9 per 100 000 men, respectively). For white men, the EAC incidence rate was significantly higher in Ohio compared with SEER (7.1 and 5.7 per 100 000, respectively). Among black men, the EAC incidence rate was 31% higher, although not significantly higher, in Ohio compared with the United States (1.7 and 1.3 per 100 000, respectively). The incidence rate of EAC was significantly higher in Ohio women compared with US women (1.0 and 0.6 per 100 000, respectively). For white women, the EAC incidence rate was significantly higher in Ohio compared with SEER (1.1 and 0.7 per 100 000, respectively) and the black women incidence rate was 33% higher, although not significantly higher, in Ohio compared with the United States (0.4 and 0.3 per 100 000, respectively).
The incidence rates of EAC increased as age increased overall and for both men and women. The incidence rates of EAC by age group (<60, 60-69, and 70+ years) were significantly higher overall and by sex in Ohio compared with SEER rates for every age group except women age <60 years. The percent difference in EAC incidence rates between Ohio and SEER ranged from 30% in men 70+ years (34.2 and 26.4 per 100 000 for Ohio and SEER, respectively) to 63% in women 60 to 69 years (3.1 and 1.9 per 100 000 for Ohio and SEER, respectively).
Trends in EAC incidence rates
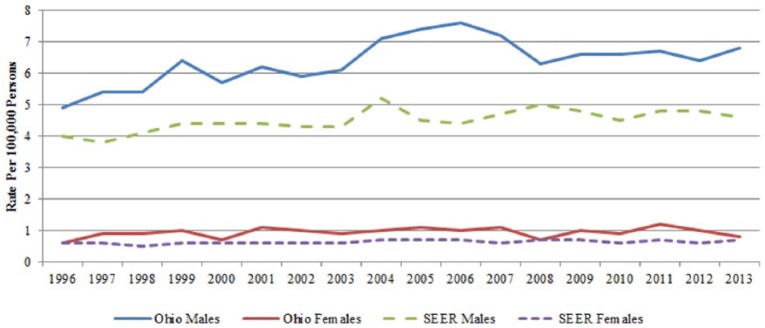
Figure 1 shows the trend (1996-2013) in the age-adjusted incidence rate of EAC for Ohio and SEER by sex. The EAC incidence rate for Ohio men was greater than SEER men each year during this 18-year period. Ohio and SEER women had similar rates from 1996 to 2013. For each of the 4 groups, there was an increase in the EAC incidence rate during this time period. However, the increase in the EAC incidence rate was greater in Ohio compared with SEER for both men (Ohio 38% vs United States 15%) and women (Ohio 33% vs United States 17%).
Figure 1.
Trend of age-adjusted incidence rates of EAC by sex in Ohio and SEER, 1996-2013. EAC indicates esophageal adenocarcinoma; SEER, Surveillance Epidemiology and End Results Program.
Source: Ohio Cancer Incidence Surveillance System, Ohio Department of Health, 2016; Surveillance, Epidemiology, and End Results (SEER) Program, SEER Cancer Statistics Review 1975-2013, National Cancer Institute, 2016. All rates were age-adjusted to the 2000 US standard population using 19 age groups.
Trends in percent of esophageal cancers that were EAC
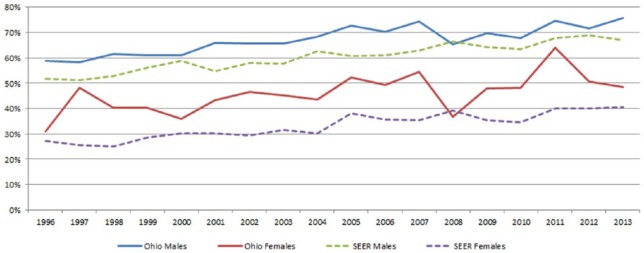
Figure 2 shows the trend (1996-2013) in percent of esophageal cancers that were EAC for Ohio and SEER by sex. There were similar increases in the percent of EAC over this 18-year period for each of the 4 groups, with Ohio men and women having higher percents of EAC than SEER men and women. The difference in the percent EAC between Ohio and SEER was greater for women than men during this time period, with the exception of 2008. In both Ohio and SEER, this increase was accompanied by a corresponding decrease in SCC (not shown in tables/figures).
Figure 2.
Trends in the Percent of Esophageal Cancers that are EAC in Ohio and the U.S., 1996-2013. EAC indicates esophageal adenocarcinoma.
Source: Ohio Cancer Incidence Surveillance System, Ohio Department of Health, 2016; Surveillance, Epidemiology, and End Results (SEER) Program, SEER Cancer Statistics Review 1975-2013, National Cancer Institute, 2016.
Risk factor: obesity in Ohio
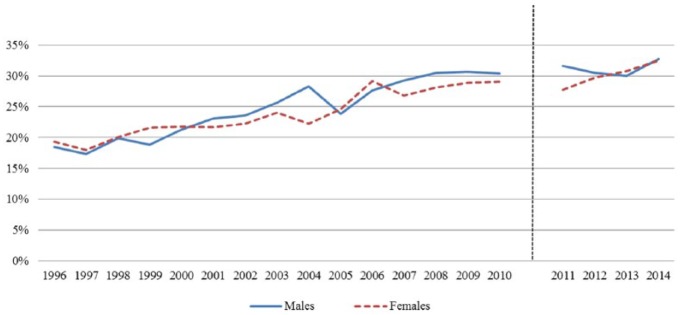
In 2014, Ohio ranked as the eighth highest state in adult obesity19 with 32.6% of adults being obese. This was 10.6% higher than the percent of adults who were obese in the United States (29.5%). Figure 3 shows the percent of adult men and women who were obese from 1996 to 2014. During this period, the obesity prevalence in Ohio adults increased from 20% in 1996 to 30% in 2010. In Ohio, adult male obesity increased 64%, from 18.5% to 30.4%, and adult female obesity increased from 19.3% to 29.1% from 1996 to 2010, respectively. This trend continued from 2011 to 2014.
Figure 3.
Trends of obesity (BMI ⩾ 30) in adults by sex in Ohio, 1996-2014. BMI indicates body mass index.
Source: Centers for Disease Control and Prevention, National Center for Chronic Disease Prevention and Health Promotion, Division of Population Health. BRFSS Prevalence & Trends Data (online). 2015. Note: Data from 2011-present were weighted by age, sex, race/ethnicity, geography, marital status, education, home ownership, and telephone source using an iterative proportional fitting (raking) method. Data prior to 2011 were weighted by age and sex using a poststratification method. Thus, BRFSS data for 2011-present should not be compared with data prior to 2011.
Risk factor: cigarette smoking in Ohio
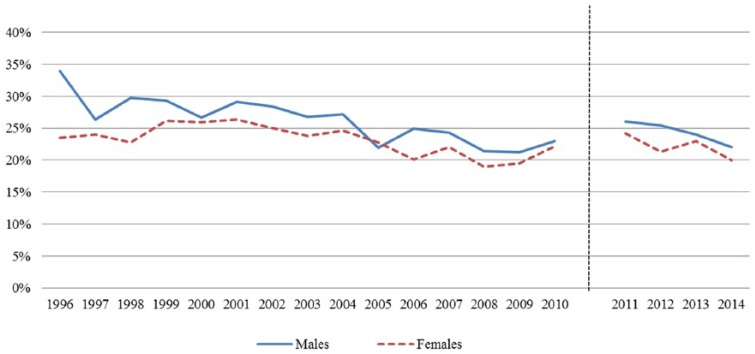
According to the BRFSS, the 2014 estimate of Ohio adults who were current cigarette smokers (21%) was the 12th highest in the United States.19 The prevalence in Ohio was 16% higher than that for the United States (18.1%).19 Figure 4 shows a decrease in the prevalence of current smoking among Ohio adult men and women from 1996 to 2010. The decrease was larger for men (34%-23%) than for women (24%-22%), resulting in the gap closing between the prevalence of adult men and women who were current cigarette smokers in Ohio. There was also a decreasing trend in current cigarette smoking from 2011 to 2014.
Figure 4.
Trends of adults who are current cigarette smokers by sex in Ohio, 1996-2014.
Source: Centers for Disease Control and Prevention, National Center for Chronic Disease Prevention and Health Promotion, Division of Population Health. BRFSS Prevalence & Trends Data (online) 2015. Note: Data from 2011-present were weighted by age, sex, race/ethnicity, geography, marital status, education, home ownership and telephone source using an iterative proportional fitting (raking) method. Data prior to 2011 were weighted by age and sex using a poststratification method. Thus, BRFSS data for 2011-present should not be compared with data prior to 2011.
Geographic variation of EAC and risk factors in Ohio
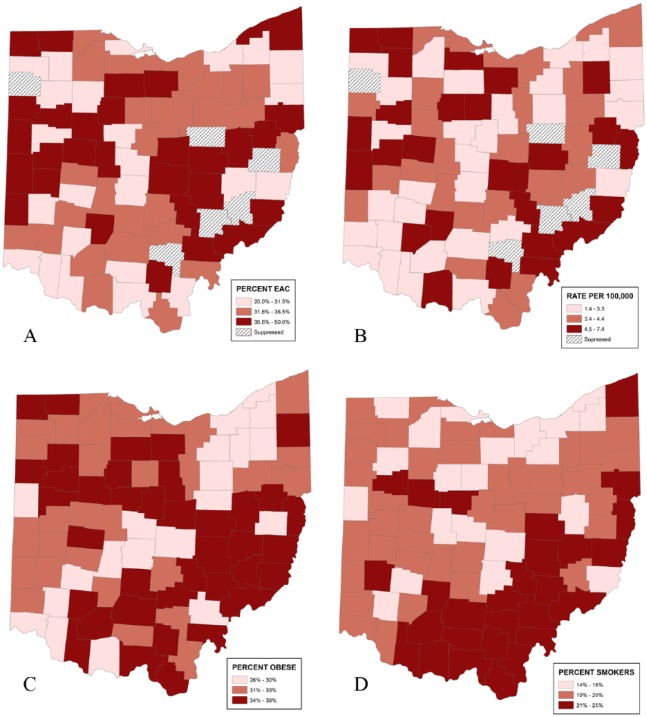
Figure 5 shows the geographic variation of the percent of esophageal cancers that were EACs (2009-2013), incidence rate of EAC (2009-2013), percent of Ohio adults who were obese (2012), and percent of Ohio adults who were current cigarette smokers (2014), respectively. Counties in the southeast and northcentral areas had the highest percent of esophageal cancers that were EAC from 2009 to 2013. Many of these counties also had the highest EAC incidence rates from 2009 to 2013. Obesity ranged from 26% to 39% in Ohio counties, with the highest percents found in the southeast area. The southeast counties also had a high percent of current adult cigarette smokers.
Figure 5.
Geographic patterns of EAC and risk factors by county in Ohio. (A) Percent of esophageal cases that are EAC by county in Ohio, 2009-2013. (B) Average annual age-adjusted incidence rates of EAC by county in Ohio, 2009-2013. (C) Percent of obese (BMI ⩾ 30) adults by county in Ohio, 2012. (D) Percent of adults who are currently cigarette smokers by county in Ohio, 2014. BMI indicates body mass index; EAC, esophageal adenocarcinoma.
EAC Case Source: Ohio Cancer Incidence Surveillance System, Ohio Department of Health, 2016. All rates were age-adjusted to the 2000 US standard population using 19 age groups. Suppressed: rates not calculated when the case count for 2009-2013 was less than 5. Risk factor source: Centers for Disease Control and Prevention, National Center for Chronic Disease Prevention and Health Promotion, Division of Population Health.
Discussion
Many studies have reported the increasing trend in the EAC incidence rate in the United States5–7,25; however, to our knowledge, a systematic comparison of EAC incidence by sex, race, age, and year in an individual state compared with the United States has not been previously published.
Similar to the US EAC incidence rates reported by Rubenstein and others, the incidence rate of EAC in Ohio has also been increasing since 1996 for both men and women.3–7 Previous research on EAC also reported an increase in EAC incidence with age, with most cases occurring after the age of 50.6,12,26 This study found a similar trend in Ohio with the incidence rate of EAC increasing with advancing age group. Also reported elsewhere were higher rates for men compared with women and blacks compared with whites in the United States,6,7,12,25,26 similar to what is reported here; however, compared with SEER, Ohio had higher incidence rates of EAC for each sex, race, and age group.
Many studies have reported obesity, GERD, and tobacco smoking as the primary risk factors for EAC.5,7,9,10 The prevalence of obesity was higher in Ohio compared with the United States in 2012. Moreover, the prevalence of obesity has been increasing over the past several decades in both Ohio and the United States. Although the prevalence of current cigarette smoking in adults has been slowly decreasing in Ohio and the United States, the Ohio prevalence was higher than the United States. Furthermore, the prevalence of current cigarette smoking among women has been decreasing at a slower rate over time than that for men in Ohio. This, along with the increase in obesity, may contribute to both the higher proportion of esophageal cancers that were EAC and the high incidence rate of EAC in Ohio women, compared with US women.
Geographically, the predominantly rural counties of southeast and northwest Ohio have higher rates of obesity, and the southeast has higher rates of current cigarette smoking, compared with other regions in Ohio. Many counties in these rural regions were also those with higher incidence rates of EAC. One area heavily affected was Appalachian Ohio, a 32-county region of Ohio with approximately 18% of the population (or more than 2 million people) that is part of the Appalachian region of the United States that runs along the spine of the Appalachian Mountains from New York to Mississippi.27 Characteristics of Appalachia include lower income, higher prevalence of unemployment, less urbanization, lower level of educational attainment, and numerous health disparities, including increased obesity and tobacco use compared with the United States overall.28 This study demonstrates that Ohio Appalachian counties may benefit from targeted programs and interventions such as smoking cessation and obesity prevention/reduction programs to reduce EAC risk factors and incidence and these efforts may have the added benefits of reducing risks of other tobacco- and obesity-associated diseases.
There were several limitations in this study. Results concerning EAC incidence presented here were restricted to 1996-2013, the years for which OCISS data were available, and therefore did not capture the most dramatic increase in EAC in the United States, which occurred from 1975 to 1996. After 1996, the US EAC incidence rate increased but at a slower rate, similar to what was found in the Ohio data presented here. This study was also limited to 2 noncomparable segments of BRFSS trend data. Because of changes in sampling methods, data prior to 2011 cannot be compared with data from 2011 and after.19 This study also lacked individual record of exposure to risk factors. Because of this, overall Ohio and county-level rates and risk factor prevalence estimates were used; thus, direct causal associations between risk factors and EAC could not be evaluated. Finally, estimates of the prevalence of GERD in this population, the third primary risk factor for EAC, were not available. According to a meta-analysis conducted by Runge et al,7 GERD had a higher magnitude of association (odds ratio) with EAC compared with obesity and tobacco. Having individual estimates of each of the 3 primary risk factors would create a better understanding of geographic areas and populations for which interventions may be targeted.
Conclusions
This study identified an increasing trend in both the incidence rate of EAC and the percent of esophageal cancers that were EAC in Ohio. These trends will most likely continue to increase as the prevalence of obesity increases and the prevalence of cigarette smoking remains stable. This study also demonstrated that the incidence rates of EAC were more than 40% higher in Ohio compared with SEER overall and for each sex and race group. This may be in part due to the high obesity and cigarette smoking prevalences in Ohio. Health care providers and public health practitioners should use this information to strategically target EAC prevention in Ohio. Based on these results, other states should evaluate the areas of high incidence of EAC, obesity, and cigarette smoking, as well as high-risk GERD populations to help reduce and prevent this deadly malignancy.
Footnotes
Declaration of conflicting interests:The author(s) declared no potential conflicts of interest with respect to the research, authorship, and/or publication of this article.
Funding:The author(s) received no financial support for the research, authorship, and/or publication of this article.
Author Contributions: Conception of the project: JS, JF and HS. JS calculated all rates and proportions and created figures, RB created all maps. Data was interpreted by all authors. JS drafted the manuscript with critical review and intellectual edits from JF, JKS, RB, HS and EP. EP provided project oversight. All authors have reviewed the final draft and take full responsibility of the content of the paper.
ORCID iD: Julie A Stephens  https://orcid.org/0000-0002-6622-6761
References
- 1. Howlader N, Noone AM, Krapcho M, et al., eds. SEER cancer statistics review 1975–2013. SEER. http://seer.cancer.gov/csr/1975_2013/.
- 2. Zhang HZ, Jin GF, Shen HB. Epidemiologic differences in esophageal cancer between Asian and western populations. Chin J Cancer. 2012;31:281–286. [DOI] [PMC free article] [PubMed] [Google Scholar]
- 3. Hardikar S, Onstad L, Blount PL, Odze RD, Reid BJ, Vaughan TL. The role of tobacco, alcohol, and obesity in neoplastic progression to esophageal adenocarcinoma: a prospective study of Barrett’s esophagus. PLoS ONE. 2013;8:e52192. [DOI] [PMC free article] [PubMed] [Google Scholar]
- 4. Napier KJ, Scheerer M, Misra S. Esophageal cancer: a review of epidemiology, pathogenesis, staging workup and treatment modalities. World J Gastro Oncol. 2014;6:112–120. [DOI] [PMC free article] [PubMed] [Google Scholar]
- 5. Rubenstein JH, Shaheen NJ. Epidemiology, diagnosis, and management of esophageal adenocarcinoma. Gastroenterology. 2015;149:302.e1–317.e1. [DOI] [PMC free article] [PubMed] [Google Scholar]
- 6. Trivers KF, Sabatino SA, Stewart SL. Trends in esophageal cancer incidence by histology, United States, 1998-2003. Int J Cancer. 2008;123:1422–1428. [DOI] [PubMed] [Google Scholar]
- 7. Runge TM, Abrams JA, Shaheen NJ. Epidemiology of Barrett’s esophagus and esophageal adenocarcinoma. Gastroenterol Clin North Am. 2015;44:203–231. [DOI] [PMC free article] [PubMed] [Google Scholar]
- 8. Thrift AP, Whiteman DC. The incidence of esophageal adenocarcinoma continues to rise: analysis of period and birth cohort effects on recent trends. Ann Oncol. 2012;23:3155–3162. [DOI] [PubMed] [Google Scholar]
- 9. Olsen CM, Pandeya N, Green AC, Webb PM, Whiteman DC. Population attributable fractions of adenocarcinoma of the esophagus and gastroesophageal junction. Am J Epidemiol. 2011;174:582–590. [DOI] [PubMed] [Google Scholar]
- 10. Veugelers PJ, Porter GA, Guernsey DL, Casson AG. Obesity and lifestyle risk factors for gastroesophageal reflux disease, Barrett esophagus and esophageal adenocarcinoma. Dis Esophagus. 2006;19:321–328. [DOI] [PubMed] [Google Scholar]
- 11. Maret-Ouda J, El-Serag HB, Lagergren J. Opportunities for preventing esophageal adenocarcinoma. Cancer Prev Res (Phila). 2016;9:828–834. [DOI] [PubMed] [Google Scholar]
- 12. Thrift AP. The epidemic of oesophageal carcinoma: where are we now? Cancer Epidemiol. 2016;41:88–95. [DOI] [PubMed] [Google Scholar]
- 13. Tramacere I, Pelucchi C, Bagnardi V, et al. A meta-analysis on alcohol drinking and esophageal and gastric cardia adenocarcinoma risk. Ann Oncol. 2012;23:287–297. [DOI] [PubMed] [Google Scholar]
- 14. Pandeya N, Williams G, Green AC, Webb PM, Whiteman DC. Alcohol consumption and the risks of adenocarcinoma and squamous cell carcinoma of the esophagus. Gastroenterology. 2009;136:1215–24, e1-2. [DOI] [PubMed] [Google Scholar]
- 15. Dixon JL, Copeland LA, Zeber JE, et al. Association between diabetes and esophageal cancer, independent of obesity, in the united states veterans affairs population. Dis Esophagus. 2015;29:747–751. [DOI] [PubMed] [Google Scholar]
- 16. American Cancer Society Esophagus Cancer Detection. http://www.cancer.org/cancer/esophaguscancer/detailedguide/esophagus-cancer-detection.
- 17. International Classification of Diseases for Oncology (First Revision). 3rd ed. Geneva, Switzerland: World Health Organization; 2013. [Google Scholar]
- 18. The Surveillance Research Program of the Division of Cancer Control Population Sciences. National Cancer Institute, SEER*Stat software version 8.2.1. seer.cancer.gov/seerstat, 2015.
- 19. Centers for Disease Control Prevention, National Center for Chronic Disease Prevention Health Promotion, Division of Population Health. BRFSS prevalence trends data. https://www.cdc.gov/brfss/brfssprevalence/index.html.
- 20. Pierannunzi C, Town M, Garvin W, Shaw FE, Balluz L. Methodologic changes in the behavioral risk factor surveillance system in 2011 and potential effects on prevalence estimates. https://www.cdc.gov/mmwr/preview/mmwrhtml/mm6122a3.htm, 2012. [PubMed]
- 21. County Health Rankings Roadmaps. http://www.countyhealthrankings.org/app/ohio/2016/measure/factors/9/datasource, 2016.
- 22. Zhang X, Holt JB, Lu H, et al. Multilevel regression and poststratification for small-area estimation of population health outcomes: a case study of chronic obstructive pulmonary disease prevalence using the behavioral risk factor surveillance system. Am J Epidemiol. 2014;179:1025–1033. [DOI] [PubMed] [Google Scholar]
- 23. Zhang X, Holt JB, Yun S, Lu H, Greenlund KJ, Croft JB. Validation of multilevel regression and poststratification methodology for small area estimation of health indicators from the behavioral risk factor surveillance system. Am J Epidemiol. 2015;182:127–137. [DOI] [PMC free article] [PubMed] [Google Scholar]
- 24. ArcGIS Desktop: Release 10. Redlands, CA: Environmental Systems Research Institute; 2011. [Google Scholar]
- 25. Carr JS, Zafar SF, Saba N, Khuri FR, El-Rayes BF. Risk factors for rising incidence of esophageal and gastric cardia adenocarcinoma. J Gastrointest Cancer. 2013;44:143–151. [DOI] [PubMed] [Google Scholar]
- 26. Nordenstedt H, El-Serag H. The influence of age, sex, and race on the incidence of esophageal cancer in the United States (1992-2006). Scand J Gastroenterol. 2011;46:597–602. [DOI] [PubMed] [Google Scholar]
- 27. Ohio Department of Development. State of Ohio Four-Year Appalachian development plan 2011-2014. https://www.arc.gov/images/grantsandfunding/StatePlans/Ohio20112014DevelopmentPlan.pdf, February 2012.
- 28. Appalachian Regional Commission. Appalachia then and now: examining changes to the Appalachian region since 1965. https://www.arc.gov/research/researchreportdetails.asp?REPORT_ID=113, February 2015.


