

Abstract
To accurately predict the modifications done during metabolic processes by cytochrome P450 (P450) 3A enzyme, selecting substrates that best represent a broad range of substrate substitutions and that follow the Michaelis-Menten kinetic properties is highly necessary. In the present study, the oxidative pathways of deoxyschizandrin (DS), the most abundant lignan in Fructus Schisandrae fruit extract, were characterized with liver microsomes from human (HLM) and rat (RLM). Only one monohydroxylated metabolite 7(S)-hydroxylated metabolite (isoschizandrin, ISZ), was identified using liquid chromatography–mass spectrometry and nuclear magnetic resonance techniques. CYP3A4 and CYP3A5 were found to be the major isoforms involved in the monohydroxylation of DS. Also, the kinetic studies showed that DS hydroxylation obeyed Michaelis-Menten kinetics both in HLM and in RLM. However, the subsequent metabolism of ISZ was nearly nonexistent when DS was present. More importantly, the interactions between DS and three well characterized CYP3A probe substrates, testosterone (TST), midazolam (MDZ), and nifedipine (NIF), were studied. TST and MDZ were shown to compete with DS for the mutual binding site, causing Km to be increased. The presence of DS also lowered the binding affinities for MDZ and TST. However, DS showed only slight inhibitory effects on nifedipine (NIF) oxidation even though NIF was able to inhibit DS hydroxylation in a noncompetitive fashion. These results show that DS is a good representative substrate of MDZ and TST primarily due to their shared, large binding regions on CYP3A. Therefore, DS is an attractive candidate as a novel CYP3A probe substrate for predicting the metabolic modifications in CYP3A activity.
Introduction
Cytochrome P450 (P450) 3A, the most abundant human P450 enzyme, is involved in the metabolism of many structurally diverse therapeutic agents (Wienkers and Heath, 2005). As a consequence, the individual variability or metabolic modification in CYP3A activity has a potential to greatly increase the risk of drug toxicity when a drug is administrated alone or as a part of combination therapy, especially for those with narrow therapeutic windows (Frye, 2004; Kalgutkar et al., 2007). Thus, a “probe” compound that can be metabolized exclusively by an individual P450 enzyme is greatly needed to evaluate metabolic clearance rate, in order to assess alterations in P450 activities and to adjust dosages in clinical settings with a high risk of drug-drug interaction (DDI) (Zhou et al., 2007; Wille et al., 2008).
To date, many in vitro probe substrates for P450 have been established to evaluate the potential for a new drug to modify P450 activities based on the in vitro probe reactions (Kenworthy et al., 1999; Yuan et al., 2002). However, the available information indicates that a substrate-differential response is often observed for CYP3A4. For example, haloperidol activates dextromethorphan N-demethylation but inhibits nifedipine oxidation (Yuan et al., 2002); erlotinib stimulates midazolam 1′-hydroxylation but inhibits formation of 6β-hydroxytestosterone and oxidized nifedipine (Dong et al., 2011). Stresser et al. (2000) showed that the extent of substrate dependence on the quantitative inhibition parameters (IC50) is as large as 195-fold among the tested CYP3A4 reactions.
Several reasons could partly explain the phenomena mentioned above. First, the presence of several distinct binding domains within the CYP3A active site results in various substrate subgroups (Galetin et al., 2005). Expectedly, false negative prediction of DDI will probably occur between two different subgroups of substrates due to the lack of mutual binding site. Second, in most cases the P450-catalyzed reactions can be described using the Michaelis-Menten equation, based on the premise that substrate-enzyme interactions occur at only one site per enzyme. Then estimates can be deduced using maximum velocity (Vmax) and apparent affinity (Km) parameters to predict both clearance and DDI in vivo (Lin and Lu, 1997; Houston and Kenworthy, 2000). Yet, due to the relatively large substrate-binding cavity of CYP3A, two or more molecules of smaller substrates are postulated to simultaneously occupy the active site cavity (Yano et al., 2004). In response, more complex and rational mechanistic analyses are required (Galetin et al., 2003); otherwise, false positive or negative prediction of DDI will result from classic Michaelis-Menten analysis. Finally, the uniqueness of catalytic site within the substrate-binding cavity of CYP3A that help yield a single metabolite is indispensable to accurately quantify the total intrinsic metabolic clearance.
Unfortunately, until now, most of the commonly used in vitro probes are reported to demonstrate non-Michaelis-Menten kinetic properties, such as autoactivation for testosterone, a probe used in 50% of reported studies, and autoinhibition for midazolam (Houston and Kenworthy, 2000). Therefore, a criteria-based screening for better probe substrates that demonstrate Michaelis-Menten kinetics with a single metabolite and excellent substrate substitution properties are highly sought after, since they can serve as the most representative in vitro probes for CYP3A metabolic activity.
Previously, our laboratory has screened the CYP3A substrates from a large number of Traditional Chinese Medicines that are classified as superior drugs (Wu et al., 2012). Fructus Schisandrae has been used for thousands of years, owing to its diverse pharmacological effects (Wei et al., 2010). Many structurally similar dibenzocyclooctadiene lignans from Fructus Schisandrae were found to be metabolized by CYP3A4. For example, schizandrin has been proven to undergo C-8 hydroxylation and subsequent demethylation by CYP3A4 in vitro (Cao et al., 2010). Also, our preliminary experiments indicated that deoxyschizandrin (DS), another most abundant lignan from Fructus Schisandrae, was metabolized to a single metabolite via CYP3A4. Besides, it is worthy to note the similarity of chemical structures between DS and schizandrin, which differs by a single hydroxyl group present on the cyclooctene ring. Therefore, we hypothesized that DS might be a novel CYP3A substrate that meets the desired criteria for an in vitro probe.
The aim of the present study was therefore to find further support that DS may serve as a specific probe substrate for CYP3A in vitro, through identifying its metabolite, metabolic pathway, and specificity to CYP3A. Then, we further assessed DS’s metabolic kinetic properties and its substitution as a substrate for three commonly used subgroup probes, testosterone, midazolam, and nifedipine.
Materials and Methods
Chemicals
Deoxyschizandrin (purity > 98.0%) was purchased from China Chengdu Scholar Bio-Tech. Co., Ltd. 1-Aminobenzotriazole (ABT), sulfaphenazole, quinidine, clotrimazole, clomethiazole, furafylline, 8-methoxypsoralen, omeprazole, testosterone (TST), 6β-hydroxytestosterone, nifedipine (NIF), oxidized nifedipine, midazolam (MDZ), 1′-hydroxymidazolam (1′-OH-MDZ), glucose-6-phosphate dehydrogenase, NADP+, and d-glucose-6-phosphate were purchased from Sigma-Aldrich (St. Louis, MO). Ketoconazole was obtained from ICN Biomedicals Inc. (Aurora, OH). Montelukast was from Beijing Aleznova Pharmaceutical (Beijing, China). Triethylenethiophosphoramide was purchased from Acros Organics (Geeleu, Belgium). All other reagents were of high-performance liquid chromatography (HPLC) grade or of the highest grade commercially available.
Animals
Wistar rats (n = 10, male, 180–220 g) were purchased from Dalian Medical University (Dalian, China). The animals had free access to tap water and pellet diet (from the Experimental Animal Center of Dalian Medical University) at a temperature of 20–25°C with a 12-hour light-dark cycle and relative humidity of 50 ± 10%. All procedures involving animals complied with the Laboratory Animal Management Principles of China.
Enzyme Source
Pooled human liver microsomes were obtained from BioreclamationIVT (Baltimore, MD). cDNA-expressed recombinant human CYP3A4 and CYP3A5 were obtained from Cypex Ltd. (Dundee, UK). cDNA-expressed CYP1A2, CYP2A6, CYP2B6, CYP2C8, CYP2C9, CYP2D6, CYP2E1, CYP3A1, and CYP3A2 derived from baculovirus-infected insect cells coexpressing NADPH-P450 reductase were obtained from BD Gentest Corp. (Woburn, MA). cDNA-expressed CYP2C19 in Escherichia coli coexpressing NADPH-P450 reductase was purchased from New England Biolabs Ltd. (Beijing, China). Pooled Wistar male rat liver microsomes (RLM; n = 10) were prepared from liver tissue by differential ultracentrifugation as described previously (Liu et al., 2009), and the Lowry method was adopted to determine the concentration of microsomal protein by using bovine serum albumin as a standard (Lowry et al., 1951). Pooled mouse microsomes (MLM), pig microsomes (PLM), and male New Zealand rabbit microsomes (RaLM) were purchased from Research Institute for Liver Diseases (Shanghai, China). All microsomal samples and recombinant human P450 isoforms were stored at –80°C until use.
Incubation Conditions
The optimal conditions for microsomal incubation were determined in the linear range for the formation of metabolite from DS or isoschizandrin (ISZ). The incubation mixture, with a total volume of 200 μl, consisted of 100 mM potassium phosphate buffer (pH 7.4), NADPH-generating system (1 mM NADP+, 10 mM glucose-6-phosphate, 1 IU/ml of glucose-6-phosphate dehydrogenase, and 4 mM MgCl2), and liver microsomes. In all experiments, DS or ISZ (20 mM previously dissolved in methanol) was serially diluted to the required concentrations, where the final methanol concentration did not exceed 0.5% (v/v) in the mixture. After 3 minutes of incubation at 37°C, the reaction was initiated by adding NADPH-generating system, and further incubation followed for 10 minutes at 37°C in a shaking water-bath. The reaction was terminated by the addition of methanol (200 μl). The mixture was kept on ice until it was centrifuged at 20,000g for 10 minutes at 4°C. Aliquots of supernatants were stored at –30°C until analysis. Control incubations without NADPH or without substrate or without microsomes were carried out to ensure that the formation of metabolite was microsome- and NADPH-dependent. All incubations throughout the study were carried out in three independent experiments performed in duplicate with standard deviation (S.D.) values generally below 10%, and results were expressed as mean ± S.D.
Liver Perfusion Studies
Male Wistar rats were anesthetized with intraperitoneal administration of sodium pentobarbital (50 mg/kg). The surgical procedure was based on previously described methods with minor modification (Liu et al., 2000); erythrocyte-free Krebs-Henseleit buffer (KHB) was oxygenated with 95% O2 and 5% CO2. After anesthesia, the abdomen was opened with a U-section. The hepatic artery and infrahepatic vena cava were ligated, and the portal vein was cannulated by a 14-gauge needle double catheter for infusion. The venous perfusate outflow was allowed to drain back into the reservoir. KHB without DS perfusate passed the liver at a flow rate of 15 ml/min at 37°C for 20 minutes for equilibration. Then, KHB perfusate, containing DS (50 μM) from a second reservoir with 200 ml, was used for recirculation for 30 minutes. The reservoir perfusate was sampled at the end of the experiment and stored at –20°C before assay.
Ultra-Fast Liquid Chromatography–Diode Array Detector and Electrospray Ionization–Mass Spectroscopy Analysis
The ultra-fast liquid chromatography (UFLC) system was employed. A Hypersil ODS (C18) analytical column (100 mm × 2.1 mm, 3 μm; Thermo Scientific, Pittsburgh, PA) with a Hypersil ODS (C18) guard column (150 nm × 2.1 mm, 3 μm; Thermo Scientific) was used to separate DS, MDZ, TST, NIF, ISZ, and their respective metabolites. As for DS, MDZ, TST, and NIF, the mobile phase consisted of methanol (A pump) and water (B pump) with the following gradient profile: 0–9 minutes, 50–5% B; 9–12 minutes, 5% B; 12–16.5 minutes, balanced to 50% B; as for ISZ, the mobile phase consisted of CH3OH (A) and water with the following gradient profile: 0–12 minutes, 55–45% B; 12–14 minutes, 45–5% B; 14–18.5 minutes, balanced to 55% B. The flow rate was 0.25 ml/min and the column temperature was kept at 40°C. The respective metabolites of DS, MDZ, TST, and NIF were detected at the detector wavelength of 250 nm, 254 nm, 245 nm, and 237 nm, respectively. Shimadzu LC-MS-2010EV (Kyoto, Japan) instrument with an electrospray ionization (ESI) interface was used for identification of DS and its metabolite. Mass detection was performed in both positive-ion mode (ESI+) and negative ion mode (ESI–) from m/z 100 to 800. The detector voltage was set at +1.75 kV and –1.55 kV for positive and negative ion detections, respectively. The curved desolvation line temperature (CDL) and the block heater temperature were both set at 250°C. Other mass spectrometry (MS) detection conditions were as follows: interface voltage, 4 kV; CDL voltage, 40 V; nebulizing gas (N2) flow was 1.5 l/min and the drying gas (N2) pressure was set at 0.06 MPa. Data processing was performed using the LC-MS Solution software, version 3.41. DS, MDZ, TST, NIF, and their respective metabolites were quantified by the standard curve of authentic standards, which was linear from 0.1 to 30 μM, with correlation coefficient of >0.999. The quantitative method displayed good sensitivity. The limit of detection for DS hydroxylated metabolite is 0.5 ng. The method also displayed good reproducibility, with the intraday and interday variances both less than 3%.
Metabolite Purification
The metabolite (ISZ) was biosynthesized using mixed liver microsomes from rat and human (90% RLM and 10% HLM) and purified for structure elucidation and quantitative analysis. In brief, the incubation system was scaled up to 50 ml. DS (20 mM) was incubated with mixed liver microsomes (10 mg protein/ml) and NADPH-generating system (1 mM NADP+, 10 mM glucose-6-phosphate, 1 IU/ml of glucose-6-phosphate dehydrogenase, and 4 mM MgCl2) for 90 minutes at 37°C. Under these conditions, about 54% of DS was converted to the metabolite. Methanol (25 ml) was added to the reaction mixture to precipitate the protein. After centrifugation at 9000g for 10 minutes, the supernatant was separated and extracted with chloroform (50 ml ×3). The organic layer was combined and dried in vacuum. Then the residue was dissolved in methanol (1 ml) and the metabolite was isolated and purified by semipreparative HPLC with a YMC-Pack ODS-A column (10×250 mm, 5μm; YMC Europe GmbH, Dinslaken, Germany) and eluted with MeOH-H2O (55:45, v/v) to give the compound M (8 mg). The purity of the metabolite was about 98% (HPLC).
Nuclear Magnetic Resonance Spectrometry
1H and 13C nuclear magnetic resonance (NMR) spectra were obtained at 600 MHz on a Bruker AV-600 spectrometer (Bruker, Newark, Germany). Compound M was dissolved in CDCl3 and experiments were conducted at 21°C. Chemical shifts are reported in parts per million (ppm) with reference to tetramethylsilane.
Chemical Inhibition Study
Chemical inhibition studies were performed by adding different human P450 inhibitors to the incubation mixture of DS (2 μM) before the addition of NADPH-generating system. The selection of a 2 μM concentration was based on the Km value. The selective inhibitors and their concentrations were as follows (Bjornsson et al., 2003): montelukast (5 μM) for CYP2C8 (Walsky et al., 2005), sulfaphenazole (10 μM) for CYP2C9, omeprazole (20 μM) for CYP2C19, quinidine (10 μM) for CYP2D6, clomethiazole (50 μM) for CYP2E1, and ketoconazole (1 μM) for CYP3A4. Inhibition by furafylline (10 μM) for CYP1A2, 8-methoxypsoralen (2.5 μM) for CYP2A6, triethylenethiophosphoramide (50 μM) for CYP2B6 (Rae et al., 2002) and ABT (500 μM) for broad P450s (Emoto et al., 2003) were examined by adding DS after preincubation with NADPH-generating system at 37°C for 10 minutes.
Clotrimazole (Turan et al., 2001) was found to be a selective inhibitor of rat CYP3A subfamily. Ketoconazole is a broad inhibitor for rat P450s. Furafylline (Eagling et al., 1998) was able to inhibit both rat CYP1A and rat CYP2C. Therefore, inhibitory effects of clotrimazole (0.001, 0.01, 0.1 μM), ketoconazole (1 μM), and furafylline (50 μM) toward DS metabolism in RLMs were examined.
Correlation Study
The formation rate of the metabolite described for DS (2 μM, near Km value) was determined in a panel of HLM prepared from 12 different human organ donors. These values were compared with the catalytic activities of CYP1A2, 2A6, 2C8, 2C9, 2C19, 2D6, 2E1, and 3A4. Isoform-specific reaction markers and the methods involved were as follows: phenacetin O-deethylation (CYP1A2), coumarin 7-hydroxylation (CYP2A6), paclitaxel 6α-hydroxylation (CYP2C8), diclofenac 4′-hydroxylation (CYP2C9), S-mephenytoin 4′-hydroxylation (CYP2C19), dextromethorphan O-demethylation (CYP2D6), chlorzoxazone 6-hydroxylation (CYP2E1), and testosterone 6β-hydroxylation (CYP3A4). The correlation parameter was expressed by the linear regression coefficient (r2). A P value less than 0.05 was considered statistically significant.
Assay with Recombinant P450s
Ten cDNA-expressed human P450 isoforms coexpressing NADPH-P450 reductase and cytochrome b5 (CYP1A2, CYP2A6, CYP2B6, CYP2C8, CYP2C9, CYP2C19, CYP2D6, CYP2E1, CYP3A4, and CYP3A5) were used. The incubations were carried out as described for the human liver microsomal study. To investigate the contribution of each P450 isoform, DS (50 μM) was incubated with each of the recombinant P450s (40–80 nM) at 37°C for 20 minutes. An ultra-fast liquid chromatography–diode array detector was employed to monitor possible metabolites.
Kinetic Study
To estimate kinetic parameters, DS (0.2–50 μM) was incubated with the pooled HLM (0.05 mg protein/ml), pooled RLM (0.2 mg protein/ml), recombinant CYP3A4 or CYP3A5 (10 nM), CYP3A1 (0.1 mg CYP/ml), or CYP3A2 (0.075 mg P450/ml) for 10 min, respectively. To compare DS kinetic parameters with those of the well known CYP3A4 probes TST, NIF, and MDZ were simultaneously incubated with the pooled HLM, RLM, or recombinant CYP3A4 or CYP3A5 for 10 minutes. On the basis of a previous report, reaction mixtures with human microsomes were incubated at 0.25, 0.25, 0.25 mg/ml of microsomal protein for TST, NIF and MDZ, respectively (Patki et al., 2003). Likewise, the kinetic study of ISZ metabolism was also conducted in HLM and RLM. ISZ (5–300 μM) was incubated with HLM (0.4 mg/ml) or with RLM (0.4 mg/ml) at 37°C for 30 minutes with NADPH-generating system. Formation of metabolites with liver microsomes was linear with respect to incubation time and microsomal protein concentration over ranges relevant to this study. All incubations were carried out in duplicate. The apparent Km and Vmax values were calculated from nonlinear regression analysis of experimental data according to the Michaelis-Menten equation with Origin software, version 7.5. Kinetic constants were reported as the value ± S.D. of the parameter estimates.
Interaction Studies
Incubation Conditions.
Recombinant human P450s at final concentration of 20 nM were incubated with various concentrations of a pair of CYP3A substrates in 100 mM potassium phosphate buffer (pH 7.4) with 1 mM EDTA, 6 mM MgCl2, and an NADPH-generating system consisting of 1 mM NADP+, 10 mM glucose-6-phosphate, 1 IU/ml of glucose-6-phosphate dehydrogenase, and 4 mM MgCl2 in a total volume of 0.1 ml. Incubations were carried out in a 37°C shaking water bath for 10 minutes. The substrates (concentration ranged at least from 1/5 Km to 5 Km) were added to each incubation in either methanol or phosphate buffer depending on the solubility. The final concentration of the organic solvent (methanol) in incubation media was ≤0.5% (v/v). The range of the inhibitor concentrations applied was from 0.5 to100 μM in most studies. The reaction was terminated by 100 μl of ice-cold methanol. Samples were then centrifuged at 20,000g for 15 minutes and further analyzed by UFLC.
Inhibition Kinetics Analysis.
Inhibition constant (Ki) values were determined by using various concentrations of substrates in the presence or absence of inhibitors with Origin software, version 7.5. When DS was used as the substrate, a single-site kinetic model was used to calculate Ki values by nonlinear regression using the equations for competitive inhibition (eq. 1), noncompetitive inhibition (eq. 2), or mixed inhibition (eq. 3) (Copeland, 2000; Liu et al., 2010).
| (1) |
| (2) |
| (3) |
Here v is the velocity of the reaction; S and I are the substrate and inhibitor concentrations, respectively; Ki is the inhibition constant describing the affinity of the inhibitor for the enzyme; and Km is the substrate concentration at half of the Vmax of the reaction. The α value determines the degree to which the binding of inhibitor changes the affinity of the enzyme for substrate. When α is very large (α > 1), binding of inhibitor prevents binding of the substrate and the mixed-model becomes identical to competitive inhibition. The type of inhibition was determined from the fitting of data to the enzyme inhibition models. Goodness of fit to kinetic and inhibition models was assessed from the r2 values and parameter S.D. estimates. Kinetic constants are reported as the mean ± S.D. of the parameter estimate.
Two-site kinetic models were used to calculate Ki values by using the equations for a substrate with substrate-inhibition kinetics (eq. 4), and a substrate with sigmoidal kinetics (eq. 5) (Galetin et al., 2003).
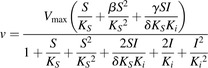 |
(4) |
In eq. 4, β represents change in product formation from substrate-enzyme-substrate (SES) complex due to the second substrate binding; γ represents change in product formation from inhibitor-enzyme-substrate (IES) complex due to inhibitor binding; and δ represents change in affinity of substrate-enzyme or enzyme-substrate (SE/ES) complex for the inhibitor molecular.
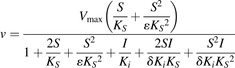 |
(5) |
In eq. 5, δ represents change in affinity of SE/ES and SES complexes for the inhibitor molecule; ε represents change in affinity of SE/ES complex for the second substrate molecular.
Results
Identification of DS Hydroxylation.
A single new peak was eluted at 6.8 minutes by UFLC when DS (50 μM) was incubated with HLM and RLM (0.2 mg/ml) in the presence of NADPH for 20 minutes (Fig. 1). Similar profiles were also observed in MLM, PLM, and RaLM (Supplemental Fig. 1). The peak was not detected in control samples without microsomes, NADPH, or DS (data not shown). To identify the in vivo metabolic profile of DS, the rat liver perfusion was conducted to imitate the in vivo situation. As expected, one predominant metabolite was detected in the perfusate after 30 minutes (Fig. 1). Mass spectra with positive ion ESI was dominated by [M + K]+. The metabolite (M) was identified by UFLC–diode array detector–ESI-MS to show an m/z value of 471, a value that corresponds well to DS (416 plus 39) incorporated with the m/z 16 of the oxygen substitution (Supplemental Table 1). The monohydroxylated metabolite of DS was biosynthesized and purified for structure elucidation, as well as for use as a standard in different analyses. The metabolite structure determination was carried out by NMR, using both 1H-NMR and 13C-NMR analyses (Table 1). And the most distinctive spectra changes were involved in the C-7 region. The doublet of C-7-methyl (C-17) proton signal at 1.00 ppm (3H, d) in DS was replaced by the singlet and shifted downfield to 1.1 ppm (3H, d) in the metabolite. Moreover, the 13C-NMR spectrum of the metabolite showed C-7 downfield shift of 18.9 ppm, compared with DS. The above observations clearly indicated hydroxylation at C-7. 1H- and 13C-NMR spectra of the metabolite coincided with those of isoschizandrin standard (Ikeya et al., 1991). Additionally, no conjugates were observed in the UDP-glucuronic acid (UDPGA)-, 3′-phosphoadenosine-5′-phosphosulfate (PAPS)-, and S-adenosyl-l-methionine (SAM)-generating systems, when DS was incubated with either HLM or S9 fractions (data not shown).
Fig. 1.
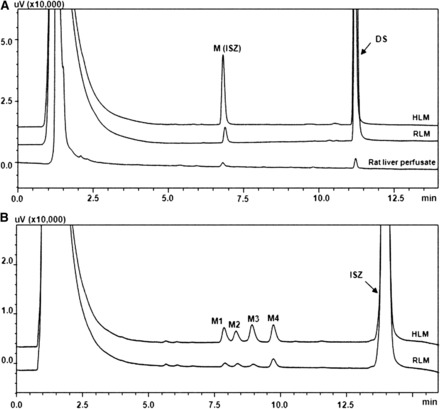
Representative UFLC profiles of DS, ISZ, and their metabolites in human liver microsomes, rat liver microsomes, and rat liver perfusate. DS (50 μM) was incubated with liver microsomes (0.3 mg/ml) at 37°C for 20 minutes (A) from different species with NADPH-generating system; the recirculating perfusate was obtained after a bolus introduction of DS (50 μM) to the perfusate over 30 minutes. Meanwhile, ISZ (100 μM) was incubated with liver microsomes (0.4 mg/ml) at 37°C for 40 minutes from different species and schizandrin (100 μM) was incubated with human liver microsomes (0.3 mg/ml) at 37°C for 20 minutes with NADPH-generating system (B).
TABLE 1.
Proton and carbon NMR chemical shift assignments for deoxyschizandrin and its metabolite (M)
All spectra were recorded on a Bruker ARX-600 spectrometer, in CDCl3.
| No. | Deoxyschizandrin |
M (Isoschizandrin) |
||||
|---|---|---|---|---|---|---|
| δ1H | δ13C | δ1H | δ13C | HMBC (H→C) | NOESY | |
| 1 | 151.5 | 151.3 | ||||
| 2 | 140.1 | 132.8 | ||||
| 3 | 152.8 | 151.9 | ||||
| 4 | 6.54 (s) | 107.1 | 6.64 (s) | 110.4 | C-1, C-2, C-3, C-5, C-6, C-16 | H-6, H-17 |
| 5 | 139.1 | 140.5 | ||||
| 6 | α: 2.55 (dd, J = 13.8, 7.8 Hz) | 35.6 | α: 2.68 (d, J = 13.2 Hz) | 48.2 | ||
| β: 2.50 (dd, J = 13.8, 1.8 Hz) | β: 2.62 (d, J = 13.2 Hz) | C-4, C-5, C-7, C-8, C-16, C-17 | H-4, H-8, H-17 | |||
| 7 | 1.81 (m) | 40.7 | 1.83 (m) | 47.9 | ||
| 8 | 1.91 (m) | 33.7 | 1.73 (m) | 73.8 | C-7, C-10, C-17, C-18 | H-6, H-9, H-11, H-18 |
| 9 | α: 2.28 (dd, J = 13.2, 9.6 Hz) | 39.1 | α: 2.22 (m) | 37.1 | ||
| β: 2.06 (br d, J = 13.2 Hz) | β: 2.18 (m) | C-7, C-8, C-10, C-11, C-15, C-18 | H-8, H-11, H-18 | |||
| 10 | 133.9 | 140.1 | ||||
| 11 | 6.54 (s) | 110.4 | 6.56 (s) | 107.1 | C-9, C-10, C-12, C-13, C-14, C-15 | H-8, H-9 |
| 12 | 151.6 | 153.1 | ||||
| 13 | 139.7 | 138.1 | ||||
| 14 | 151.4 | 151.4 | ||||
| 15 | 123.3 | 121.7 | ||||
| 16 | 122.3 | 123.3 | ||||
| 17 | 1.00 (d, J = 7.2 Hz) | 12.6 | 1.1 (d, J = 7.2 Hz) | 18.9 | C-6,C-7,C-8 | H-4, H-6 |
| 18 | 0.74 (d, J = 6.6 Hz) | 21.8 | 1.07 (s) | 20.7 | C-7,C-8 | H-8, H-9 |
| OMe | 3.59 ×2, 3.87, 3.88, 3.89, 3.90 (each 3H, s) | 60.9 ×2, 60.5 ×2, 55.9 ×2 | 3.60 ×2, 3.87, 3.89, 3.90 ×2 (each 3H, s) | 61.0, 60.9, 60.6 ×2, 55.9 ×2 | ||
Abbreviations: br, broad; d, doublet; m, multiplet; s, singlet; HMBC, heteronuclear multiple-bond correlation spectroscopy; J, coupling constant; NOESY, nuclear Overhauser effect spectroscopy.
Biotransformation of Isoschizandrin by Liver Microsomes.
To elucidate the subsequent biotransformation of ISZ (7S, 8R), the natural enantiomer of schizandrin (7R, 8R) ISZ was biosynthesized by the incubation of DS and NADPH-generating system in mixed liver microsomes. Four product peaks were observed when ISZ (100 μM) was incubated with the hepatic microsomes from human or rat (0.4 mg protein/ml) along with the NADPH-generating system for more than 30 minutes (Fig. 1). Each metabolite of ISZ was below the detection limit when the incubation time is less than 25 minutes. These four metabolites (M-1, M-2, M-3, and M-4) were identified as demethylated ISZ by UFLC-ESI-MS (Supplemental Table 1), and the formation of these metabolites was time-, NADPH-, and microsome-dependent (data not shown). Demethylation was identified as the major metabolic pathway of ISZ, while hydroxylation was the key metabolic pathway of schizandrin (Cao et al., 2010). Furthermore, no conjugates were observed in the UDP-glucuronic acid (UDPGA)-, 3′-phosphoadenosine-5′-phosphosulfate (PAPS)-, and S-Adenosyl-l-methionine (SAM)-generating systems, when ISZ was incubated with either HLM or S9 fractions (data not shown).
Chemical Inhibition Studies.
The effect of various chemical inhibitors on the metabolism of DS was investigated in pooled HLM and RLM (Fig. 2). ABT, a broad P450 inactivator, inhibited DS monohydroxylation completely, suggesting that P450s were the enzymes responsible for DS hydroxylation. Among the ten selective inhibitors tested, ketoconazole, the selective inhibitor of CYP3A, inhibited ISZ formation from DS by 100% (P < 0.05). In our experiments, the other putative inhibitors were not active in reducing DS metabolism in our in vitro test systems. These data together demonstrate that DS metabolism is catalyzed by CYP3A.
Fig. 2.
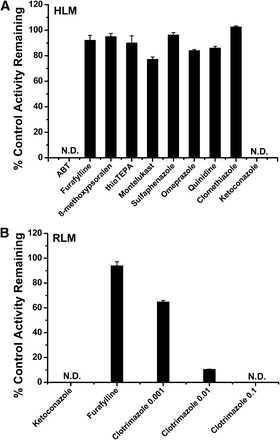
Effects of selective P450 inhibitors on the formation of metabolite ISZ (M) in human liver microsomes (A) and rat liver microsomes (B). Results are the mean ± S.D. from three experiments carried out in duplicate.
To explore whether the metabolic enzymes responsible for DS hydroxylation in rat were also CYP3A isoenzymes, inhibition studies in RLM were conducted with clotrimazole as a selective inhibitor for CYP3A, furafylline as the inhibitor for CYP1A and CYP2C, and ketoconazole as a broad inhibitor for rat P450s. As illustrated in Fig. 2, furafylline (50 μM) slightly inhibited the formation of ISZ in rat, whereas ketoconazole (1 μM) was able to inhibit the formation of ISZ nearly completely, and clotrimazole (0.1 μM) also inhibited the hydroxylation of DS completely. This result implies that CYP3A also plays an important role in the hydroxylation of DS in rat.
Assay with Recombinant Human P450 Isoforms.
To elucidate P450 isoforms involved in the metabolism of DS in human, the activity of DS hydroxylation was determined in ten cDNA-expressed P450 isoforms (Fig. 3). After incubation at 37°C for 20 minutes, hydroxylated metabolite ISZ was observed exclusively in CYP3A4 and CYP3A5. No metabolites were observed in the incubation with CYP1A2, CYP2A6, CYP2B6, CYP2C8, CYP2C9, CYP2C19, CYP2D6, or CYP2E1 (less than 0.01 pmol/min per pmol P450). The formation rates of ISZ in CYP3A4 and CYP3A5 were 34.9 ± 1.4 and 15.1 ± 1.2 pmol/min per pmol P450, respectively. These results indicated that CYP3A4 and CYP3A5 both contribute to DS in HLMs, with CYP3A5 being metabolically less active than CYP3A4.
Fig. 3.
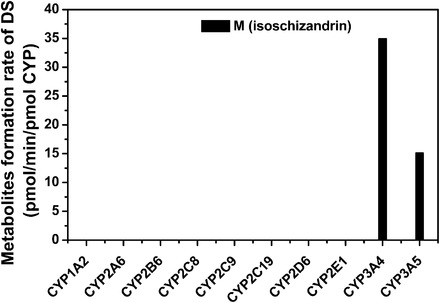
The formation of metabolite M (ISZ) catalyzed by various recombinant human P450s. DS (50 μM) was incubated with various recombinant human P450s (40–80 nM) at 37°C for 20 minutes. Data represent the mean of three experiments carried out in duplicate.
Recombinant human P450 isoforms were also employed to identify P450 isoforms involved in the subsequent metabolism of ISZ in human. After incubation at 37°C for 40 minutes, four demethylated metabolites (M-1, M-2, M-3, and M-4) of ISZ were found in CYP3A4 and CYP3A5 (Supplemental Fig. 2), while no metabolites were observed in the incubations with CYP1A2, CYP2A6, CYP2B6, CYP2C8, CYP2C9, CYP2C19, CYP2D6, or CYP2E1 (less than 0.01 pmol/min per pmol P450).
Correlation Study.
For DS hydroxylation to ISZ, a strong correlation was observed with a CYP3A marker, testosterone 6β-hydroxylation (r2 = 0.85, P < 0.001). DS hydroxylation also correlated with other CYP3A markers, such as phenacetin O-deethylation (CYP1A2, r2 = 0.31), coumarin 7-hydroxylation (CYP2A6, r2 = 0.52), paclitaxel 6α-hydroxylation (CYP2C8, r2 = 0.65), diclofenac 4′-hydroxylation (CYP2C9, r2 = 0.05), S-mephenytoin 4′-hydroxylation (CYP2C19, r2 = 0.11), dextromethorphan O-demethylation (CYP2D6, r2 = 0.31), and chlorzoxazone 6-hydroxylation (CYP2E1, r2 = 0.29). The recombinant CYP1A2, CYP2A6, and CYP2C8 failed to metabolize DS (Fig. 3). Therefore, CYP3A was the major P450 isoform involved in the formation of ISZ in HLM.
Kinetic Study of DS.
The kinetic parameters of ISZ formation in HLM, RLM, and recombinant P450s were determined. The formation rate of ISZ was linear up to 0.05 mg/ml and 0.2 mg/ml microsomal protein and in HLM and RLM for 10-minutes’ incubation, respectively. DS (0.2–50 μM) was incubated with pooled HLM, RLM, recombinant CYP3A4, or recombinant CYP3A5. In parallel, TST (5–300 μM), NIF (2–200 μM), and MDZ (0.5–500 μM) were also treated in the same incubation system. Over the whole concentration range tested, sigmoidal kinetics and substrate inhibition kinetics were observed for TST 6β-hydroxylation and MDZ 1′- hydroxylation, respectively, in accordance with the previous reports (Houston and Kenworthy, 2000). NIF oxidation was observed to obey the Michaelis-Menten kinetics even though both sigmoidal and convex curves were reported for this substrate (Houston and Kenworthy, 2000). Importantly, DS C7-hydroxylation followed Michaelis-Menten kinetics, as depicted by linear Eadie-Hofstee plots in HLM, RLM, and recombinant P450s (Fig. 4). By comparing the kinetic parameters (Table 2), DS showed higher affinity to CYP3A and metabolic capacity than that of TST, NIF, and MDZ in HLM and RLM. Vmax of DS 7-hydroxylation by CYP3A4 was nearly 2.5-fold higher than that by CYP3A5, while DS had similar binding affinity to both enzymes (Km values of 3.2 and 4.1 μM, respectively), and yielded 3-fold clearance difference. Similar trends were also observed for TST and NIF, but the 1′-OH-MDZ formation rate in CYP3A4 was almost 6-fold lower than that in CYP3A5. Moreover, the intrinsic clearance of DS by CYP3A2 was nearly 2.5-fold higher than that by CYP3A1 (Supplemental Table 2 and Supplemental Fig. 3).
Fig. 4.
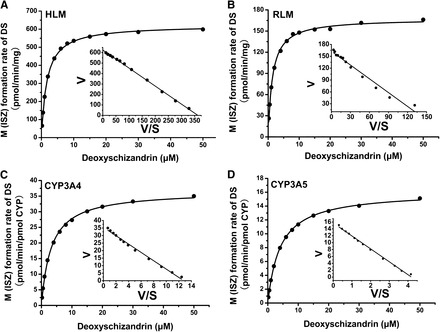
Kinetic plots of DS metabolism after incubation with pooled human liver microsomes (A), pooled rat liver microsomes (B), and recombinant CYP3A4 (C) and CYP3A5 (D). Eadie-Hofstee plots are shown for DS hydroxylation. Lines represent linear regressions of Eadie-Hofstee transformed data best-fits to a Michaelis-Menten model (A–D).
TABLE 2.
Kinetic parameters of DS, NIF, TST metabolism in HLM, RLM, and recombinant human CYP3A4 and CYP3A5
Km values were in μM; Vmax values were in pmol/min per milligram for liver microsomes, or in pmol/min per pmol P450 for CYP3A4; CLint (Vmax/Km) values were in μl/mg per minute for liver microsomes, or in μl/pmol per minute for CYP3A4 and CYP3A5. Each value was the mean ± S.D. of three determinations performed in duplicate.
| Enzyme Source | ||||||||||||||
|---|---|---|---|---|---|---|---|---|---|---|---|---|---|---|
| DSM (Isoschizandrin) |
NIFOX-NIF |
TST6β-HTS |
MDZ1′-OH-MDZ | |||||||||||
| Vmax | Km | CLint | Vmax | Km | CLint | Vmax | S50 | n | CLmaxa | Vmax | Ks | Ksi | CLint | |
| HLM | 623 ± 9.9 | 1.6 ± 0.1 | 389 | 4461 ± 59 | 15.3 ± 1.0 | 297 | 5484 ± 90 | 53.1 ± 5.1 | 1.4 ± 0.1 | 56.8 | 119 ± 4.6 | 3.5 ± 0.4 | 228 ± 43 | 33.7 |
| RLM | 168 ± 2.4 | 1.4 ± 0.3 | 120 | 1360 ± 16 | 20.3 ± 0.8 | 67.0 | 2563 ± 78 | 61.2 ± 4.0 | 1.2 ± 0.1 | 26.7 | 96.9 ± 3.8 | 6.1 ± 1.7 | 206 ± 41 | 16.1 |
| CYP3A4 | 36.7 ± 0.3 | 3.2 ± 0.1 | 11.5 | 35.7 ± 0.7 | 10.2 ± 0.7 | 3.50 | 101 ± 1.1 | 35.1 ± 3.2 | 1.2 ± 0.1 | 1.80 | 5.9 ± 0.2 | 1.3 ± 0.2 | 114 ± 17 | 4.50 |
| CYP3A5 | 16.1 ± 2.4 | 4.1 ± 0.1 | 3.90 | 18.4 ± 0.3 | 15.8 ± 0.8 | 1.20 | 44.7 ± 1.3 | 89.5 ± 5.2 | 1.3 ± 0.1 | 0.29 | 34.2 ± 2.5 | 4.1 ± 0.8 | 173 ± 52 | 8.30 |
6β-HTS, 6β-hydroxytestosterone; OX-NIF, oxidized nifedipine
TST clearance was obtained by Vmax/Km corrected with Hill coefficient (Houston and Kenworthy, 2000).
Kinetic Study of ISZ.
In the same fashion as the DS kinetic study, the kinetic parameters of demethylated ISZ production in pooled HLM and RLM were determined. The formation rates of demethylated metabolites were linear up to 0.4 mg/ml microsomal protein after 30 minutes incubation (ISZ 5–300 mM). In the range of concentrations tested, ISZ demethylation in liver microsomes complied with Michaelis-Menten kinetics, as evidenced by linear Eadie-Hofstee plot (Fig. 5). It is noteworthy that DS exhibited 20–50 times higher affinity to CYP3A in HLM than did ISZ (Table 3 and Supplemental Table 3). Also, due to the low affinity of ISZ to CYP3A, the total intrinsic clearance (CLint) of ISZ via demethylation only accounts for less than 5% of DS hydroxylation clearance in both HLM and RLM individually. Based on the above results, the proposed primary metabolic pathways of DS in HLM and RLM are shown in Fig. 6.
Fig. 5.
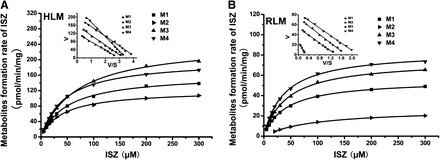
Kinetic plots of ISZ metabolism after incubation with pooled human liver microsomes (A) and pooled rat liver microsomes (B). Eadie-Hofstee plots are shown for both ISZ demethylation. Lines represent linear regressions of Eadie-Hofstee transformed data best-fits to a Michaelis-Menten model (A and B).
TABLE 3.
Kinetic parameters for the in vitro inhibitory effects of pairs of CYP3A substrates in recombinant human CYP3A4 and CYP3A5
Each value was the mean ± S.D. of three determinations performed in duplicate.
| Substrates | Inhibitors | CYP3A4 |
CYP3A5 |
|||||||
|---|---|---|---|---|---|---|---|---|---|---|
| Model* | Ki (μM) | α | δ | Goodness of fit (R2) | Model* | Ki (μM) | δ | Goodness of fit (R2) | ||
| DS | NIF | Eq. 2 | 24.8 ± 2.1 | – | – | 0.990 | Eq. 2 | 27.8 ± 4.2 | – | 0.968 |
| MDZ | Eq. 3 | 6.6 ± 1.3 | 3.8 ± 0.8 | – | 0.994 | Eq. 1 | 14.5 ± 3.3 | – | 0.972 | |
| TST | Eq. 3 | 74.1 ± 10.1 | 5.8 ± 1.2 | – | 0.988 | Eq. 1 | 40.2 ± 8.9 | – | 0.977 | |
| NIF | DS | Eqs. 1–5 | N/A | Eqs. 1–5 | N/A | |||||
| MDZ | Eq. 4 | 17.3 ± 2.2 | – | 0.26 ± 0.1 | 0.960 | Eq. 4 | 10.4 ± 1.8 | 0.41 ± 0.2 | 0.988 | |
| TST | Eq. 5 | 21.1 ± 3.3 | – | 0.73 ± 0.2 | 0.989 | Eq. 5 | 6.8 ± 1.3 | 0.89 ± 7.8 | 0.979 | |
N/A, Not available; *, inhibitory kinetic models as described in Materials and Methods.
Fig. 6.
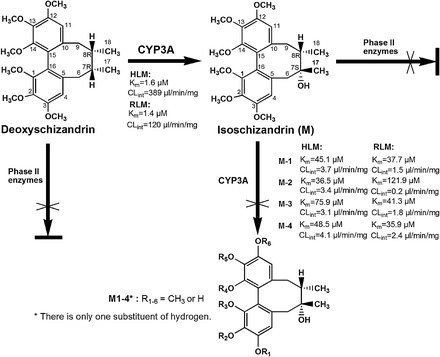
The proposed primary metabolic pathways of DS in liver microsomes from human and rat.
Interaction Studies.
In Table 3, the interaction studies of DS in the presence of the three CYP3A substrates (MDZ, TST, and NIF) are demonstrated. The best model was selected mainly based on the criteria described as r2 values and parameter S.D. estimates (Supplemental Table 4). Dixon and Lineweaver-Burk plots here show that inhibition of DS by both TST and MDZ were best fitted to the mixed inhibition–type models, in which the inhibition kinetic parameter (Ki) in the inhibiting CYP3A4 activity was calculated to be 74.1 ± 10.1 μM for TST and 6.6 ± 1.3 μM for MDZ. The α values yielded were 5.8 for TST and 3.8 for MDZ. Also, inhibitions of DS by TST and MDZ in CYP3A5 were both best fitted to competitive inhibition model with Ki values of 40.2 ± 8.9 μM and 14.5 ± 3.3 μM, respectively. The inhibition of TST by DS was fitted to a two-site kinetic model for sigmoidal kinetics, yielding a larger Ki value of 21.1 ± 3.3 μM in CYP3A4 than the Ki value of 16.3 ± 1.3 μM in CYP3A5. Here, affinity interaction factor δ yielded low values altogether, with 0.73 in CYP3A4 and 0.58 in CYP3A5. The inhibition of MDZ by DS was fitted to the two-site kinetic model for substrate inhibition kinetics, yielding Ki values of 17.3 ± 2.2 μM in CYP3A4 and 10.4 ± 1.8 μM in CYP3A5, and yielding low affinity interaction factor δ values of 0.26 in CYP3A4 and 0.41 in CYP3A5.
In contrast, Dixon and Lineweaver-Burk plots show that inhibition of DS by NIF was best fitted to a noncompetitive inhibition model (Supplemental Fig. 4), in which the inhibition kinetic parameter (Ki) was calculated to be 24.8 ± 2.1 μM and 27.8 ± 4.2 μM for CYP3A4 and CYP3A5, respectively. Also, DS showed negligible inhibitory effects on NIF oxidation in both CYP3A4 and CYP3A5 (Supplemental Fig. 5).
Discussion
In the present study, we identify that C-7- hydroxylation of DS is highly selectively catalyzed by CYP3A in liver microsomes from human and rat. DS hydroxylation was proven to obey Michaelis-Menten kinetics both in HLM, RLM, and recombinant enzymes. For rat, the most commonly used animal species for pharmacokinetic studies, CYP3A1 and CYP3A2 predominantly catalyzed DS hydroxylation (Supplemental Fig. 3). The similarities observed in metabolite profiles and kinetic properties between rat and human suggest that rat is a suitable surrogate animal model for further preclinical pharmacokinetic studies for DS. Primary results indicated mouse, pig, and rabbit also showed similar metabolic profiles in vitro, which implied these species could be involved in further in vivo studies.
To date, it is known that most P450-catalyzed reactions can be described using the Michaelis-Menten equation, and the existing mathematical models used for the prediction of DDI or clearance are all based on Michaelis-Menten kinetic (Ito et al., 1998). Therefore, a probe substrate with Michaelis-Menten kinetic was considered to be a “pragmatic” substrate. In the case of substrates with non-Michaelis-Menten kinetic, two or more molecules of substrates can simultaneously occupy the active site cavity and the kinetic parameters change with substrate occupancy. As a result, more complex mechanistic analyses are demanded; otherwise, false positive or negative prediction of DDI will result from classic Michaelis-Menten analysis. However, the most commonly used substrates of CYP3A recommended by FDA (http://www.fda.gov/Drugs/DevelopmentApprovalProcess/DevelopmentResources/DrugInteractionsLabeling/ucm093664.htm) do not obey the classic Michaelis-Menten kinetics, e.g., TST (Kenworthy et al., 2001), MDZ, NIF (Houston and Kenworthy, 2000), triazolam (Hallifax et al., 2005), and dextromethorphan (Witherow and Houston, 1999). Regardless of the complex mechanism of non-Michaelis-Menten kinetics, ignoring it and truncating the data can lead to erroneous estimates of kinetic parameters (Lin et al., 2001). For example, TST was used in nearly 50% of reported screening studies for DDI potentials (Yuan et al., 2002), but due to its atypical kinetic, its result is difficult to extrapolate to an in vivo setting (Foti et al., 2010). Thus, it is vital to find a substrate with classic Michaelis-Menten kinetic that can serve as an ideal probe for CYP3A activity.
The metabolite ISZ is a naturally occurring (+)-enantiomer of schizandrin. The asymmetric carbon at position 7 yields Z(cis)-(+)-schizandrin (7R, 8R) and E(trans)-(+)-isoschizandrin (7S, 8R). These cis- and trans-lignans possess similar biologic properties, and the pharmacological activity resides mainly at the C7-hydroxyl (Ikeya et al., 1988; Warshawsky and Meyers, 1990). Then the further metabolism of ISZ in microsomes and recombinant P450s was also investigated. Demethylation was identified as the major metabolic pathway of ISZ, in which CYP3A4 and CYP3A5 were involved in the transformation indicated by the recombinant P450s assays. It was almost unrealistic to biosynthesize and purify these demethylated metabolites for structure elucidation, because the metabolite formation rate was close to the limits of quantification. In comparison to the Michaelis-Menten kinetic profiles in HLM, Vmax and Vmax/Km values for schizandrin hydroxylation were 5- to 9-fold larger and at least 40% larger, respectively, than those for ISZ demethylation (Cao et al., 2010). This hints that the metabolic stability improves when Z (cis)-(+)-schizandrin is transformed into E (trans)-(+)-ISZ. Analysis of the structure-metabolism relationship for the three lignans isolated from Fructus Schisandrae suggests that the dibenzocyclooctadiene lignans with six methoxy groups on two benzene rings is the most potent CYP3A substrate. This is observed through its single-site kinetic property, by which hydroxylation or demethylation occur either at C7 or C8, such as with DS, ISZ, and schizandrin (Cao et al., 2010). However, the lignans are prone to be CYP3A inhibitors when the methoxyl groups on phenyl are replaced with methylenedioxy ring (Iwata et al., 2004).
Notably, the subsequent ISZ demethylations were not observed when DS was incubated with HLM even at a very high substrate concentration (DS, 100 μM) within the linear reaction time range (data not shown). These data implied that the subsequent metabolism of ISZ might be abolished when DS was incubated with HLMs and RLM. This can be explained by the fact that DS exhibited 20- to 50-fold higher affinity to CYP3A in HLMs than did ISZ. Another explanation is the extremely low total CLint of ISZ, which accounts for even less than 5% of DS hydroxylation clearance in HLM (Fig. 6). A third is the fact that the logD values for DS and ISZ were calculated to 4.7 and 3.39, respectively (ChemAxon), which suggested that ISZ is a poor substrate compared with DS, owing to a change in lipophilicity driven by the introduction of a hydroxyl group. And the predominant metabolite was identified in the rat liver perfusate that mimics the in vivo situation. Furthermore, when either DS or ISZ was incubated with HLM or S9 fraction, no subsequent conjugates of ISZ or DS were observed in the UDPGA-, PAPS- or SAM-generating systems. Observations here together suggest that DS was metabolized to a single metabolite, ISZ, via CYP3A with high selectivity. The existence of single catalytic/metabolic site for the probe could potentially decrease the chance of erroneous judgment on prediction of DDI potentials, because the P450 modifiers might play seesaw effects on each metabolic site. Quinidine, a CYP3A4 substrate, can be metabolized to two or more metabolites, 3-hydroxyquinidine and quinidine N-oxide, despite exhibiting Michaelis-Menten kinetics (Nielsen et al., 1999). MDZ can also be metabolized to at least two metabolites, 1′-hydroxymidazolam and 4-hydroxymidazolam, and modulators could exert different effects on each metabolite formation (Xia et al., 2009; Dong et al., 2011). As reported, erlotinib and panaxytriol, an active component in Shenmai injection (Zeng et al., 2013), both showed significant activation on MDZ 1′-hydroxylation, whereas the activation but not inhibition made it difficult for the in vivo extrapolation. Moreover, either glucuronidation of hydroxylmidazolam or direct glucuronidation of MDZ occurs in vitro and in vivo (Klieber et al., 2008; Hyland et al., 2009; Seo et al., 2010). The multiple metabolic pathways may partly compensate for the decrease in MDZ metabolic clearance caused by the addition of the inhibitor and would also make it difficult for the in vivo quantification. Thus, the in vivo DDI prediction from the in vitro data for MDZ is lack of rationality at least in theory, despite the reported wealth of in vitro CYP3A inhibition data using MDZ and in vivo DDI data for MDZ.
On the other hand, using in vitro DDI studies as screening tools to evaluate the potential DDI in vivo is based on the assumption that the drugs being analyzed are competing for the same enzyme catalytic site. (Wang et al., 2000). Thus, substrate interaction studies were conducted in which DS substrate substitution was analyzed in the presence of the three substrates of CYP3A. The kinetics of DS in CYP3A4 were best fitted to mix models of inhibition resulting from competition yielding large a values of 5.8 and 3.8 in the presence of TST and MDZ, respectively (Copeland, 2000); DS also exhibited competitive inhibition type in CYP3A5. DS markedly decreased the affinity for TST by CYP3A and TST-CYP3A complex, where low δ values of 0.73 and 0.58 were observed for CYP3A4 and CYP3A5, respectively, and a low δ value suggested that the affinity of inhibitor to the enzyme (or enzyme-substrate complex) increased but the affinity of substrate to the enzyme decreased. Also, similar inhibitory potencies of DS in CYP3A4 and CYP3A5 were evident in binding affinity for MDZ, where low δ values of 0.26 and 0.41 were observed for CYP3A4 and CYP3A5, respectively.
However, inhibition studies using NIF showed different inhibition results. NIF noncompetitively inhibited DS hydroxylation in both CYP3A4 and CYP3A5. Moreover, DS inhibition of NIF oxidation was negligible in both CYP3A4 and CYP3A5, even at high DS concentrations up to 100 μM. Similarly to the previous findings reported by Wang et al. (2000) on the TST-NIF interaction, the unusual DS-NIF interaction seen in this study could also be explained by assuming that NIF has more freedom of movement, and that it can bind to multiple metabolic sites, including the active site of CYP3A4/5 to which DS binds and is fixed. Consequently, NIF can inhibit the hydroxylation of DS, but the inhibition of NIF oxidation by DS cannot be demonstrated kinetically. Regardless of the possible mechanisms, the results in these inhibition studies reveal a complex interaction between NIF and CYP3A even though Michaelis-Menten kinetics was observed.
Overall, an assumption that the CYP3A preferential binding domain to which DS binds is large can be inferred from its high affinity to the CYP3A active sites and the fact that it competes strongly with both MDZ and TST for a mutual binding site an assumption that the preferential binding domain of CYP3A is large, to which DS binds, can be inferred by its high affinity to the CYP3A active sites and the fact that DS competes strongly with both MDZ and TST for the mutual binding site. Furthermore, during the screening and development process, a drug-candidate can be preclassified, with in vitro methods as recommended here, by evaluating different types of kinetic profiles and by studying the similarity between binding regions of the investigational drug and of the probe substrate. This can be then followed by predicting the possible doses in order to modify P450 activities for in vivo DDI risk assessment.
In this study, hydroxylation of DS at the C-7 site to produce a single metabolite, ISZ, via CYP3A metabolism is shown as the exclusive metabolic pathway in human liver microsomes. Additionally, the kinetic profile obeyed Michaelis-Menten kinetics. More importantly, DS is shown to compete with both TST and MDZ for a mutual binding site. Thus, DS is considered a good representative of MDZ and TST substrate subgroups and possesses the three criteria for a pragmatic in vitro probe: high-selectivity for CYP3A with a single metabolite, Michaelis-Menten kinetic properties, and a broad range of substrate substitutions. Conclusively, DS serves as an ideal candidate for a novel and specific CYP3A probe substrate that can predict the modifications in CYP3A-derived metabolism.
Acknowledgments
The authors thank Dr. Di Hu for analysis of NMR data.
Abbreviations
- 1′-OH-MDZ
1′-Hydroxymidazolam
- ABT
1-aminobenzotriazole
- CLint
intrinsic clearance
- DS
deoxyschizandrin
- ESI
electrospray ionization
- HLM
human liver microsomes
- HPLC
high-performance liquid chromatography
- ISZ
isoschizandrin
- Km
apparent affinity
- KHB
Krebs-Henseleit buffer
- MDZ
midazolam
- MS
mass spectrometry
- NIF
nifedipine
- NMR
nuclear magnetic resonance
- P450
cytochrome P450
- RLM
Wistar rat liver microsomes
- TST
testosterone
- UFLC
ultra-fast liquid chromatography
- Vmax
apparent maximum reaction velocity
Authorship Contributions
Participated in research design: Wu, Cao, Zhang, Liu, Hong, Zhu, Ge, Yang.
Conducted experiments: Wu, Cao, Zhang.
Performed data analysis: Wu, Cao, Zhang, Liu, Hong, Zhu, Ge, Yang.
Wrote or contributed to the writing of the manuscript: Wu, Cao, Zhang, Liu, Hong.
Footnotes
This work was supported by the National Key Technology Major Project of China [Grants 2012ZX09506001-006 and 2012ZX10002011-008], and the National Natural Science Foundation of China [Grants 81202587, 81102507, and 81072698].
 This article has supplemental material available at dmd.aspetjournals.org.
References
- Bjornsson TD, Callaghan JT, Einolf HJ, Fischer V, Gan L, Grimm S, Kao J, King SP, Miwa G, Ni L, et al. Pharmaceutical Research and Manufacturers of America Drug Metabolism/Clinical Pharmacology Technical Working Groups (2003) The conduct of in vitro and in vivo drug-drug interaction studies: a PhRMA perspective. J Clin Pharmacol 43:443–469. [PubMed] [Google Scholar]
- Cao YF, Zhang YY, Li J, Ge GB, Hu D, Liu HX, Huang T, Wang YC, Fang ZZ, Sun DX, et al. (2010) CYP3A catalyses schizandrin biotransformation in human, minipig and rat liver microsomes. Xenobiotica 40:38–47. [DOI] [PubMed] [Google Scholar]
- Copeland RA. (2000) Enzymes: A Practical Introduction to Structure, Mechanism, and Data Analysis, Wiley-VCH, New York. [Google Scholar]
- Dong PP, Fang ZZ, Zhang YY, Ge GB, Mao YX, Zhu LL, Qu YQ, Li W, Wang LM, Liu CX, et al. (2011) Substrate-dependent modulation of the catalytic activity of CYP3A by erlotinib. Acta Pharmacol Sin 32:399–407. [DOI] [PMC free article] [PubMed] [Google Scholar]
- Eagling VA, Tjia JF, Back DJ. (1998) Differential selectivity of cytochrome P450 inhibitors against probe substrates in human and rat liver microsomes. Br J Clin Pharmacol 45:107–114. [DOI] [PMC free article] [PubMed] [Google Scholar]
- Emoto C, Murase S, Sawada Y, Jones BC, Iwasaki K. (2003) In vitro inhibitory effect of 1-aminobenzotriazole on drug oxidations catalyzed by human cytochrome P450 enzymes: a comparison with SKF-525A and ketoconazole. Drug Metab Pharmacokinet 18:287–295. [DOI] [PubMed] [Google Scholar]
- Foti RS, Rock DA, Wienkers LC, Wahlstrom JL. (2010) Selection of alternative CYP3A4 probe substrates for clinical drug interaction studies using in vitro data and in vivo simulation. Drug Metab Dispos 38:981–987. [DOI] [PubMed] [Google Scholar]
- Frye RF. (2004) Probing the world of cytochrome P450 enzymes. Mol Interv 4:157–162. [DOI] [PubMed] [Google Scholar]
- Galetin A, Clarke SE, Houston JB. (2003) Multisite kinetic analysis of interactions between prototypical CYP3A4 subgroup substrates: midazolam, testosterone, and nifedipine. Drug Metab Dispos 31:1108–1116. [DOI] [PubMed] [Google Scholar]
- Galetin A, Ito K, Hallifax D, Houston JB. (2005) CYP3A4 substrate selection and substitution in the prediction of potential drug-drug interactions. J Pharmacol Exp Ther 314:180–190. [DOI] [PubMed] [Google Scholar]
- Hallifax D, Rawden HC, Hakooz N, Houston JB. (2005) Prediction of metabolic clearance using cryopreserved human hepatocytes: kinetic characteristics for five benzodiazepines. Drug Metab Dispos 33:1852–1858. [DOI] [PubMed] [Google Scholar]
- Houston JB, Kenworthy KE. (2000) In vitro-in vivo scaling of CYP kinetic data not consistent with the classical Michaelis-Menten model. Drug Metab Dispos 28:246–254. [PubMed] [Google Scholar]
- Hyland R, Osborne T, Payne A, Kempshall S, Logan YR, Ezzeddine K, Jones B. (2009) In vitro and in vivo glucuronidation of midazolam in humans. Br J Clin Pharmacol 67:445–454. [DOI] [PMC free article] [PubMed] [Google Scholar]
- Ikeya Y, Taguchi H, Mitsuhashi H, Takeda S, Kase Y, Aburada M. (1988) The constituents of Schizandra Chinensis. 14. A lignan from Schizandra Chinensis. Phytochemistry 27:569–573. [Google Scholar]
- Ikeya Y, Sugama K, Okada M, Mitsuhashi H. (1991) The constituents of Schisandra species. 17. 2 Lignans from Schisandra-Sphenanthera. Phytochemistry 30:975–980. [Google Scholar]
- Ito K, Iwatsubo T, Kanamitsu S, Ueda K, Suzuki H, Sugiyama Y. (1998) Prediction of pharmacokinetic alterations caused by drug-drug interactions: metabolic interaction in the liver. Pharmacol Rev 50:387–412. [PubMed] [Google Scholar]
- Iwata H, Tezuka Y, Kadota S, Hiratsuka A, Watabe T. (2004) Identification and characterization of potent CYP3A4 inhibitors in Schisandra fruit extract. Drug Metab Dispos 32:1351–1358. [DOI] [PubMed] [Google Scholar]
- Kalgutkar AS, Obach RS, Maurer TS. (2007) Mechanism-based inactivation of cytochrome P450 enzymes: chemical mechanisms, structure-activity relationships and relationship to clinical drug-drug interactions and idiosyncratic adverse drug reactions. Curr Drug Metab 8:407–447. [DOI] [PubMed] [Google Scholar]
- Kenworthy KE, Bloomer JC, Clarke SE, Houston JB. (1999) CYP3A4 drug interactions: correlation of 10 in vitro probe substrates. Br J Clin Pharmacol 48:716–727. [DOI] [PMC free article] [PubMed] [Google Scholar]
- Kenworthy KE, Clarke SE, Andrews J, Houston JB. (2001) Multisite kinetic models for CYP3A4: simultaneous activation and inhibition of diazepam and testosterone metabolism. Drug Metab Dispos 29:1644–1651. [PubMed] [Google Scholar]
- Klieber S, Hugla S, Ngo R, Arabeyre-Fabre C, Meunier V, Sadoun F, Fedeli O, Rival M, Bourrie M, Guillou F, et al. (2008) Contribution of the N-glucuronidation pathway to the overall in vitro metabolic clearance of midazolam in humans. Drug Metab Dispos 36:851–862. [DOI] [PubMed] [Google Scholar]
- Lin JH, Lu AYH. (1997) Role of pharmacokinetics and metabolism in drug discovery and development. Pharmacol Rev 49:403–449. [PubMed] [Google Scholar]
- Lin Y, Lu P, Tang C, Mei Q, Sandig G, Rodrigues AD, Rushmore TH, Shou M. (2001) Substrate inhibition kinetics for cytochrome P450-catalyzed reactions. Drug Metab Dispos 29:368–374. [PubMed] [Google Scholar]
- Liu HX, Hu Y, Liu Y, He YQ, Li W, Yang L. (2009) Hydroxylation of tanshinone IIa in human liver microsomes is specifically catalysed by cytochrome P4502A6. Xenobiotica 39:382–390. [DOI] [PubMed] [Google Scholar]
- Liu KX, Kato Y, Kaku TI, Santa T, Imai K, Yagi A, Ishizu T, Sugiyama Y. (2000) Hydroxyprolylserine derivatives JBP923 and JBP485 exhibit the antihepatitis activities after gastrointestinal absorption in rats. J Pharmacol Exp Ther 294:510–515. [PubMed] [Google Scholar]
- Liu Y, Ramírez J, House L, Ratain MJ. (2010) Comparison of the drug-drug interactions potential of erlotinib and gefitinib via inhibition of UDP-glucuronosyltransferases. Drug Metab Dispos 38:32–39. [DOI] [PMC free article] [PubMed] [Google Scholar]
- Lowry OH, Rosebrough NJ, Farr AL, Randall RJ. (1951) Protein measurement with the Folin phenol reagent. J Biol Chem 193:265–275. [PubMed] [Google Scholar]
- Nielsen TL, Rasmussen BB, Flinois JP, Beaune P, Brosen K. (1999) In vitro metabolism of quinidine: the (3S)-3-hydroxylation of quinidine is a specific marker reaction for cytochrome P-4503A4 activity in human liver microsomes. J Pharmacol Exp Ther 289:31–37. [PubMed] [Google Scholar]
- Patki KC, Von Moltke LL, Greenblatt DJ. (2003) In vitro metabolism of midazolam, triazolam, nifedipine, and testosterone by human liver microsomes and recombinant cytochromes p450: role of cyp3a4 and cyp3a5. Drug Metab Dispos 31:938–944. [DOI] [PubMed] [Google Scholar]
- Rae JM, Soukhova NV, Flockhart DA, Desta Z. (2002) Triethylenethiophosphoramide is a specific inhibitor of cytochrome P450 2B6: implications for cyclophosphamide metabolism. Drug Metab Dispos 30:525–530. [DOI] [PubMed] [Google Scholar]
- Seo K-A, Bae SK, Choi Y-K, Choi CS, Liu K-H, Shin J-G. (2010) Metabolism of 1′- and 4-hydroxymidazolam by glucuronide conjugation is largely mediated by UDP-glucuronosyltransferases 1A4, 2B4, and 2B7. Drug Metab Dispos 38:2007–2013. [DOI] [PubMed] [Google Scholar]
- Stresser DM, Blanchard AP, Turner SD, Erve JCL, Dandeneau AA, Miller VP, Crespi CL. (2000) Substrate-dependent modulation of CYP3A4 catalytic activity: analysis of 27 test compounds with four fluorometric substrates. Drug Metab Dispos 28:1440–1448. [PubMed] [Google Scholar]
- Turan VK, Mishin VM, Thomas PE. (2001) Clotrimazole is a selective and potent inhibitor of rat cytochrome P450 3A subfamily-related testosterone metabolism. Drug Metab Dispos 29:837–842. [PubMed] [Google Scholar]
- Walsky RL, Obach RS, Gaman EA, Gleeson JPR, Proctor WR. (2005) Selective inhibition of human cytochrome P4502C8 by montelukast. Drug Metab Dispos 33:413–418. [DOI] [PubMed] [Google Scholar]
- Wang RW, Newton DJ, Liu N, Atkins WM, Lu AYH. (2000) Human cytochrome P-450 3A4: in vitro drug-drug interaction patterns are substrate-dependent. Drug Metab Dispos 28:360–366. [PubMed] [Google Scholar]
- Warshawsky AM, Meyers AI. (1990) Asymmetric total synthesis of dibenzocyclooctadiene lignans (-)-schizandrin and (-)-isoschizandrin - structure revision of (+)-isoschizandrin. J Am Chem Soc 112:8090–8099. [Google Scholar]
- Wei H, Sun L, Tai Z, Gao S, Xu W, Chen W. (2010) A simple and sensitive HPLC method for the simultaneous determination of eight bioactive components and fingerprint analysis of Schisandra sphenanthera. Anal Chim Acta 662:97–104. [DOI] [PubMed] [Google Scholar]
- Wienkers LC, Heath TG. (2005) Predicting in vivo drug interactions from in vitro drug discovery data. Nat Rev Drug Discov 4:825–833. [DOI] [PubMed] [Google Scholar]
- Wille SMR, Cooreman SG, Neels HM, Lambert WEE. (2008) Relevant issues in the monitoring and the toxicology of antidepressants. Crit Rev Clin Lab Sci 45:25–89. [DOI] [PubMed] [Google Scholar]
- Witherow LE, Houston JB. (1999) Sigmoidal kinetics of CYP3A substrates: an approach for scaling dextromethorphan metabolism in hepatic microsomes and isolated hepatocytes to predict in vivo clearance in rat. J Pharmacol Exp Ther 290:58–65. [PubMed] [Google Scholar]
- Wu JJ, Ai CZ, Liu Y, Zhang YY, Jiang M, Fan XR, Lv AP, Yang L. (2012) Interactions between phytochemicals from traditional Chinese medicines and human cytochrome P450 enzymes. Curr Drug Metab 13:599–614. [DOI] [PubMed] [Google Scholar]
- Xia CH, Sun JG, Wang GJ, Shang LL, Zhang XX, Zhang R, Wang XJ, Hao HP, Xie L. (2009) Differential effect of Shenmai injection, a herbal preparation, on the cytochrome P450 3A-mediated 1′-hydroxylation and 4-hydroxylation of midazolam. Chem Biol Interact 180:440–448. [DOI] [PubMed] [Google Scholar]
- Yano JK, Wester MR, Schoch GA, Griffin KJ, Stout CD, Johnson EF. (2004) The structure of human microsomal cytochrome P450 3A4 determined by X-ray crystallography to 2.05-A resolution. J Biol Chem 279:38091–38094. [DOI] [PubMed] [Google Scholar]
- Yuan R, Madani S, Wei XX, Reynolds K, Huang SM. (2002) Evaluation of cytochrome P450 probe substrates commonly used by the pharmaceutical industry to study in vitro drug interactions. Drug Metab Dispos 30:1311–1319. [DOI] [PubMed] [Google Scholar]
- Zeng CW, He F, Xia CH, Zhang H, Xiong YQ. (2013) Identification of the active components in Shenmai injection that differentially affect Cyp3a4-mediated 1′-hydroxylation and 4-hydroxylation of midazolam. Drug Metab Dispos 41:785–790. [DOI] [PubMed] [Google Scholar]
- Zhou SF, Xue CC, Yu XQ, Li C, Wang G. (2007) Clinically important drug interactions potentially involving mechanism-based inhibition of cytochrome P450 3A4 and the role of therapeutic drug monitoring. Ther Drug Monit 29:687–710. [DOI] [PubMed] [Google Scholar]