Abstract
Objectives
The PROMIS-Preference (PROPr) score is a recently developed summary score for the Patient-Reported Outcomes Measurement Information System (PROMIS). PROPr is a preference-based scoring system for seven PROMIS domains created using multiplicative multi-attribute utility theory. It serves as a generic, societal, preference-based summary scoring system of health-related quality of life. This manuscript evaluates construct validity of PROPr in two large samples from the US general population.
Methods
We utilized 2 online panel surveys, the PROPr Estimation Survey and the Profiles-Health Utilities Index (HUI) Survey. Both included the PROPr measure, patient demographic information, self-reported chronic conditions, and other preference-based summary scores: the EuroQol-5D (EQ-5D-5L) and HUI in the PROPr Estimation Survey and the HUI in the Profiles-HUI Survey. The HUI was scored as both the Mark 2 and the Mark 3. Known-groups validity was evaluated using age- and gender-stratified mean scores and health condition impact estimates. Condition impact estimates were created using ordinary least squares regression in which a summary score was regressed on age, gender, and a single health condition. The coefficient for the health condition is the estimated effect on the preference score of having a condition vs. not having it. Convergent validity was evaluated using Pearson correlations between PROPr and other summary scores.
Results
The sample consisted of 983 respondents from the PROPr Estimation Survey and 3,000 from the Profiles-HUI survey. Age- and gender-stratified mean PROPr scores were lower than EQ-5D and HUI scores, with fewer subjects having scores corresponding to perfect health on the PROPr. In the PROPr Estimation survey, all 11 condition impact estimates were statistically significant using PROPr, 8 were statistically significant by the EQ-5D, 7 were statistically significant by HUI Mark 2, and 9 were statistically significant by HUI Mark 3. In the Profiles-HUI survey, all 21 condition impact estimates were statistically significant using summary scores from all three scoring systems. In these samples, the correlations between PROPr and the other summary measures ranged from 0.67 to 0.70.
Conclusions
These results provide evidence of construct validity for PROPr using samples from the US general population.
Introduction
Patient reports about functioning and well-being, or health-related quality of life (HRQoL), are important outcomes of health care and policy [1,2]. Measures of HRQoL can be disease-targeted, providing detailed measurement about symptoms, treatment effects, and side effects relevant to a particular condition. Measures can also be generic, providing an overall description of health not limited to one organ system or disease [3]. The proliferation of HRQoL measures, however, has made it difficult to compare results across studies that use different measures [4,5].
HRQoL can be categorized further using health profile measures or preference-based measures. Profile measures provide a description of multiple domains of health such as physical functioning, mental health, and pain. These measures provide multiple scores–one for each domain of health. Preference-based measures also cover multiple health domains but are combined into a single summary preference-based score, on a scale where 0 is “dead” and 1 is “full health”) scale. Preference-based scoring allows for estimates of quality-adjusted life years (QALYs) that afford comparisons among treatment options in clinical decision-making and economic analysis [2, 6–8].
The most widely used generic preference-based measures include the EuroQol-5D (EQ-5D) [9], Health Utilities Index (HUI) [10–11], SF-6D [12], and the Quality of Well-being Index [13]. Each, however, has some limitations: (1) large proportions of the respondents scoring at the very top or very bottom of the scale (i.e., ceiling effects in the very healthy or floor effects in the very ill), (2) imprecise measurement for individuals, (3) poorly-worded questions such as those that combine concepts (double-barreled items), and (4) lack of coverage of the full range of health [14]. These limitations arise from the descriptions of health used in these measures and not the method of scoring.
Recent efforts to develop the next generation of health profile measures using Item Response Theory (IRT) [15] have created an opportunity to leverage these improvements into preference-based measures [14]. Most notably, IRT has been used to develop the Patient-Reported Outcomes Measurement Information System (PROMIS) with support from the National Institutes of Health [16,17]. PROMIS addresses several limitations of the existing generic preference measures including: (1) capturing a wider range of each health domain, (2) measuring individual health status with greater precision, and (3) using rigorously designed and tested questions. A preference-based scoring system for PROMIS would create the possibility of simultaneously collecting both health profile and preference-based scores.
Using input from measurement experts and community members, we developed a preference scoring system based on 7 domains from the PROMIS measure, known as PROMIS-Preference (PROPr) [18, 19]. The scoring algorithm was estimated using a large representative sample of the US non-institutionalized population [20]. PROPr is the first preference-based summary score to link directly preference-based functions to health domains as measured by IRT. As such, PROPr gains many of the advantages of an IRT-based descriptive system, including flexible administration of items from the health domains used to construct PROPr.
Before any measure can be adopted for widespread use, its validity needs to be demonstrated [3]. We used 2 cross-sectional surveys of the general US population to evaluate the construct validity of the PROPr.
Methods
Data sources
The first dataset was the PROPr Estimation Survey collected online by ICF and SurveyNow, which maintain a panel of pre-validated individuals, primarily for market research. Data were collected in the spring of 2016. The survey sample was intended to be representative of the US population by age, gender, race, ethnicity, education, and income consistent with the 2010 census. As compensation for completing the survey, participants could choose from several rewards, including gift cards and reward program points. The survey was approved by the Institutional Review Board at ICF International (Study #FWA00002349). Responses were de-identified before the authors received them. A full description of the survey is available in the PROPr technical report [21]. Data used in these analyses are available online at the Open Science Framework [22].
The second dataset was the Profiles-HUI survey, collected online using the Op4G internet panel. Op4G maintains a US national sample and participants are required to update demographic information regularly. The sample was ascertained using quotas for region, race/ethnicity, education, and age-gender strata consistent with the 2010 census. Study participants received nominal incentives from Op4G for completing the survey. The specific nature and value of the incentive varied but did not exceed $10. The survey was approved by the Institutional Review Board at Northwestern University (Study #STU00016635). Data used in these analyses are available online at in Dataverse [23].
This study used de-identified data provided by the survey companies. Each study was analyzed separately. Participants in the PROPr Estimation Survey were randomized to receive the EQ-5D-5L, HUI, health conditions, or PROMIS Global questionnaire first. All participants then received the PROMIS-29 and PROMIS Cognitive Function short form (which provided the data on the 7 domains necessary for PROPr) and completed the PROPr valuation exercises. After the valuation exercises, the participant completed the other sections (EQ-5D-5L, HUI, health conditions, and PROMIS Global questionnaire) in random order. All participants in the Profiles-HUI survey completed the same survey form. They first completed a set of socio-demographic and comorbidity items, followed by the PROMIS Global form, a selection of PROMIS items from various banks, and then the HUI. Both surveys asked respondents for demographic information including their age and gender, and about their health conditions by using standardized language from the National Health Interview Survey (e.g., “Have you EVER been told by a doctor or other health professional that you had coronary heart disease?”) [24]. The PROPr Estimation Survey included 11 health conditions and the Profiles-HUI survey included 21 health conditions.
Measures
PROPr
PROPr is based on levels of functioning for 7 PROMIS domains: Cognitive Function, Depression, Fatigue, Pain Interference, Physical Function, Sleep Disturbance, and Ability to Participate in Social Roles and Activities. The PROMIS questions refer to the respondent’s own health “in the last 7 days” and have 5 response options. The PROPr Estimation survey used the standardized 4-item short forms for each of these domains. The Profiles-HUI survey collected 8 to 13 items per domain. Domains were scored by the scoring service on Assessment Center incorporating the default IRT parameters for each item [25]. The PROPr scoring algorithm was developed from standard gamble valuations from a US sample [20]. Possible PROPr scores range from -0.022 to 1.0.
EQ-5D-5L
The EQ-5D-5L was collected in the PROPr Estimation survey. The EQ-5D-5L questions refer to “your health today.” The EQ-5D descriptive system has 5 domains (mobility, self-care, usual activities, pain/discomfort, and anxiety/depression). The PROPr Estimation Survey used the EQ-5D-5L version each with 5 response options [9, 26]. For this study, we applied the EQ-5D-3L crosswalk link function to the US time trade-off value set [27]. Possible scores range from -0.109 to 1.0.
Health Utilities Index (HUI)
The self-administered HUI questionnaire that allows scoring of both Mark 2 and Mark 3 was included in both surveys [10,11]. HUI questions refer to “your level of ability or disability during the past week.” The HUI Mark 2 defines health status on 6 attributes (sensation, mobility, emotion, cognition, self-care, and pain). The HUI Mark 3 defines health on 8 attributes (vision, hearing, speech, ambulation, dexterity, emotion, cognition, and pain). Scoring algorithms for both HUI Mark 2 and HUI Mark 3 were derived from standard gamble assessments made by adults in community samples in Hamilton, Ontario, and employ multiplicative multi-attribute utility functions. HUI Mark 2 scores range from -0.03 to 1.0; HUI Mark 3 scores range from -0.36 to 1.0.
Statistical analysis
Each survey was analyzed separately. We calculated percentages for categorical demographic and health condition variables. We also generated histograms of summary scores for each sample. Convergent validity was evaluated using Pearson correlations between summary scores within-subjects (i.e., comparing the PROPr, HUI, and EQ-5D scores for each participant, in each of the two datasets).
Known-groups validity was evaluated using age- and gender-stratified mean scores for all summary scores. We expected PROPr to show the same patterns in age- and gender-stratified mean scores as other summary scores. Known-groups validity was also evaluated using health condition impact estimates that were created using ordinary least squares regression in which a summary score was regressed on age, gender, and a single health condition. The coefficient for the health condition is the estimated effect on the preference score of having a condition vs. not having it. A separate analysis was done for each condition.
All analyses were performed using SAS 9.4 (The SAS Institute, Cary, NC).
Results
Table 1 summarizes the demographic characteristics of each sample. There were 983 respondents in the PROPr Estimation survey sample and 3000 respondents in the Profiles-HUI survey sample. For comparison, we display age, gender, and race/ethnicity information from the 2010 US census [28] and self-reported chronic condition prevalence from the 2016 National Health Interview Survey [29].
Table 1. Demographic information from the PROPr Estimation and Profiles-HUI surveys.
| Gender (%) | PROPr Estimation Survey | Profiles-HUI Survey | 2010 US Census |
| Female | 54 | 51 | 51 |
| Race (%) | |||
| White | 77 | 71 | 64 |
| Black | 12 | 17 | 12 |
| Asian | 4 | 10 | 5 |
| Ethnicity (%) | |||
| Hispanic | 16 | 17 | 16 |
| Education (%) | |||
| < High School | 12 | 14 | 11 |
| High School Grad or Equivalent | 25 | 31 | 30 |
| > High School | 63 | 55 | 59 |
| Age (%) | |||
| 18–24 Years | 11 | 13 | 12 |
| 25–34 Years | 17 | 18 | 17 |
| 35–44 Years | 10 | 18 | 18 |
| 45–54 Years | 17 | 19 | 20 |
| 55–64 Years | 19 | 16 | 16 |
| 65–74 Years | 13 | 9 | 10 |
| 75–84 Years | 7 | 6 | 6 |
| 85+ Years | 6 | 2 | 3 |
| Chronic Health Conditions (%) | National Health Interview Survey 2016 | ||
| Coronary Heart Disease | 2 | Not asked | 5 |
| Angina (Angina Pectoris) | 1 | Not asked | 2 |
| Heart Attack (Myocardial Infarction) | 1 | 5 | 4 |
| Chest Pain (Angina) | Not asked | 10 | Not asked |
| Hardening of the Arteries (Coronary Artery Disease) | Not asked | 4 | Not asked |
| Heart Failure or Congestive Heart Failure | Not asked | 4 | Not asked |
| Stroke | 6 | Not asked | 4 |
| Stroke or Transient Ischemic Attack (TIA) | Not asked | 3 | Not asked |
| Emphysema | 1 | Not asked | 2 |
| Chronic Obstructive Pulmonary Disease (COPD) | 4 | 5 | 4 |
| Asthma | 14 | 17 | 14 |
| Cancer or Malignancy of any Kind | 16 | 5 | 11 |
| Arthritis/Gout/Lupus/Fibromyalgia | 26 | Not asked | 28 |
| Arthritis or Rheumatism | Not asked | 20 | Not asked |
| Seizure Disorder or Epilepsy | 6 | Not asked | Not asked |
| Diabetes or Sugar Diabetes | 19 | 11 | 11 |
| High Blood Pressure (Hypertension) | Not asked | 34 | 35 |
| Liver Disease/Hepatitis/Cirrhosis | Not asked | 4 | Not asked |
| Kidney Disease | Not asked | 3 | Not asked |
| Migraines or Severe Headaches | Not asked | 16 | Not asked |
| Depression | Not asked | 24 | Not asked |
| Anxiety | Not asked | 21 | Not asked |
| Alcohol or Drug Problem | Not asked | 5 | Not asked |
| Sleep Disorder | Not asked | 13 | Not asked |
| HIV or AIDS | Not asked | 1 | Not asked |
| Spinal Cord Injury | Not asked | 3 | Not asked |
| Multiple Sclerosis | Not asked | 2 | Not asked |
Figs 1 and 2 illustrate the distribution of summary scores in the PROPr Estimation and Profiles-HUI samples, respectively. The EQ-5D, HUI Mark 2, and HUI Mark 3 all have ceiling effects in these samples. The percent of respondents in the PROPr Estimation survey with a score at the ceiling was 28% for the EQ-5D, 11% for the HUI Mark 2, 10% for the HUI Mark 3, and 2% for PROPr. The percent of respondents in the Profiles-HUI survey with a score at the ceiling was 9% for the HUI Mark 2, 8% for the HUI Mark 3, and 0.4% for PROPr.
Fig 1. Distribution of summary scores in the PROPr Estimation sample.
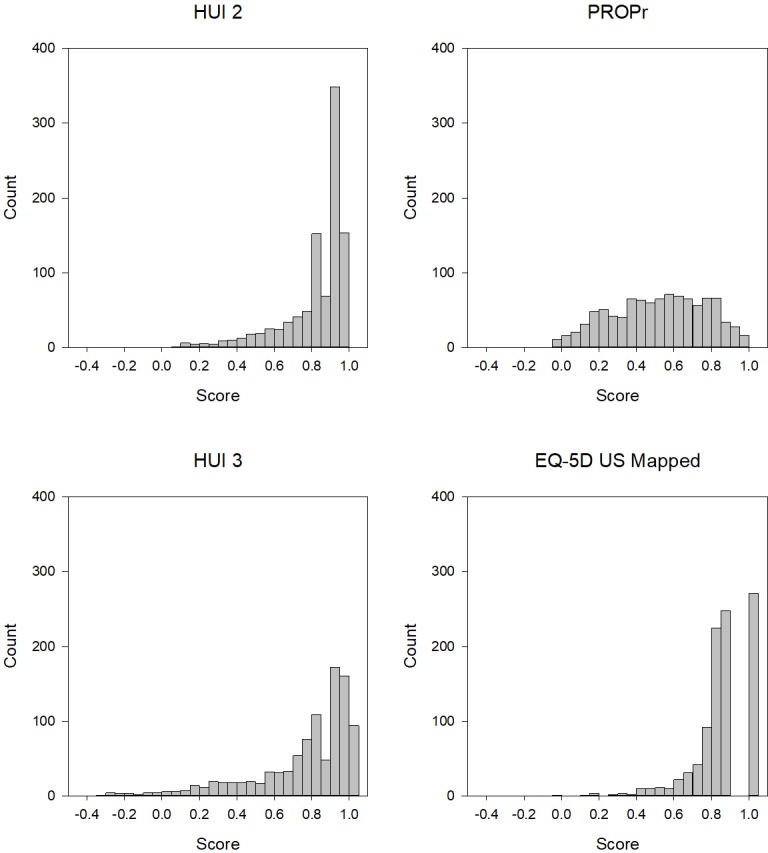
HUI 2 is the Health Utilities Index Mark 2, HUI 3 is the Health Utilities Index Mark 3, EQ-5D US Mapped is the Euroqol-5D-5L mapped to the US valuation set, PROPr is the PROMIS-Preference score.
Fig 2. Distribution of summary scores in the Profiles-HUI sample.
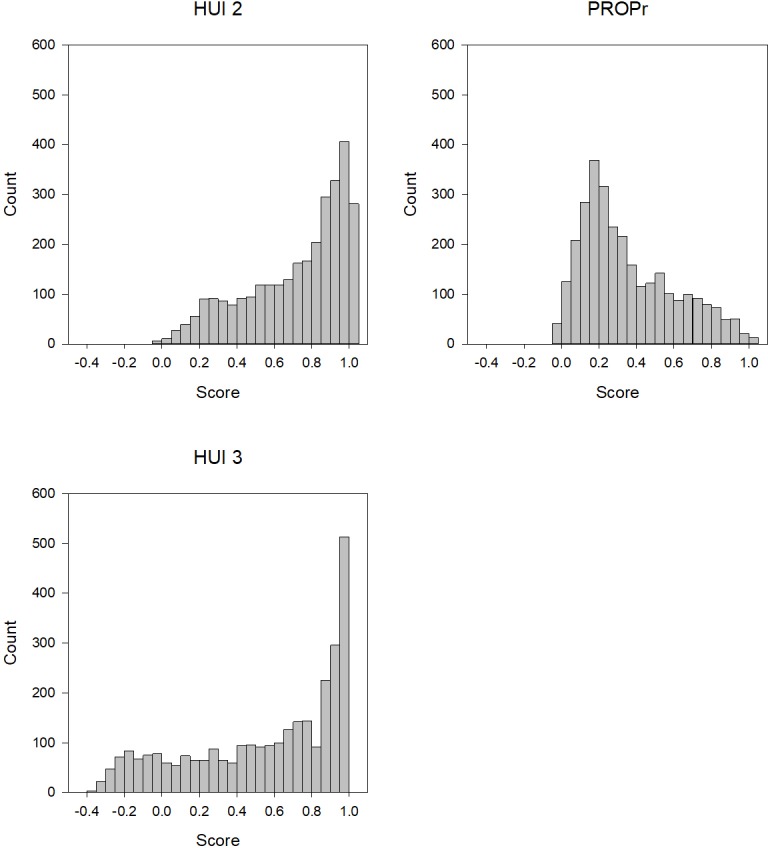
HUI 2 is the Health Utilities Index Mark 2, HUI 3 is the Health Utilities Index Mark 3, PROPr is the PROMIS-Preference score.
Tables 2 and 3 summarize the Pearson correlations between summary scores. In these samples, the correlation between PROPr and the other summary measures ranged from 0.66 to 0.70. The correlations between HUI Mark 2 and HUI Mark 3 are inflated because some of the same questions were used to create both scores.
Table 2. Pearson correlations between summary scores in the PROPr Estimation survey.
| PROPr | HUI Mark 3 | HUI Mark 2 | |
|---|---|---|---|
| EQ-5D | 0.70 | 0.79 | 0.72 |
| HUI Mark 2 | 0.66 | 0.91 | |
| HUI Mark 3 | 0.67 |
Table 3. Pearson correlations between summary scores in the Profiles-HUI survey.
| PROPr | HUI Mark 3 | |
|---|---|---|
| HUI Mark 2 | 0.67 | 0.93 |
| HUI Mark 3 | 0.70 |
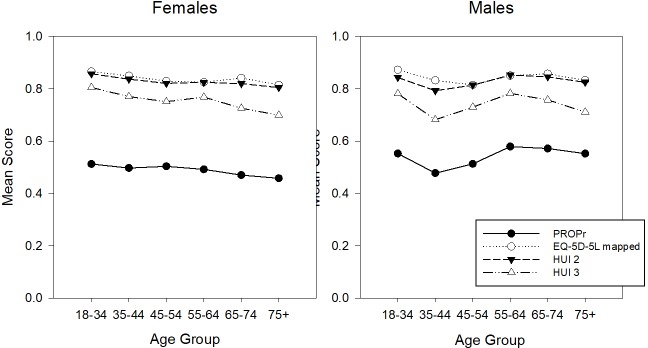
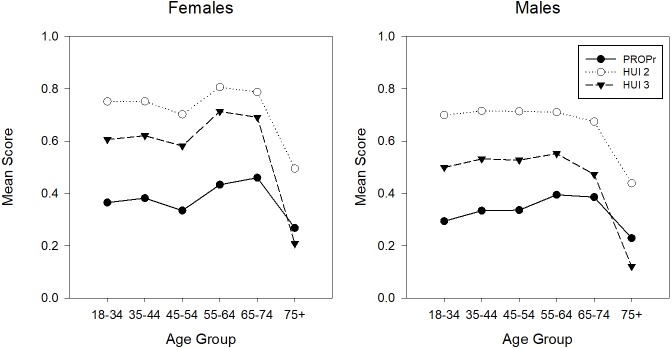
PROPr, which does not have a ceiling effect in these samples, has the lowest age- and gender-stratified mean scores. Figs 3 and 4 illustrate the age- and gender- adjusted mean scores in the PROPr Estimation and Profiles-HUI samples, respectively. In nationally representative samples, health utility scores are usually lower in females than males and decrease with increasing age [30–32]. In the PROPr Estimation sample, males have lower scores than females in the younger age groups whereas females have lower scores in the older age groups. The association between age group and mean score is not monotonic in this sample though all summary scores generally change in the same direction between groups; e.g., all summary scores for 45–54 year old males are lower than 55–64 year old males.
Fig 3. Age- and gender-stratified mean scores in the PROPr Estimation sample.
HUI 2 is the Health Utilities Index Mark 2, HUI 3 is the Health Utilities Index Mark 3, EQ-5D US Mapped is the Euroqol-5D-5L mapped to the US valuation set, PROPr is the PROMIS-Preference score.
Fig 4. Age- and gender-stratified mean scores in the Profiles-HUI sample.
HUI 2 is the Health Utilities Index Mark 2, HUI 3 is the Health Utilities Index Mark 3, PROPr is the PROMIS-Preference score.
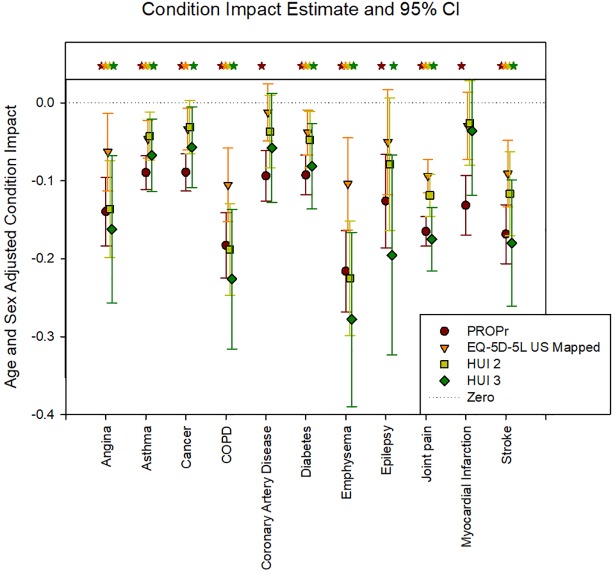
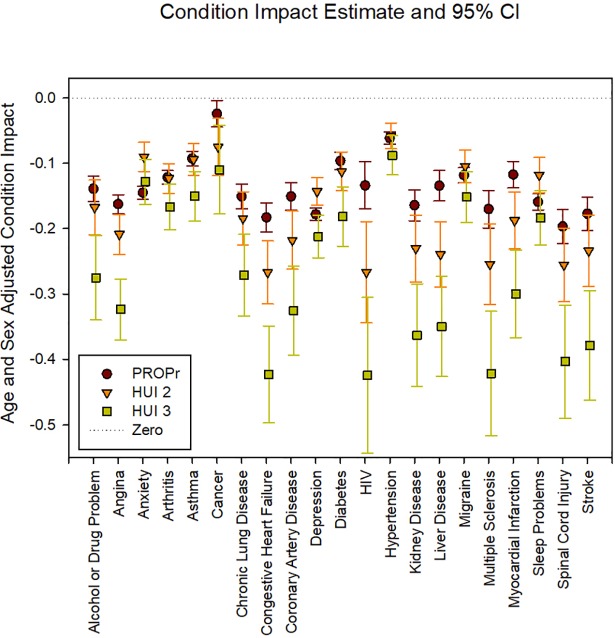
Figs 5 and 6 illustrate the age- and gender- adjusted health condition impacts in the PROPr Estimation and Profiles-HUI samples, respectively. In the PROPr Estimation survey, all 11 condition impact estimates were statistically significantly different from zero (p<0.05) using PROPr, 8 were statistically significant by the EQ-5D, 7 were statistically significant by HUI Mark 2, and 9 were statistically significant by HUI Mark 3. In the Profiles-HUI survey, all 21 condition impact estimates were statistically significant from zero (p<0.05) for all summary scores by all three scoring systems.
Fig 5. Age- and gender-stratified health condition impacts in the PROPr Estimation sample.
HUI 2 is the Health Utilities Index Mark 2, HUI 3 is the Health Utilities Index Mark 3, EQ-5D US Mapped is the Euroqol-5D-5L mapped to the US valuation set, PROPr is the PROMIS-Preference score. Statistically significant estimates are indicated with a star.
Fig 6. Age- and gender-stratified health condition impacts in the Profiles-HUI sample.
HUI 2 is the Health Utilities Index Mark 2, HUI 3 is the Health Utilities Index Mark 3, PROPr is the PROMIS-Preference score. All estimates are statistically significant.
The average condition impact as measured by PROPr is most similar to the HUI Mark 3 in the PROPr Estimation survey (average is -0.136 for PROPr, -0.138 for HUI Mark 3, -0.095 for HUI Mark 2, and -0.061 for the EQ-5D) whereas is it most similar to the HUI Mark 2 in the Profiles-HUI survey (average is -0.137 for PROPr, -0.173 for HUI Mark 2, and -0.268 for HUI Mark 3). HUI Mark 3 generally has the largest impact estimates in both surveys. The standard error of these coefficients was smallest for PROPr in both the PROPr estimation survey (average is 0.036 for PROPr, 0.077 for HUI Mark 3, 0.051 for HUI Mark 2, and 0.041 for EQ-5D) and the Profiles-HUI survey (average is 0.021 for PROPr, 0.045 for HUI Mark 2, and 0.069 for HUI Mark 3). The correlation of conditions by impact estimate is similar across all summary scores with a Pearson correlation greater than 0.70 for all comparisons and a Spearman correlation greater than 0.68 for all comparisons.
Discussion
This report provides the first evaluation of the validity of the PROPr score using 2 large cross-sectional datasets from the general US population. We found that PROPr has good convergent validity with 2 other preference-based summary measures of health–the EQ-5D and the HUI. We also found that PROPr discriminates between those with and without a variety of chronic health conditions. The relative impact of these chronic conditions, as measured by PROPr, was similar to the other preference-based summary scores. Taken together, these findings provide solid justification for the use of PROPr to quantify health-related quality of life for a variety of uses, including calculating aggregated indices of morbidity and mortality such as QALYs.
In these samples, the correlation between PROPr and the other summary measures ranged from 0.66 to 0.70. A prior study that co-administered preference-based summary measures in a large general US population found correlations from 0.60 to 0.71 [31, 33]. The maximum correlation between two measures is the square root of the product of their reliabilities; since the reliability of most health utility measures is below 0.75, the maximum correlation would be below 0.75. Note that the correlations between HUI Mark 2 and HUI Mark 3 are inflated because some of the same questions were used to create both scores. It is also important to note that cross sectional correlations do not necessarily predict correlations in longitudinal change scores [34, 35].
Although PROPr scores correlate well with EQ-5D and HUI scores, PROPr scores are generally lower than corresponding EQ-5D, HUI2, and HUI3 scores. We expected PROPr scores to be lower than these legacy measures because the best possible health state described in PROPr is qualitatively much better than the best health state described in legacy measures. For example, the highest physical functioning level in PROPr is “able to dress yourself, including tying shoelaces and buttoning up your clothes without any difficulty and able to run 100 yards (100 m) without any difficulty.” In contrast, the highest physical functioning level in the EQ-5D is “I have no problems walking,” and in the HUI Mark 3, “I have full use of 2 hands and 10 fingers and I am able to walk around the neighbourhood without difficulty, and without walking equipment.” The increase in the effective range of measurement of PROPr “raises the bar” to reach a best-health score of 1.0. As a result, ceiling effects in the general population are less common and mean and median scores are substantially lower with PROPr relative to legacy measures. Another explanation of this finding is that PROPr scores analyzed in this report were collected using at least 32 questions, which provides respondents more opportunities to report not-best health status when compared with the other questionnaires (e.g., there are only 5 questions scored for the EQ-5D).
The PROPr scoring system was constructed using the input of experts in IRT-based health profile measurement and preference measurement, as well as the guidance of community members. The final scoring algorithm was estimated using multi-attribute utility theory and was based on preference data from a large representative sample of the US noninstitutionalized population. PROPr is the first score to link single-attribute utility functions to health domains as measured by IRT. As such, PROPr gains the advantages of an IRT-based descriptive system, including flexible administration of items from the 7 item banks used to construct PROPr and finer granularity of its utility scale than those produced by other scoring systems.
The patterns of age- and gender-stratified means in preference-based summary scores for these samples did not match the patterns seen in representatively sampled surveys such as the Medical Expenditures Panel Survey [31, 36]. In particular, males had lower mean scores than females in several age strata and the association between age group and mean score was not monotonic. These differences suggest that the samples used in this report, while drawn from the general US population, are not representative of the general US population. Thus, the reported mean values should not be used as national normative values [37]. Likewise, the health condition impact estimates may not be fully applicable to other studies.
Even though all scores used in this study have different possible score ranges, all are anchored with “dead” anchored at 0 and “full health” anchored at 1.0 and are as a rule not re-scaled for use in cost-utility analyses. PROPr had lower mean scores than the EQ-5D-5, HUI2, or HUI3, but the condition impact measured by PROPr had a similar magnitude to the HUI3 in the PROPr Estimation survey and the HUI2 in the Profiles-HUI survey. That different health utility measures provide different estimates for both cross-sectional differences between groups and longitudinal change within groups has been observed in several other studies [31, 34, 35]. Comparisons of disease impact across surveys, despite collecting some of the same self-reported disease statuses, is limited because disease severity was not measured and there may be differences in disease severity or symptom status. The estimated impact of the chronic conditions was both in the expected direction (the group with a condition has a lower mean than the group without that condition) and statistically significant. Future work will be needed to establish thresholds for a clinically meaningful difference in PROPr scores, as these also differ among preference-based scores.
Conclusion
The findings presented in this report provide evidence of construct validity for PROPr–it is correlated with other widely used generic preference-based summary scores and those with chronic illness have lower scores than those without the illness. Future work is needed to collect PROPr scores from a nationally representative sample, create crosswalks to legacy measures, and validate PROPr using longitudinal data collection.
Acknowledgments
We would like to extend our thanks to the participants in these surveys without whom this work would not be possible. We also acknowledge the constructive comments provided by two reviewers.
Data Availability
All data files are available from the Open Science Framework (https://osf.io/t896p/) and (Dataverse: https://dataverse.harvard.edu/dataset.xhtml?persistentId=doi:10.7910/DVN/P7UKWR).
Funding Statement
Janel Hanmer was supported by the National Institutes of Health through Grant Number KL2 TR001856. Data collection was supported by the National Institutes of Health through Grant Number UL1TR000005. Barry Dewitt was partially supported by a Social Sciences and Humanities Research Council of Canada Doctoral Fellowship. David Cella, Ron D. Hays, Paul A. Pilkonis, and Dennis A. Revicki were supported by a grant from the National Cancer Institute Number 1U2C-CA186878-01 and a supplement to the PROMIS statistical center grant Number 3U54AR057951-04S4. Baruch Fischhoff was partially supported by the Swedish Foundation for the Humanities and Social Sciences. The funding agreements ensured the authors’ independence in designing the study, interpreting the data, writing, and publishing the report. Evidera, Inc provided support in the form of salary for Dennis Revicki, but did not have any additional role in the study design, data collection and analysis, decision to publish, or preparation of the manuscript. The specific roles of these authors are articulated in the ‘author contributions’ section.
References
- 1.McHorney CA. Health status assessment methods for adults: past accomplishments and future challenges. Annual review of public health. 1999. May;20(1):309–35. [DOI] [PubMed] [Google Scholar]
- 2.Wilson IB, Cleary PD. Linking clinical variables with health-related quality of life: a conceptual model of patient outcomes. Jama. 1995. January 4;273(1):59–65. [PubMed] [Google Scholar]
- 3.McDowell I. Measuring health: a guide to rating scales and questionnaires. Oxford university press; 2006. March 9. [Google Scholar]
- 4.Tengs TO, Wallace A. One thousand health-related quality-of-life estimates. Medical care. 2000. June 1:583–637. [DOI] [PubMed] [Google Scholar]
- 5.Hanmer J, Cherepanov D, Palta M, Kaplan RM, Feeny D, Fryback DG. Health condition impacts in a nationally representative cross-sectional survey vary substantially by preference-based health index. Medical Decision Making. 2016. February;36(2):264–74. 10.1177/0272989X15599546 [DOI] [PMC free article] [PubMed] [Google Scholar]
- 6.Torrance GW. Measurement of health state utilities for economic appraisal: a review. Journal of health economics. 1986. March 1;5(1):1–30. [DOI] [PubMed] [Google Scholar]
- 7.Drummond MF, Sculpher MJ, Claxton K, Stoddart GL, Torrance GW. Methods for the economic evaluation of health care programmes. Oxford university press; 2015. September 24. [Google Scholar]
- 8.Neumann PJ, Sanders GD, Russell LB, Siegel JE, Ganiats TG, editors. Cost-effectiveness in health and medicine. Oxford University Press; 2017. October 3. [Google Scholar]
- 9.Brooks R, Rabin R, De Charro F, editors. The measurement and valuation of health status using EQ-5D: a European perspective: evidence from the EuroQol BIOMED Research Programme. Springer Science & Business Media; 2013. March 9. [Google Scholar]
- 10.Feeny D, Furlong W, Torrance GW, Goldsmith CH, Zhu Z, DePauw S, et al. Multiattribute and single‐attribute utility functions for the health utilities index mark 3 system. Medical care. 2002. February 1;40(2):113–28. [DOI] [PubMed] [Google Scholar]
- 11.Feeny D., Torrance G., Furlong W. Health Utilities Index Chapter 26 In Bert Spilker, ed. Quality of Life and Pharmacoeconomics in Clinical Trials. Second Edition Philadelphia: Lippincott-Raven Press, 1996, pp 239–252. [Google Scholar]
- 12.Brazier JE, Roberts J. The estimation of a preference-based measure of health from the SF-12. Medical care. 2004. September 1;42(9):851–9. [DOI] [PubMed] [Google Scholar]
- 13.Kaplan RM, Anderson JP. A general health policy model: update and applications. Health services research. 1988. June;23(2):203 [PMC free article] [PubMed] [Google Scholar]
- 14.Hanmer J, Feeny D, Fischhoff B, Hays RD, Hess R, Pilkonis PA, et al. The PROMIS of QALYs. Health and quality of life outcomes. 2015. August 11;13(1):122. [DOI] [PMC free article] [PubMed] [Google Scholar]
- 15.Embretson SE, Reise SP. Item response theory. Psychology Press; 2013. September 5. [Google Scholar]
- 16.Cella D, Yount S, Rothrock N, Gershon R, Cook K, Reeve B, et al. The Patient-Reported Outcomes Measurement Information System (PROMIS): progress of an NIH Roadmap cooperative group during its first two years. Medical care. 2007. May;45(5 Suppl 1):S3. [DOI] [PMC free article] [PubMed] [Google Scholar]
- 17.Cella D, Riley W, Stone A, Rothrock N, Reeve B, Yount S, et al. The Patient-Reported Outcomes Measurement Information System (PROMIS) developed and tested its first wave of adult self-reported health outcome item banks: 2005–2008. Journal of clinical epidemiology. 2010. November 30;63(11):1179–94. 10.1016/j.jclinepi.2010.04.011 [DOI] [PMC free article] [PubMed] [Google Scholar]
- 18.Hanmer J, Cella D, Feeny D, Fischhoff B, Hays RD, Hess R, et al. Selection of key health domains from PROMIS for a generic preference-based scoring system. Quality of Life Research. 2017. December 1;26(12):3377–85. 10.1007/s11136-017-1686-2 [DOI] [PMC free article] [PubMed] [Google Scholar]
- 19.Hanmer J, Cella D, Feeny D, Fischhoff B, Hays RD, Hess R, et al. Evaluation of options for presenting health-states from PROMIS item banks for valuation exercises. Quality of Life Research. 2018. April 12:1–9. [epub ahead of print] [DOI] [PMC free article] [PubMed] [Google Scholar]
- 20.Dewitt B, Cella D, Feeny D, Fischhoff B, Hays RD, Hess R, et al. Estimation of a Preference-Based Summary Score for the Patient-Reported Outcomes Measurement Information System: The PROMIS-Preference (PROPr) Scoring System. Medical Decision Making. 2018. June 26:1–9 [epub ahead of print] [DOI] [PMC free article] [PubMed] [Google Scholar]
- 21.Available from: http://janelhanmer.pitt.edu/ProPr.html Cited March 21, 2018.
- 22.Available from: https://osf.io/t896p/ Cited March 21, 2018.
- 23.Available from: https://dataverse.harvard.edu/dataset.xhtml?persistentId=doi:10.7910/DVN/P7UKWR Cited March 21, 2018.
- 24.Available from: https://www.cdc.gov/nchs/nhis/nhis_questionnaires.htm Cited March 21, 2018.
- 25.Gershon RC, Rothrock N, Hanrahan R, Bass M, Cella D. The use of PROMIS and assessment center to deliver patient-reported outcome measures in clinical research. Journal of applied measurement. 2010;11(3):304 [PMC free article] [PubMed] [Google Scholar]
- 26.Herdman M, Gudex C, Lloyd A, Janssen MF, Kind P, Parkin D, et al. Development and preliminary testing of the new five-level version of EQ-5D (EQ-5D-5L). Quality of life research. 2011. December 1;20(10):1727–36. 10.1007/s11136-011-9903-x [DOI] [PMC free article] [PubMed] [Google Scholar]
- 27.Available from: https://www.economicsnetwork.ac.uk/health/EQ_5D_index_calculator.xls Cited March 21, 2018.
- 28.Available from: https://www.census.gov/2010census/ Cited March 21, 2018.
- 29.Available from: https://www.cdc.gov/nchs/nhis/nhis_2016_data_release.htm Cited March 21, 2018.
- 30.Hanmer J, Lawrence WF, Anderson JP, Kaplan RM, Fryback DG. Report of nationally representative values for the noninstitutionalized US adult population for 7 health-related quality-of-life scores. Medical Decision Making. 2006. July;26(4):391–400. 10.1177/0272989X06290497 [DOI] [PubMed] [Google Scholar]
- 31.Fryback DG, Dunham NC, Palta M, Hanmer J, Buechner J, Cherepanov D, et al. US norms for six generic health-related quality-of-life indexes from the National Health Measurement study. Medical care. 2007. December;45(12):1162 10.1097/MLR.0b013e31814848f1 [DOI] [PMC free article] [PubMed] [Google Scholar]
- 32.Hanmer J, Hays RD, Fryback DG. Mode of administration is important in US national estimates of health-related quality of life. Medical care. 2007. December 1;45(12):1171–9. 10.1097/MLR.0b013e3181354828 [DOI] [PubMed] [Google Scholar]
- 33.McDowell I. Measuring health: a guide to rating scales and questionnaires. Oxford University Press, USA: 2006) [Google Scholar]
- 34.Kaplan RM, Tally S, Hays RD, Feeny D, Ganiats TG, Palta M, et al. Five preference-based indexes in cataract and heart failure patients were not equally responsive to change. Journal of clinical epidemiology. 2011. May 1;64(5):497–506. 10.1016/j.jclinepi.2010.04.010 [DOI] [PMC free article] [PubMed] [Google Scholar]
- 35.Feeny D, Spritzer K, Hays RD, Liu H, Ganiats TG, Kaplan RM, et al. Agreement about identifying patients who change over time: cautionary results in cataract and heart failure patients. Medical Decision Making. 2012. March;32(2):273–86. 10.1177/0272989X11418671 [DOI] [PMC free article] [PubMed] [Google Scholar]
- 36.Hanmer J, Kaplan RM. Update to the Report of Nationally Representative Values for the Noninstitutionalized US Adult Population for Five Health-Related Quality-of-Life Scores. Value in Health. 2016. December 31;19(8):1059–62. 10.1016/j.jval.2016.05.019 [DOI] [PMC free article] [PubMed] [Google Scholar]
- 37.Liu H, Cella D, Gershon R, Shen J, Morales LS, Riley W, et al. Representativeness of the patient-reported outcomes measurement information system internet panel. Journal of clinical epidemiology. 2010. November 30;63(11):1169–78. 10.1016/j.jclinepi.2009.11.021 [DOI] [PMC free article] [PubMed] [Google Scholar]
Associated Data
This section collects any data citations, data availability statements, or supplementary materials included in this article.
Data Availability Statement
All data files are available from the Open Science Framework (https://osf.io/t896p/) and (Dataverse: https://dataverse.harvard.edu/dataset.xhtml?persistentId=doi:10.7910/DVN/P7UKWR).


