Abstract
Purpose
To evaluate a CT structural analysis protocol (SAP) for estimating the strength of human female cadaveric spines with lytic lesions.
Materials and Methods
Osteolytic foci was created in the middle vertebra of 44 thoracic and lumbar three-level segments from 11 female cadavers (age range, 50–70 years). The segments underwent CT by using standard clinical protocol and their failure strength was assessed at CT SAP. The spines were mechanically tested to failure in pure axial compression or in compression with torsion. The relationships of defect size, bone mineral density, and predicted failure load (at CT SAP) with measured vertebral strength were assessed with linear regression. Analysis of variance and Tukey test were used to evaluate the effect of region and mechanical test on spine strength.
Results
With axial compression, CT SAP predictions of vertebral strength correlated with the thoracic (r = 0.84; P < .001) and lumbar (r = 0.85; P < .001) segment–measured strength. Bone mineral density correlated with the lumbar (r = 0.64; P = .003) and thoracic (r, 0.51; P = .050) strength. At compression with torsion, CT SAP predictions of strength were moderately correlated with vertebral strength (r = 0.66; P = .018). At compression with torsion, bone mineral density was not correlated with spinal strength (thoracic and lumbar: r = 0.31 and r = 0.26, respectively; P = .539 and .610, respectively). The lytic focus size (range, 28%–41%) was not associated with vertebral strength.
Conclusion
CT SAP assessment of strength in vertebrae with lytic lesions correlated with the measured strength of female vertebral bodies.
© RSNA, 2018
Introduction
Nearly half of all cancers metastasize to bone (1), and the spinal column is the most common site of involvement (2). There are more than 300 000 adult patients currently living in the United States with spinal bone metastasis (3). Lytic metastases reduce vertebral strength (4), and up to 30% of the affected vertebrae undergo fracture with minimal trauma (5). Pathologic vertebral fractures because of vertebral bone metastasis cause pain, immobility, neurologic deficits, and complications that may be fatal (4,6). Thus, vertebral bone metastasis and the risk of pathologic vertebral fractures are critical concerns in the treatment of patients with cancer (7).
With daily loading, the risk of fracture for vertebrae with lytic metastases ultimately depends on the degree of destruction of vertebral structures (8,9), loading patterns, and comorbid disease. Indications for treatment in spinal metastatic disease depend on estimates of risk of mechanical instability. The Spinal Instability Neoplastic Score (10) categorizes risk on the basis of vertebral level, pain, bone quality (ie, lytic, mixed, or blastic), spinal alignment, presence of collapsed vertebral body, and posterolateral spinal element involvement. However, to our knowledge, its prognostic utility in predicting pathologic vertebral fracture remains controversial (11). Although Spinal Instability Neoplastic Score overall is useful and reliable, the subjective bone quality assessment was reported to have poor reproducibility (10).
This study investigated the application of CT structural analysis protocol (SAP) to predict the effect of simulated lytic focus on the strength of female human cadaveric spine segments. Therefore, we used spine specimens from cadavers of the ages at which these bone metastases are most common. Strength was measured with axial compression (AC) or AC with torsion (ACT) loading applied about the vertical axis of the spine. We hypothesized that CT SAP–predicted strength has significantly higher correlation with the strength of vertebrae containing lytic foci than do measures based on defect characteristics or bone mineral density (BMD) alone. We further hypothesized that this superior prediction is independent of the location of the lytic focus, applied load, or spinal region.
Materials and Methods
Eleven thoracolumbar spines, obtained fresh-frozen from female cadavers (age range, 50–70 years), were prepared for this study (Appendix E1 [online]). These spines were institutional review board–exempt, deidentified cadaver material. Further details on cadaver characteristics are in Table 1. Each spine was scanned at CT before and after creation of vertebral defects (Appendix E1 [online]). The spines were divided into three-level motion units (T6–T8, T9–T11, T12–L2, and L3–L5) for a total of 44 thoracic, thoracolumbar, and lumbar spinal units.
Table 1:
Details of Specimen Characteristics, Bone Density, Characteristics of Lytic Focus, and Mechanical Tests Employed and the Measured and Predicted Vertebral Strength Values
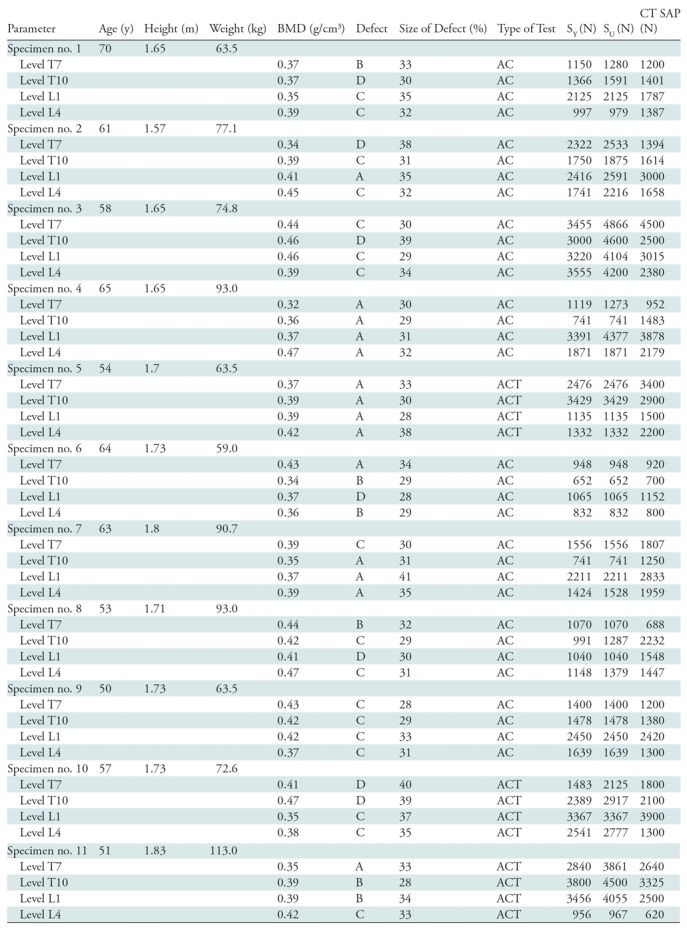
Note.—For defect type, see Figure 2. AC = axial compression, ACT = axial compression and torsion, BMD = bone mineral density, SAP = structural analysis protocol, SU = ultimate strength, SY = yield strength.
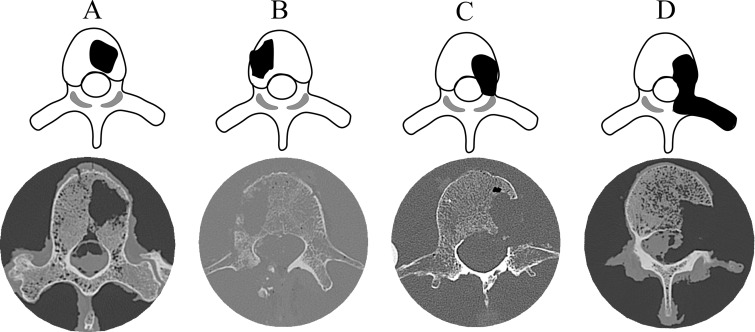
Each spine segment was assigned to either AC (32 segments) or compression with 3-Nm torsion ACT test (12 segments), with care taken to ensure the two test groups included equal distribution of BMD values. Details regarding the test procedures are in Appendix E1 (online). Taneichi et al (8) presented a systematic classification for lytic defects of the thoracic and lumbar spine as those affecting the anterior column alone, the additional involvement of the middle column, or affecting all three columns. For this study, we chose four defect patterns of increasing severity (Fig 2 ). Creation of the defects is described in Appendix E1 (online). The CT image that had the largest lytic focus cross-sectional area within the vertebral body was used to compute the defect size measure (Table 1).
Figure 2:
Illustrated axial views (top) and axial CT images (bottom) show the location and extent of the four lytic focus models used (top) and corresponding CT images of the model-created cross section (bottom). Type A involves approximately 30% of the vertebral body cross-section. Type B is type A with the destruction of the vertebral cortex adjacent to the defect. Type C is type A with the destruction of the pedicle. Type D is type C and the destruction of the facet and, for the thoracic spines, the destruction of the costovertebral joint.
Figure 1a:
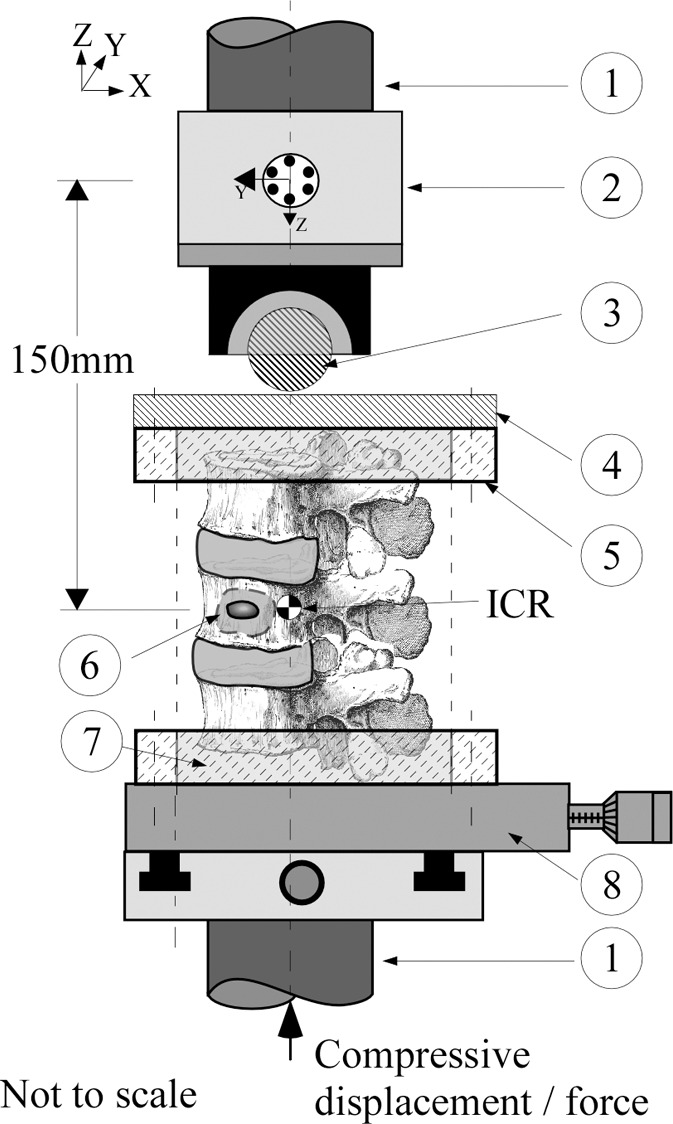
A schematic diagram of the mechanical testing devices used for the (a) compression and (b) compression + 3 (Nm) torsion tests. The bottom vertebrae was embedded in polymethylmethacrylate cement (7) and secured via lock rings (5) to a mechanical X–Y stage (8) to allow aligning of the spine’s center of rotation (ICR) with the hydraulic test system (1) long axis. (a) Compression test allowed compressive loading with minimum constraints to the deforming spine under the applied load; a steel ball and socket joint (3) was used, located at the bottom of a six degree-of-freedom (6DOF) load cell (model MC5-5000, Advanced Mechanical Technology, Watertown, Mass; 2), which was secured to the upper crosshead of the hydraulic test system (1). This joint was joined to a steel platen (4) secured to the polymethylmethacrylate embedded top vertebrae via second lock ring (5), which formed a rolling interface that resulted in the compressive vector being perpendicular to the plane of the deforming spine. (b) Torsion test allowed combined torsion and compression; a sliding X-Y stage (10), which provided alignment of the spine, was fitted to the bottom of the load cell and connected to top vertebrae via a universal joint (9). This arrangement allowed a constant torque value to be applied to the freely deforming spine under increasing magnitude of compressive loading.
Figure 1b:
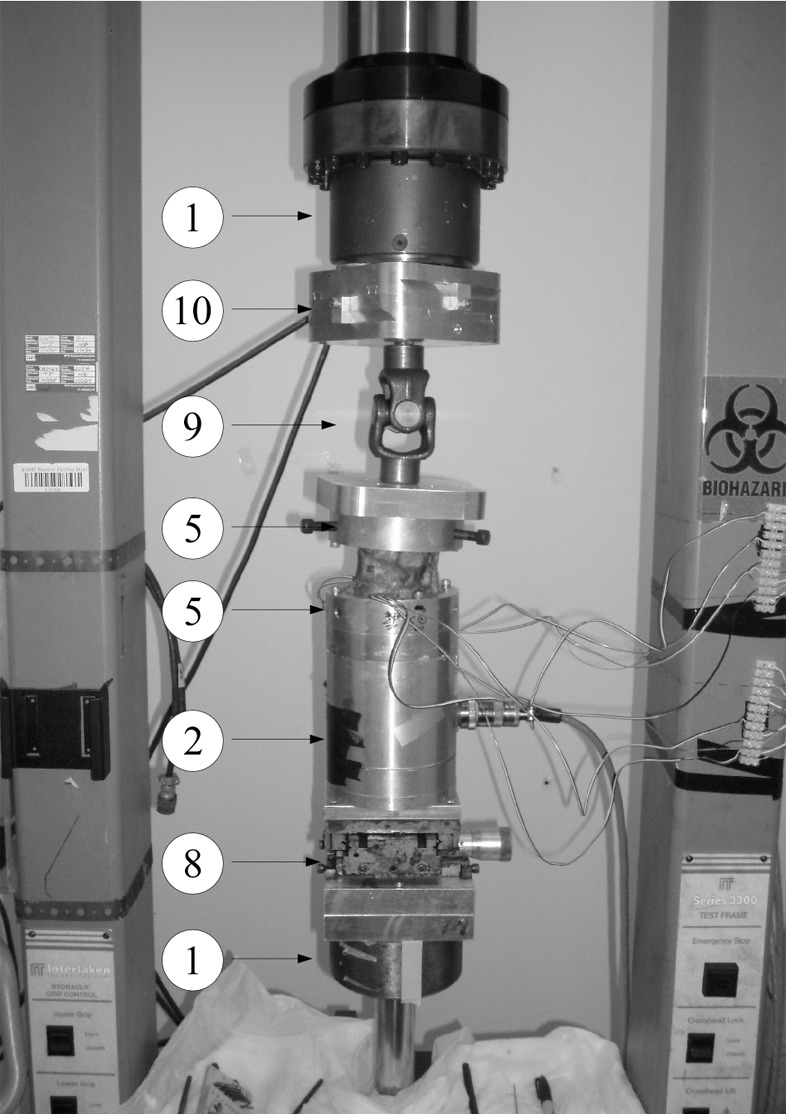
A schematic diagram of the mechanical testing devices used for the (a) compression and (b) compression + 3 (Nm) torsion tests. The bottom vertebrae was embedded in polymethylmethacrylate cement (7) and secured via lock rings (5) to a mechanical X–Y stage (8) to allow aligning of the spine’s center of rotation (ICR) with the hydraulic test system (1) long axis. (a) Compression test allowed compressive loading with minimum constraints to the deforming spine under the applied load; a steel ball and socket joint (3) was used, located at the bottom of a six degree-of-freedom (6DOF) load cell (model MC5-5000, Advanced Mechanical Technology, Watertown, Mass; 2), which was secured to the upper crosshead of the hydraulic test system (1). This joint was joined to a steel platen (4) secured to the polymethylmethacrylate embedded top vertebrae via second lock ring (5), which formed a rolling interface that resulted in the compressive vector being perpendicular to the plane of the deforming spine. (b) Torsion test allowed combined torsion and compression; a sliding X-Y stage (10), which provided alignment of the spine, was fitted to the bottom of the load cell and connected to top vertebrae via a universal joint (9). This arrangement allowed a constant torque value to be applied to the freely deforming spine under increasing magnitude of compressive loading.
By applying the standard protocol of Lang et al (12), vertebral BMD was computed for each vertebral body (Appendix E1 [online]).
For our quantitative CT SAP, the geometry of each vertebral level was segmented from the CT data set followed by segmentation of the cortical and trabecular bone compartments. A detailed description of the methodologic analysis is provided in Appendix E1 (online). We determined the vertebral axial, bending, and torsional rigidity as described in Appendix E1 (online). In the context of predicting pathologic vertebral strength, failure occurs when the combination of loads and moments exceeds the structural capacity of its weakest cross section (13,14). The outcome of our analysis was a threshold value for the strength of the vertebra.
Statistical Analysis
Analysis of variance was used to test for effect of applied test (AC vs ACT) and spine region (lumbar vs thoracic) on failure strength. The Tukey test was used for posttest comparisons (15). Univariate linear regression analysis was performed to determine the association of lytic focus size (in percent), BMD (in grams per cubed centimeter), and CT SAP (in Newtons) predicted failure load with observed failure strength (in Newtons). Grouping covariates were test (AC vs ACT) and spinal region (lumbar vs thoracic). Statistical analysis was performed by using software (JMP v.11; SAS, Durham, NC), and a P value of less than .05 indicated statistical significance.
Results
Specimen information and experimental and image-derived parameters are presented in Table 1. For the regression models, lower and upper 95% confidence intervals are reported.
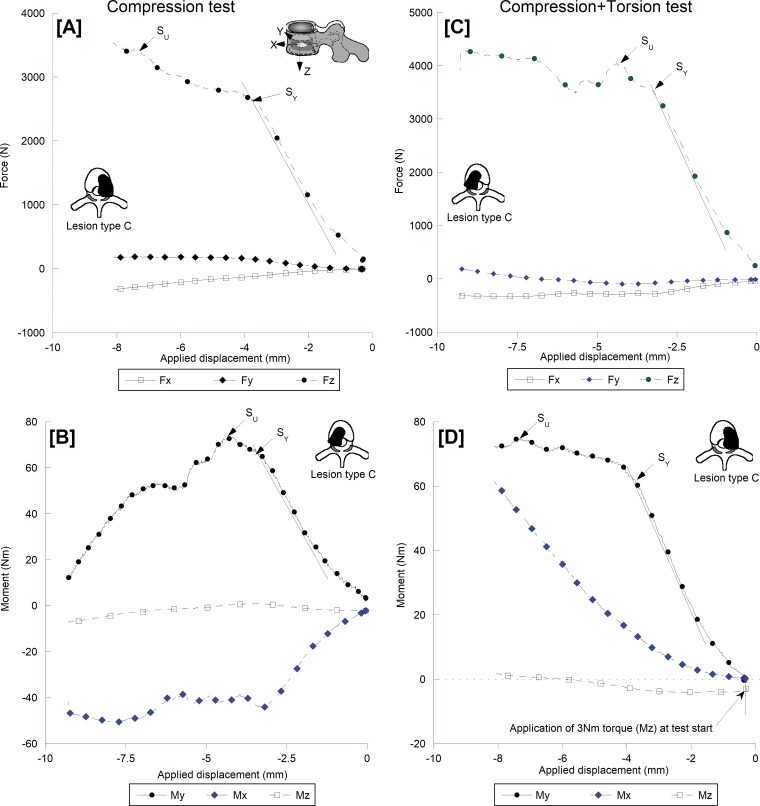
Figure 3 presents the force- and moment-displacement curves for matching spine levels at AC or ACT tests. At AC, the compressive force response showed distinct yield and ultimate strength (SU) events (Fig 3, A) with the forward moment (flexion; Fig 3, B) dominating the moment response of the spine. There was a high degree of lateral bending moment with its SU corresponding to the yield point of the spines in forward moment. The addition of torsional moment (ie, ACT) caused a more protracted after-yield response for both force response (Fig 3, C) and forward moment (Fig 3, D) curves and the development of sagittal and coronal shear forces (Fig 3, C). There was no defined yield or SU event for the lateral bending moment (Fig 3, D). All of the spines that we tested failed by initial buckling of the lytic vertebra cortex followed by collapse of the body. Posttest fluoroscopic imaging showed the fractures analogous to those clinically reported (16).
Figure 3:
Force and moment displacement curves illustrating the structural behavior of a type C lytic spine in response to, A and B, compression and, C and D, compression with 3-Nm torque loading. The addition of torque yielded results in marked alteration of the lateral bending response and higher sagittal and lateral shear forces likely underlie the segment lower compressive strength, C, compared with the compressive test, A. Fx = shear force response in the sagittal plane, Fy = shear force response in the coronal plane, Fz = axial compression response sagittal plane, Mx = moment response in the coronal plane (lateral bending), My = moment response in the sagittal plane (forward bending), Mz = torsional moment response.
For AC and ACT loading modes, defect pattern significantly affected SU (P = .047 and P = .033 respectively; Fig 2, Table 2). At AC, Tukey posttest comparisons showed pattern B (Table 2) to have exhibited the lowest SU, and the difference of pattern B versus pattern C was significant (P = .045). At ACT, pattern D showed the lowest SU, and the difference of pattern D versus pattern B was significant (P = .050; Table 2).
Table 2:
Descriptive Statistics of the Spine-measured Failure Strength for Defect Pattern and Spinal Region

Data.—Data are mean compressive failure load in Newtons ± standard deviation. Please see the defect pattern shown in Figure 1. AC = axial compression, ACT = axial compression and torsion.
Compared with the thoracic spines, the lumbar spines showed higher SU at AC (mean difference, 22%; Table 2) and lower SU at ACT (mean difference, 43%; Table 2). These differences were not statistically significant (P = .383 and P = .242, respectively). Within-region comparisons showed that the addition of torsional loading resulted in a statistically significant increase in SU for the thoracic segments (mean difference, 75%; P = .03; Table 2), whereas the lumbar segments showed a 5% reduction in mean SU (P = .851).
The relative cross-sectional area of the defect in the vertebral body was mean 31.8% ± 3.1 (standard deviation) for the AC- tested spines and 34% ± 4.0 for those tested at ACT. For both test modes, the cross-sectional area of the lytic focus was not correlated with vertebral SU (AC: r, 0.27 [95% confidence interval: −0.882, 0.573]; ACT: r, −0.36 [95% confidence interval: −0.776, 0.265]; Table 3).
Table 3:
Regression Parameters for BMD- and CT SAP–predicted Vertebral Strength and the Measured Ultimate Strength of the Lytic Focus Spines
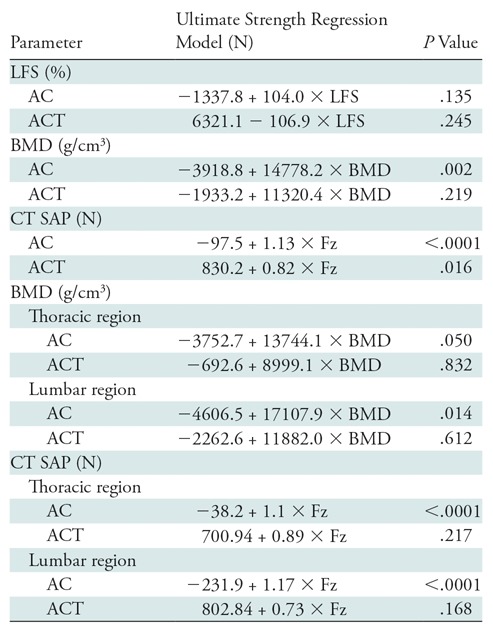
Note.—AC = axial compression test, ACT = axial compression and torsion test, BMD = bone mineral density, Fz = vertebral strength predicted at CT structural analysis protocol (SAP) analysis (in Newton), LFS = lytic foci size.
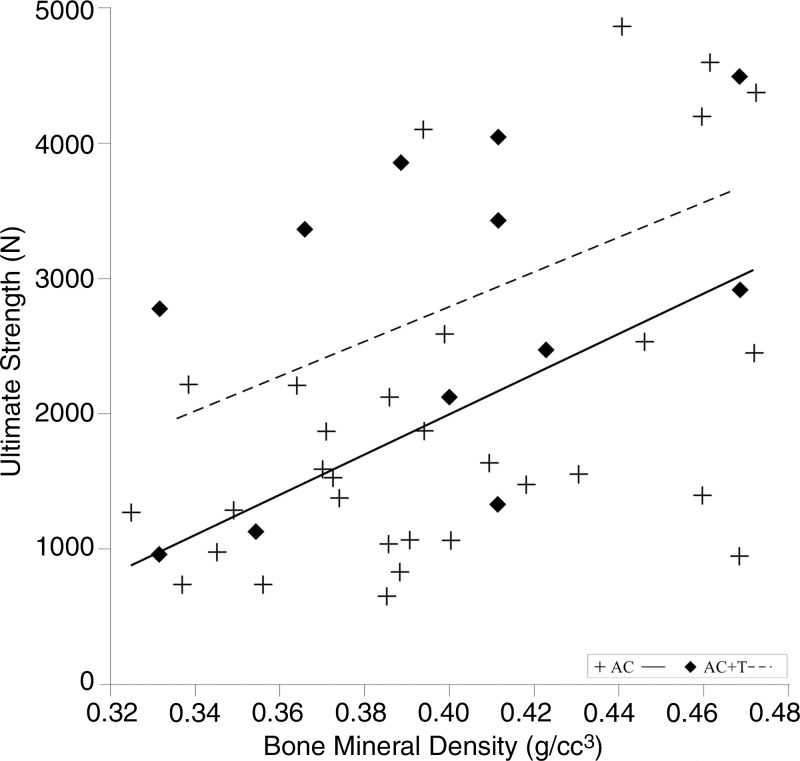
At AC, BMD positively correlated with SU (r, 0.53; 95% confidence interval: 0.215, 0.744) for all segments (Fig 4). The relationships were similar for the lumbar (r, 0.59; 95% confidence interval: 0.148, 0.845) and for the thoracic spines (r, 0.51; 95% confidence interval: −0.003, 0.811) (Table 3). At ACT, BMD was not correlated with SU (r, 0.38; 95% confidence interval: −0.244, 0.785; Fig 4). The correlation was not significant for the thoracic (r, 0.11; 95% confidence interval: −0.769, 0.847) or the lumbar spines (r, 0.26; 95% confidence interval: −0.696, 0.886; Table 3).
Figure 4:
Plot shows that bone mineral density was positively correlated with the lytic spine–measured strength for compression (P = .002). AC = axial compression, AC+T = axial compression with torsion.
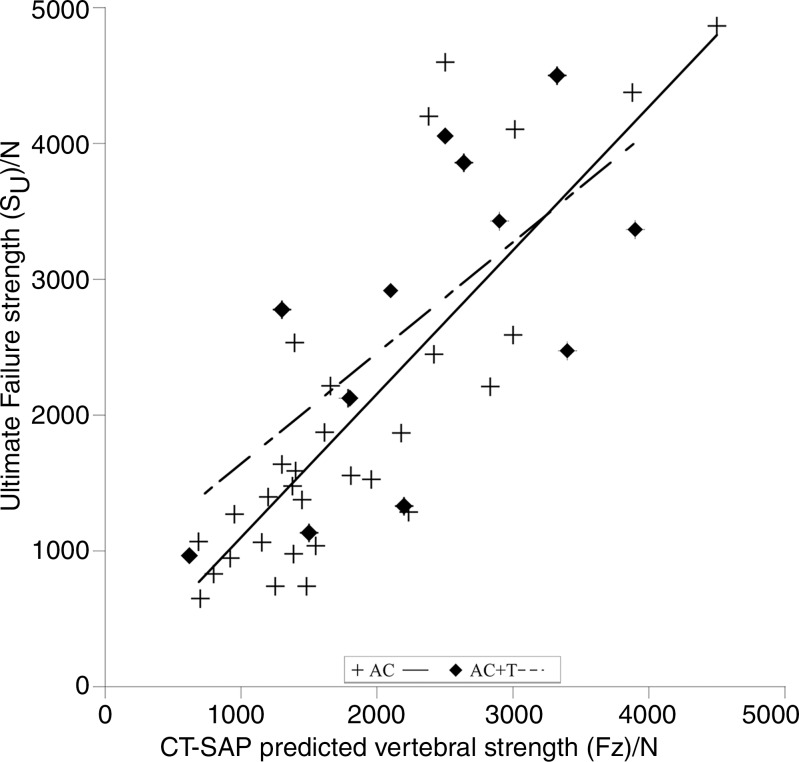
At AC, the predicted failure load (CT SAP) was strongly correlated with measured SU (Fig 5), and both thoracic and lumbar spines showed strong correlations (thoracic: r, 0.84 [95% confidence interval: 0.551, 0.939]; lumbar: r, 0.85 [95% confidence interval: 0.582, 0.942]) (Table 3). At ACT, the CT SAP helped to predict failure load and was moderately correlated with SU (r, 0.67; 95% confidence interval: 0.164, 0.900; Fig 5). Defect pattern significantly affected CT SAP strength predictions for the AC test (P = .047), but not for the ACT test (P = .31).
Figure 5:
Plot shows that CT structural analysis protocol (SAP)–predicted strength was positively and strongly correlated with the lytic spine–measured strength for the axial compression (AC) test (P < .0001) and was moderately correlated for the AC with torsion (AC+T) (P = .016) test.
Discussion
The spinal column is the most common site of bone metastasis (2), with the risk of pathologic vertebral fractures because of vertebral metastases a critical concern in the treatment of patients with cancer (7). Lytic metastasis significantly reduces the strength of the vertebra (4), and up to 30% of the affected vertebrae fracture with minimal trauma (5). However, current clinical methods for estimating fracture risk have limited reliability, to our knowledge (17). Although the Spinal Instability Neoplastic Score (10) is widely used for surgical decision making and fracture risk assessment, its prognostic value for assessing pathologic vertebral fracture remains controversial, as discussed by Versteeg et al (11). The Spinal Instability Neoplastic Score imaging assessment of bone quality showed poor interobserver agreement when applied by the group that developed the measure (Fleiss κ, 0.244 [10]). A purely radiographic model to assess the probability of impending pathologic vertebral fracture (8) was 100% sensitive but 20% specific in predicting fractures in a cohort of 1024 patients with breast cancer (18). Thus, fracture risk assessment remains imprecise, and errors have serious clinical implications.
Clinically, lytic focus size and geometry are the most often used radiographic predictors of risk of pathologic vertebral fracture (19). However, approximately 50%–75% of the vertebral bone is missing before the lytic focus can be detected on radiographs, corresponding to a 50%–90% reduction in bone strength (18). At this range of lytic defects, defect size was reported to account for less than 50% of the variation in vertebral strength (20,21). Our data showed no statistically significant association between lytic focus size and vertebral strength over the range of defect sizes studied. This result may have been affected by the relatively small variation in defect size (28%–41%) of the vertebral body cross-sectional area, which was created by design in our study. Previous reports showed lytic focus size not to be prognostic of pathologic vertebral fracture in patients with osteolytic bone metastasis (22) or for spine motion units with large solitary lytic focus in vitro (23). Our results appear to support the finding that lytic foci size may not be a reliable predictor of the vertebral fracture threshold within the range of sizes that pose clinical challenges.
BMD, which to our knowledge is the most studied determinant of bone strength in vivo (24), reportedly explains 60%–75% of the measured variability in the compressive stiffness and strength of normal human trabecular bone (25). Although our study shows BMD to be more strongly correlated with vertebral strength with compressive loading than lytic focus size, in agreement with the study of Whealan et al (23), the correlation was significantly lower than that observed at the CT SAP computed vertebral strength. Inherently a single scalar value, the measure of BMD does not reflect the complex and highly porous architecture of trabecular bone (26). Importantly, it cannot account for the effect of defect geometry on change in the spatial contribution of the trabecular bone (27), vertebral cortex, and geometry (28) to vertebral strength. The latter can be observed from the low correlation with vertebral strength with the more realistic ACT tests. Metastases and their treatments (radiation therapy and/or chemotherapy) produce extensive alterations of the architecture and material properties of the bone itself. These are not captured by BMD measurement. Combined, these reasons may explain the disappointing results for the application of the Fracture Risk Assessment Tool prediction algorithm to help predict fractures in patients with breast (29) and prostate (30) cancers. Although lytic focus size and BMD measures are easy to use clinically, our results suggest they have limited value for fracture risk prediction.
Osteolytic defects cause remarkable degradation in the structural competence of the vertebra (9,31), which may result in the vertebra undergoing a sudden and often catastrophic collapse under daily loads (32). In vitro, osteolytic models of vertebral bone (14,33) and whole vertebrae (23,34) demonstrated bone strength to be strongly correlated with CT-derived measures of axial, bending, and torsional rigidity. In our study, the selection of the lowest CT SAP–estimated value of vertebral strength within the analyzed vertebral volume showed strong correlation with measured vertebral strength. This finding was in agreement with previous studies showing CT-derived axial rigidity to be highly correlated with the measured strength of thoracic and lumbar vertebrae with simulated (23,34,35) and actual (35) vertebral lytic foci. Our study demonstrated the degree of destruction of vertebral structures simulated by the four defect patterns to affect both the measured compressive strength of the spines and the regressions between the predicted and measured strength. Whealan et al (23) reported the pattern in similar findings for spines tested with forward bending. In agreement with our study, location of lytic focus affected the correlation between the predicted and measured strength. These results confirm the importance of quantifying changes in axial (bone material properties) and moment (spatial distribution and geometry) in predicting spinal load carrying capacity.
Extending the tests to a combined axial and torsion loading (ie, ACT) yielded markedly lower correlations between CT SAP–based prediction and measured vertebral strength. Torsional loading was shown to increase the risk of fracture in spines that contained no evidence of metastases (36), and to result in the highest degree of vertebral bulging and maximum tensile stress at the posterior cortex. Both effects were associated with increased occurrence of fracture in spines with osteolytic metastases (37). Despite these reports, the effect of torsional loading on the failure of pathologic spines remains little understood, to our knowledge (36). It seems likely that purely axial loading is rare in vivo, where torsion is a typical feature both of spinal alignment and routine motion. The present lack of specific structural indexes within CT SAP to quantify the resulting loss of shear strength within the vertebral structures has likely contributed to the observed reduction in CT SAP assessment accuracy with this load condition. By using computational models of human spine segments (9), current work in our laboratory is aimed at deriving structural indexes for computing the effect of shear loading on the failure of vertebral bone. Development of such structural indexes will hopefully allow improved prediction of the effect of lytic bone defects on the failure of pathologic spines with functional loading in living humans.
We observed regional differences in the effect of torque on compressive strength, with increases in the thoracic spine, but decreases in the lumbar spines. We suggest that these differences to be the result local kinematic differences between these regions (38). In the thoracic spine, early engagement of the thoracic facet joints may provide a secondary load path with the posterior elements transmitting a higher portion of the axial loading, thus reducing the axial stress borne by the vertebral body (37). In the lumbar spine, facet orientation restricts torsional motions (38). This restriction may result in increased shear stresses within the vertebral body that ultimately may accelerate its failure.
Beyond the common drawbacks that occur in ex vivo biomechanical studies of the spine, our study has several limitations. The spines selected were from female cadavers (age range, 50–70 years) that were confirmed to be osteoporotic to mimic the condition typically found in older patients with breast cancer (39). Therefore, they do not fully reflect the demographic cohort of patients with metastatic disease, nor did they possess existing lytic metastases that would affect the vertebral bone architecture and material properties. At present, little is known about the effect of blastic and lytic metastases on the material properties of metastatic bone. Nazarian et al (40) suggested that the localized contribution of the material properties and spatial distribution of the trabecular bone may account for up to 84% of the variation in the strength of vertebral bone with blastic and lytic metastasis. This lends support to the method of structural analysis implemented at CT SAP. For the defect model, we elected to simulate a series of lytic defect patterns identified in a retrospective radiographic study (8) to pose a high risk of fracture in thoracic and lumbar vertebrae. Technically feasible in cadaveric models, the artificially created lytic foci possess sharp margins and cannot simulate the transition zone of varying density that is clinically observed, which may affect the failure process of the bone. Large solitary lytic foci only partially reproduce the in vivo presentation of lytic foci ranging from diffuse patterns (commonly observed, for example, in multiple myeloma) to single focus or multiple lytic foci (as often observed in cancers of the breast, kidney, and lung). Our simulated defects do not model blastic bone metastasis, as observed in prostate cancer, or mixed lytic and blastic bone pathologic structure often observed in metastatic disease of the spine. We took great care to standardize the mechanical test protocol and to achieve consistent boundary load conditions with minimum imposition of coupled moments during the test. However, the load applied and the lack of active muscle force resulted in a simplified pattern of loading compared with that likely to be imposed in daily living. Despite these limitations, our results clearly demonstrate the utility of computing the contribution of the material and geometric properties of the affected bone. This approach produced superior prediction compared with strength from BMD or defect size. A longitudinal clinical study will be required to determine whether the better performance demonstrated here translates to higher precision in predicting fractures in vivo.
In conclusion, CT SAP–based prediction of the strength of vertebrae containing lytic defects improved on prediction-based defect size and bone density. The effect of loading mode on the predictive accuracy of CT SAP suggested the need to better account for regional geometry with more realistic scenarios. This approach holds promise of more reliable risk assessment in the treatment of patients at risk for pathologic vertebral fractures.
Summary
By using computational structural analyses of quantitative CT, this study demonstrates that prediction of strength of female cadaveric spines with lytic defects improves upon the prediction on the basis of the measurement of lytic focus size and vertebral bone density.
Implications for Patient Care
■ Identification of female patients at the highest risk for pathologic vertebral fractures may lead to earlier treatment of lytic lesions.
■ The size of the spinal defect did not correlate with strength of the vertebral body.
■ A CT structural analysis protocol of the female spine showed that the predicted compressive strength was strongly correlated with resistance of the vertebral body to failure and compression.
APPENDIX
SUPPLEMENTAL FIGURES
Study supported by National Institute of Arthritis and Musculoskeletal and Skin Diseases (1R01AR055582-01A1).
Disclosures of Conflicts of Interest: R. Alkalay disclosed no relevant relationships. R. Adamson disclosed no relevant relationships. A.M. disclosed no relevant relationships. D.H. disclosed no relevant relationships.
Abbreviations:
- AC
- axial compression
- ACT
- AC with torsion
- BMD
- bone mineral density
- SAP
- structural analysis protocol
- SU
- ultimate strength
References
- 1.Riggs BL, Melton LJ, 3rd. The worldwide problem of osteoporosis: insights afforded by epidemiology. Bone 1995;17(5,Suppl):505S–511S 10.1016/8756-3282(95)00258-4. [DOI] [PubMed] [Google Scholar]
- 2.Galasko CSB. Incidence and distribution of skeletal metastases. In: Galasko CSB, ed. Skeletal Metastases. London, England: Butterworths, 1986; 14–21. [Google Scholar]
- 3.Li S, Peng Y, Weinhandl ED, et al. Estimated number of prevalent cases of metastatic bone disease in the US adult population. Clin Epidemiol 2012;4:87–93. [DOI] [PMC free article] [PubMed] [Google Scholar]
- 4.White AP, Kwon BK, Lindskog DM, Friedlaender GE, Grauer JN. Metastatic disease of the spine. J Am Acad Orthop Surg 2006;14(11):587–598. [DOI] [PubMed] [Google Scholar]
- 5.Whyne CM, Hu SS, Lotz JC. Parametric finite element analysis of vertebral bodies affected by tumors. J Biomech 2001;34(10):1317–1324. [DOI] [PubMed] [Google Scholar]
- 6.Hammerberg KW. Surgical treatment of metastatic spine disease. Spine 1992;17(10):1148–1153. [DOI] [PubMed] [Google Scholar]
- 7.Siegel R, DeSantis C, Virgo K, et al. Cancer treatment and survivorship statistics, 2012. CA Cancer J Clin 2012;62(4):220–241. [DOI] [PubMed] [Google Scholar]
- 8.Taneichi H, Kaneda K, Takeda N, Abumi K, Satoh S. Risk factors and probability of vertebral body collapse in metastases of the thoracic and lumbar spine. Spine 1997;22(3):239–245. [DOI] [PubMed] [Google Scholar]
- 9.Alkalay RN, Harrigan TP. Mechanical assessment of the effects of metastatic lytic defect on the structural response of human thoracolumbar spine. J Orthop Res 2016;34(10):1808–1819. [DOI] [PubMed] [Google Scholar]
- 10.Fourney DR, Frangou EM, Ryken TC, et al. Spinal instability neoplastic score: an analysis of reliability and validity from the spine oncology study group. J Clin Oncol 2011;29(22):3072–3077. [DOI] [PubMed] [Google Scholar]
- 11.Versteeg AL, Verlaan JJ, Sahgal A, et al. The spinal instability neoplastic score: Impact on oncologic decision-making. Spine 2016;41(Suppl 20):S231–S237. [DOI] [PubMed] [Google Scholar]
- 12.Lang TF, Li J, Harris ST, Genant HK. Assessment of vertebral bone mineral density using volumetric quantitative CT. J Comput Assist Tomogr 1999;23(1):130–137. [DOI] [PubMed] [Google Scholar]
- 13.Hipp JA, Springfield DS, Hayes WC. Predicting pathologic fracture risk in the management of metastatic bone defects. Clin Orthop Relat Res 1995;(312):120–135. [PubMed] [Google Scholar]
- 14.Hong J, Cabe GD, Tedrow JR, Hipp JA, Snyder BD. Failure of trabecular bone with simulated lytic defects can be predicted non-invasively by structural analysis. J Orthop Res 2004;22(3):479–486. [DOI] [PubMed] [Google Scholar]
- 15.Tukey JW. Comparing individual means in the analysis of variance. Biometrics 1949;5(2):99–114. [PubMed] [Google Scholar]
- 16.Schwarzenbach O, Boos N, Aebi M. Spinal metastases and metastasis-induced pathological fractures of the spine [in German]. Unfallchirurg 1990;93(10):457–466. [PubMed] [Google Scholar]
- 17.Sutcliffe P, Connock M, Shyangdan D, Court R, Kandala NB, Clarke A. A systematic review of evidence on malignant spinal metastases: natural history and technologies for identifying patients at high risk of vertebral fracture and spinal cord compression. Health Technol Assess 2013;17(42):1–274. [DOI] [PMC free article] [PubMed] [Google Scholar]
- 18.Snyder BD, Cordio MA, Nazarian A, et al. Noninvasive prediction of fracture risk in patients with metastatic cancer to the spine. Clin Cancer Res 2009;15(24):7676–7683. [DOI] [PubMed] [Google Scholar]
- 19.Tubiana-Hulin M. Incidence, prevalence and distribution of bone metastases. Bone 1991;12(Suppl 1):S9–S10. [DOI] [PubMed] [Google Scholar]
- 20.Silva MJ, Hipp JA, McGowan DP, Takeuchi T, Hayes WC. Strength reductions of thoracic vertebrae in the presence of transcortical osseous defects: effects of defect location, pedicle disruption, and defect size. Eur Spine J 1993;2(3):118–125. [DOI] [PubMed] [Google Scholar]
- 21.McGowan DP, Hipp JA, Takeuchi T, White AA, 3rd, Hayes WC. Strength reductions from trabecular destruction within thoracic vertebrae. J Spinal Disord 1993;6(2):130–136. [PubMed] [Google Scholar]
- 22.Borggrefe J, Giravent S, Campbell G, et al. Association of osteolytic lesions, bone mineral loss and trabecular sclerosis with prevalent vertebral fractures in patients with multiple myeloma. Eur J Radiol 2015;84(11):2269–2274. [DOI] [PubMed] [Google Scholar]
- 23.Whealan KM, Kwak SD, Tedrow JR, Inoue K, Snyder BD. Noninvasive imaging predicts failure load of the spine with simulated osteolytic defects. J Bone Joint Surg Am 2000;82(9):1240–1251. [DOI] [PubMed] [Google Scholar]
- 24.Link TM. Radiology of Osteoporosis. Can Assoc Radiol J 2016;67(1):28–40. [DOI] [PubMed] [Google Scholar]
- 25.Keaveny TM, Hayes WC. A 20-year perspective on the mechanical properties of trabecular bone. J Biomech Eng 1993;115(4B):534–542. [DOI] [PubMed] [Google Scholar]
- 26.Hildebrand T, Laib A, Müller R, Dequeker J, Rüegsegger P. Direct three-dimensional morphometric analysis of human cancellous bone: microstructural data from spine, femur, iliac crest, and calcaneus. J Bone Miner Res 1999;14(7):1167–1174. [DOI] [PubMed] [Google Scholar]
- 27.Kleerekoper M, Villanueva AR, Stanciu J, Rao DS, Parfitt AM. The role of three-dimensional trabecular microstructure in the pathogenesis of vertebral compression fractures. Calcif Tissue Int 1985;37(6):594–597. [DOI] [PubMed] [Google Scholar]
- 28.Chevalier Y, Pahr D, Zysset PK. The role of cortical shell and trabecular fabric in finite element analysis of the human vertebral body. J Biomech Eng 2009;131(11):111003. [DOI] [PubMed] [Google Scholar]
- 29.Rizzoli R, Body JJ, DeCensi A, et al. Guidance for the prevention of bone loss and fractures in postmenopausal women treated with aromatase inhibitors for breast cancer: an ESCEO position paper. Osteoporos Int 2012;23(11):2567–2576. [DOI] [PubMed] [Google Scholar]
- 30.James H, 3rd, Aleksic I, Bienz MN, et al. Comparison of fracture risk assessment tool score to bone mineral density for estimating fracture risk in patients with advanced prostate cancer on androgen deprivation therapy. Urology 2014;84(1):164–168. [DOI] [PubMed] [Google Scholar]
- 31.Tschirhart CE, Nagpurkar A, Whyne CM. Effects of tumor location, shape and surface serration on burst fracture risk in the metastatic spine. J Biomech 2004;37(5):653–660. [DOI] [PubMed] [Google Scholar]
- 32.Alkalay RN. Effect of the metastatic defect on the structural response and failure process of human vertebrae: an experimental study. Clin Biomech (Bristol, Avon) 2015;30(2):121–128. [DOI] [PMC free article] [PubMed] [Google Scholar]
- 33.Hipp JA, Rosenberg AE, Hayes WC. Mechanical properties of trabecular bone within and adjacent to osseous metastases. J Bone Miner Res 1992;7(10):1165–1171. [DOI] [PubMed] [Google Scholar]
- 34.Giambini H, Fang Z, Zeng H, Camp JJ, Yaszemski MJ, Lu L. Noninvasive failure load prediction of vertebrae with simulated lytic defects and biomaterial augmentation. Tissue Eng Part C Methods 2016;22(8):717–724. [DOI] [PMC free article] [PubMed] [Google Scholar]
- 35.Windhagen HJ, Hipp JA, Silva MJ, Lipson SJ, Hayes WC. Predicting failure of thoracic vertebrae with simulated and actual metastatic defects. Clin Orthop Relat Res 1997;(344):313–319. [PubMed] [Google Scholar]
- 36.Fradet L, Petit Y, Wagnac E, Aubin CE, Arnoux PJ. Biomechanics of thoracolumbar junction vertebral fractures from various kinematic conditions. Med Biol Eng Comput 2014;52(1):87–94. [DOI] [PubMed] [Google Scholar]
- 37.Tschirhart CE, Finkelstein JA, Whyne CM. Metastatic burst fracture risk assessment based on complex loading of the thoracic spine. Ann Biomed Eng 2006;34(3):494–505. [DOI] [PubMed] [Google Scholar]
- 38.White AA, Panjabi MM. Clinical Biomechanics of the Spine. 2nd ed. Philadelphia, Pa: Lippincott, 1990. [Google Scholar]
- 39.Bouvard B, Hoppé E, Soulié P, et al. High prevalence of vertebral fractures in women with breast cancer starting aromatase inhibitor therapy. Ann Oncol 2012;23(5):1151–1156. [DOI] [PubMed] [Google Scholar]
- 40.Nazarian A, von Stechow D, Zurakowski D, Müller R, Snyder BD. Bone volume fraction explains the variation in strength and stiffness of cancellous bone affected by metastatic cancer and osteoporosis. Calcif Tissue Int 2008;83(6):368–379. [DOI] [PubMed] [Google Scholar]
Associated Data
This section collects any data citations, data availability statements, or supplementary materials included in this article.


