

Summary:
Molecular variation contributes to the evolution of adaptive phenotypes though it is often difficult to understand precisely how. The adaptively significant electric organ discharge behavior of weakly electric fish is the direct result of biophysical membrane properties set by ion channels. Here we describe a voltage-gated potassium channel gene in African electric fishes that is under positive selection and highly expressed in the electric organ. The channel produced by this gene shortens electric organ action potentials by activating quickly and at hyperpolarized membrane potentials. The source of these properties is a derived patch of negatively charged amino acids in an extracellular loop near the voltage sensor. We demonstrate that this negative patch acts by contributing to the global surface charge rather than by local interactions with specific amino acids in the channel’s extracellular face. We suggest a more widespread role for this loop in the evolutionary tuning of voltage-dependent channels.
Keywords: Electric Fish, Potassium Channel, Biophysics, RNA-seq

Introduction
A major goal of evolutionary biology is understanding how changes at the genetic level result in adaptations. Much can be learned about the genetic basis of adaptation by studying species with unique and/or extreme phenotypic adaptations [1–5]. Because electric fish signal with electricity, and those signals are under strong selection and generated by ion channels, electric fish are an excellent system to study how selection may tune ion channels and, especially, how it might push them towards their biophysical limits.
Nocturnally active mormyrid electric fish produce brief, weak-voltage electric fields, called electric organ discharges (EODs) to form electrosensory images of their environments and to communicate during courtship [6]. Though EOD waveforms are known to be influenced by both natural and sexual selection pressures [7–9], the molecular targets and biophysical mechanisms for selection remain elusive. The superfamily Mormyroidea is composed of the Gymnarchidae and the Mormyridae (Figure 1). The family Gymnarchidae is composed of a single species, Gymnarchus niloticus, that generates a constant sine wave-like EOD. The sister taxon, the family mormyridae (blue triangle, Figure 1), includes hundreds of species all of which produce brief, often multi-phasic pulses at variable intervals--”pulse-type” EODs [10].
Figure 1:

Major clades of mormyroidea (relative abundance of species in each clade represented by the width of the black triangles) with representative electric organ discharges (EODs). Species used in this study are shown in boldface. Electric organs (EO; purple triangle) evolved in the common ancestor of the superfamily mormyroidea that is comprised of two families, the monotypic “Gymnarchidae” and the “Mormyridae.” Electric organ discharges in Gymnarchus niloticus are quasi-sinusoidal wave-like discharges, although only a single cycle is shown here. In the common ancestor of the Mormyridae, a more specialized adult electric organ (aEO, blue triangle) evolved, which produces short-duration pulse type discharges. EODs of Petrocephalinae (e.g. Petrocephalus soudanensis) and non-clade A mormyrinae (e.g. Myomyrus spp.) are characteristically short duration, whereas clade-A mormyrinae are highly diverse in EOD properties, including duration and number of phases (complexity). Some EOD recordings shown derive from specimens deposited in the Cornell Museum of Vertebrates and EOD recordings deposited in the Macaulay Library at the Cornell Laboratory of Ornithology: Myomyrus macrops (CUMV 92394; ML EOD 515280), Brienomyrus brachyistius CUMV 80464; ML EOD 510794) Gnathonemus petersii (CUMV 87880; ML EOD 510874). EOD from Petrocephalus soudanensis was provided by C.D. Hopkins (Cornell University), and EODs from Gymnarchus niloticus and Campylomormyrus compressirostris were recorded by J. Gallant from captive laboratory specimens. For details on recording methods see [17].
In the Mormyridae, selection has often favored the evolution of extremely brief EODs [11, 12] and neuronal adaptations to discriminate between timing differences less than 10 microseconds [13, 14], suggesting EOD pulse duration must be precisely regulated. EODs are produced by the synchronous discharge of action potentials (APs) from many hundreds of individual electrocytes. These APs are extremely brief (~200 microseconds) [15, 16]. Because the duration of AP is shaped by potassium currents as well as sodium currents, we assessed whether voltage-gated potassium channels expressed in the mormyrid electric organ (EO) have evolved specializations for generating brief APs. Here we report a potassium channel gene with a strong imprint of positive selection that is highly expressed in the EO. The biophysical properties of the channel encoded by this gene are specialized for generating brief APs. These properties result from an evolutionarily novel motif of negatively charged residues in an extracellular loop adjacent to the channel’s voltage-sensor. The previous understanding of this extracellular loop is largely based on the shaker potassium channel in fruit flies. However, our analyses suggest that this loop functions differently in vertebrates and suggests a role for this loop in the evolutionary tuning of ion channels.
Results
Identification of a rapidly evolving potassium channel from electric organ
We began by examining muscle and EO transcriptomes representative of Gymnarchus and the Mormyridae (Tables S1,S2, key resources Table). We uncovered two orthologs of the mammalian KCNA7 channel gene--kcna7a and kcna7b--that duplicated in the teleost whole genome duplication (Figure S1). In mammals, KCNA7 is expressed in heart and muscle [18–20]; kcna7b is also expressed in muscle in mormyrids (Figure 2). While kcna7a is expressed in muscle in Gymnarchus, it is predominantly expressed in the EO in mormyrids where it is virtually the only (~10–100-fold higher than any other) voltage-gated potassium channel gene expressed (Figures 2, 3B), and without a beta subunit. The change in expression from muscle to EO in the ancestral mormyrid was accompanied by a burst of positive selection (HYPHY, REL branch-site model [21]) (p<0.01, corrected p value) on this branch (Figure 3A,C,D) paralleling similar changes in the voltage-gated sodium channel gene, scn4aa [22].
Figure 2:

Box-and-whisker plots showing relative expression of potassium channel genes in electric organ and skeletal muscle of Brienomyrus brachyistius. Many potassium channel genes were undetectable in the EO, this graph displays only those that were detectable. Note that Kcna7a is the predominantly expressed potassium channel in electric organ and Kcna7b is the predominantly expressed potassium channel in skeletal muscle. Accession numbers for all potassium channels utilized in this figure are listed in Table S5. See also Tables S1 and S2.
Figure 3:

Evolutionary change in electric organ-expressing potassium channels of mormyrid electric fish. (A) Maximum likelihood gene tree for kcna7a and kcna7b illustrates the duplication of KCNA7 in teleosts (asterisks = bootstrap values of 100). Branches displaying episodic diversifying selection are in red (p<0.01, corrected p-value). Petrocephalus is a basal group and the other three species are in the derived “clade A” giving good phylogenetic coverage of the mormyrids. Note the burst of episodic selection at the base of pulse-generating mormyrids and within “clade A.” (B) Relative expression of kcna7a and kcna7b in the skeletal muscle (SM) and electric organ (EO) of mormyrids and Gymnarchus. (C) Schematic illustration of potassium channel. Note the voltage sensor (S4) and the S3–S4 linker. A bar represents the portion of the S3–S4 linker that is the focus of our study. The asterisk over the bar indicates the location of a site determined to be under positive selection by HYPHY. The amino acid sequences of this region are shown in (D). (D) S3–S4 linker and S4 in shaker channels (corresponding to amino acids 293–333 of the Brienomyrus sequence): kcna7a of four mormyrids (Brienomyrus, Gnathonemus, Campylomormyrus, Petrocephalus), Gymnarchus, and other teleosts (Xenomystus, Scleropages, Fugu, Oryzias); kcna7b of mormyrids and another teleost, and KCNA7 in human (Homo) and elephant shark (Callorhinchus); the single shaker channel in fruit fly (Drosophila) and sea slug (Aplysia), and one of six shaker channels in sea anemone (Nematostella). Conserved positively charged amino acids in S4 in blue, conserved hydrophobic amino acids in S4 in violet. Amino acid substitutions in S4 and the S3–S4 linker in mormyrids in red. The S3–S4 linker of the Drosophila shaker gene is longer than in vertebrates and is truncated to fit the alignment (parentheses). See also Figures S1 and S5 and Table S5.
Voltage-clamp analysis shows biophysical specializations for generating brief action potentials
A potassium current can shorten APs if it activates quickly or at a relatively hyperpolarized membrane potential, or has a steep conductance-voltage curve. In Xenopus oocytes, we expressed both kcna7a sequence from Gymnarchus niloticus, which expresses kcna7a in muscle, and kcna7a sequence from Brienomyrus brachyistius, a mormyrid which expresses kcna7a in EO and has a brief EOD pulse. We observed that the potassium current from Brienomyrus activates faster (tau: Brienomyrus = 1.2 +/− 0.16 msec; Gymnarchus = 3.04 +/− 1.0 msec, p<0.0001, Figure 4A,C,E), at ~30 mV more hyperpolarized membrane potentials (V1/2: Brienomyrus = −44.4 +/− 5.7 mV; Gymnarchus −13.1+/− 5.9 mV, p<0.0001, Figure 4B,D), and with a steeper conductance-voltage (G-V) curve (k: Brienomyrus = 7.0 +/− 1.4; Gymnarchus 9.3 +/− 2.3; p <0.028, Figure 4F) than the current from Gymnarchus. Brienomyrus kcna7a current begins to activate approximately 10 to 20 mV above electrocyte resting potential (−90 to −95 mV; from [15, 16]). A computational model of electrocyte APs using the parameters from these recordings together with generic sodium currents and an inward rectifier found that the current generated by the Brienomyrus kcna7a sequence shortens modeled action potential durations more than that of Gymnarchus (Figure S2).
Figure 4:
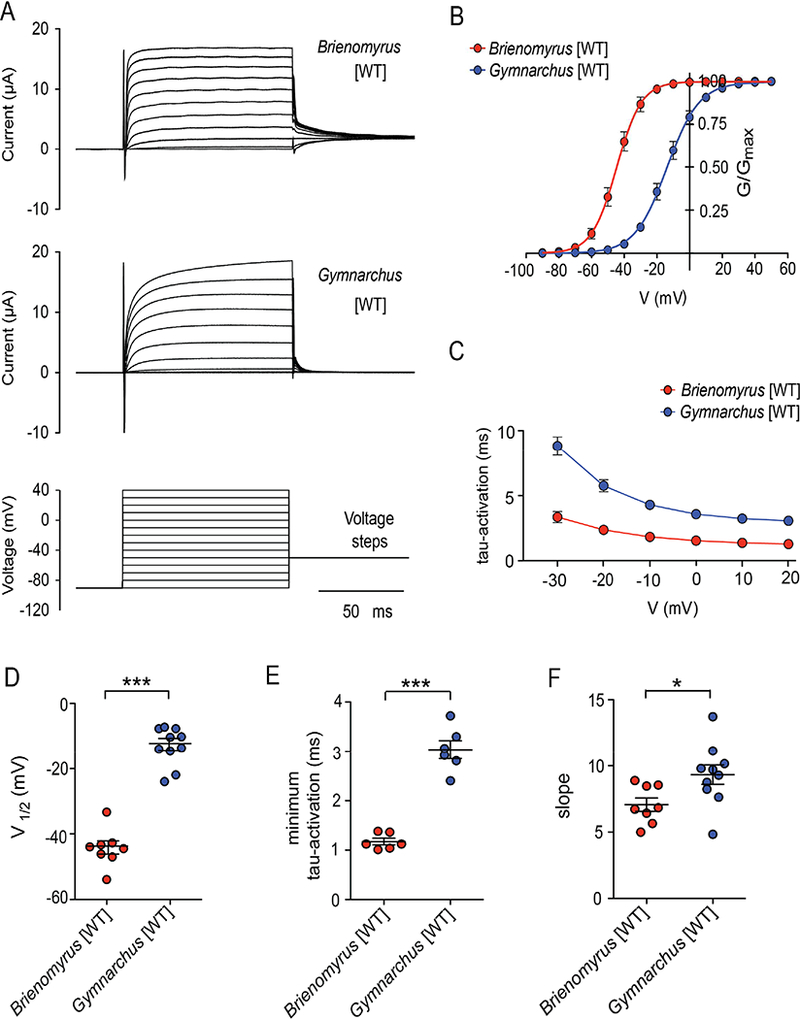
Currents from kcna7a of Gymnarchus and Brienomyrus expressed in Xenopus oocytes show striking differences. (A) Raw voltage-clamp traces (B) conductance-voltage (G-V) curves (C) time constant of activation (tau) as a function of voltage (D) the voltage at which the conductance is 50% of maximum (V1/2) (E) minimum tau (taken at +20 mV) (F) the slope of the G-V curve. Note that the expressed current from Brienomyrus activates faster, at more hyperpolarized voltages, and with a steeper slope that that from Gymnarchus. Here and in all subsequent figures, Gymnarchus = blue; Brienomyrus = red. * = p<0.05, *** = p<0.001 (unpaired t test). Here and in subsequent figures, the brief downward deflection at the onset of the voltage clamp is caused by ringing as the camp settles. See also Figure S2 and Tables S3 and S4 and S7.
If Brienomyrus kcna7a is adapted for generating brief APs, then kcna7a from another pulse-type mormyrid should show similar enhanced voltage sensitivity. Conversely, if Gymnarchus kcna7a represents the “default” condition associated with muscle function, then it should have a comparable voltage sensitivity to other muscle-expressing kcna7 channels. Indeed, the voltage-sensitivity of the EO-expressing kcna7a from another mormyrid with a brief EOD pulse, Campylomorus compressirostris, (−52.8±1.8 mV) is comparable to the EO-expressing kcna7a of Brienomyrus, and that of the muscle-expressing Brienomyrus kcna7b (−24.7±1.3 mV) and mouse kcna7 (V1/2 = −20 mV) [19] are comparable to Gymnarchus kcna7a (Table S7).
Site-directed mutagenesis identifies a novel functional motif
Potassium channels have six transmembrane helices, S1–S6, in the alpha subunit (Figure 3C). Four alpha subunits combine to form a channel. S5 and S6 line a conductive pore for potassium that opens when membrane depolarization alters the conformations of S4, which forms the voltage sensor. The kcna7a gene, which encodes the Kv1.7a potassium channel protein, is a member of the shaker family of potassium channels named after the canonical shaker gene of Drosophila. The shaker family is ancient preceding the divergence of bilateria and cnidaria [23]. We constructed alignments of Kv1.7 channel proteins with their orthologs including distantly related shaker family channels (Figure 3D). These protein alignments highlight that, despite strong conservation of the amino acids in the S4 over ~800 million years [24], three amino acid substitutions occurred in the S4 of the ancestor of the pulse mormyrids following the mormyrids’ divergence from Gymnarchus and before their radiation [25] (Figure 3D).
We tested whether these amino acid substitutions alter channel properties by swapping amino acid residues reciprocally between the Gymnarchus and Brienomyrus Kv1.7a proteins using site-directed mutagenesis. Placing the three amino acids from the S4 of Brienomyrus (Figure S3A,B,C, Table S7) into the S4 of Gymnarchus [RVI>KIV] produced a modest shift in the expected direction (leftward) of the G-V curve, and complex shifts in activation kinetics suggesting that amino acids at other sites interact with these to influence tau-activation (Figure S3D,E, Table S7). The complementary substitutions from Gymnarchus to Brienomyrus [KIV>RVI] had no effect on voltage sensitivity and only minor effects on tau-activation (Figure S4, Table S7). Especially considering the last result, we concluded that other amino acid substitutions accrued during the evolution of the ancestral pulse mormyrid Kv1.7a, and the effects of these substitutions must override the effects of the substitutions in S4.
The mormyrid kv1.7a is unusual among vertebrate voltage-gated potassium channels at another place: it possesses a patch of contiguous negatively charged amino acids in the S3–S4 linker (Figure 3D). A site within this patch was detected by HYPHY as evolving under positive selection (asterisk, Figure 3C,D). Again, using site-directed mutagenesis, we swapped homologous regions of the S3–S4 linker between Gymnarchus and Brienomyrus channels. This resulted in a strong shift in the V1/2 and tau-activation of one species to that of the other (Brienomyrus [EEEE>SPT] = −9.34 +/− 4.6 mV; Gymnarchus [SPT>EEEE] = −40.69 +/− 4.7 mV) (WT vs. chimeric channel in both species, p<0.0001) (Figure 5, TableS7).
Figure 5—

The distinctive characteristics of the currents from kcna7a of Gymnarchus and Brienomyrus are transferred by swapping part of the S3–S4 linker. (A-E) currents of Brienomyrus wild type (WT) and Brienomyrus (EEEE>SPT); (A) raw currents (B) G-V curves (C) V1/2 (D) tau-activation (E) minimum tau-activation; (F-J) currents of Gymnarchus WT and Gymnarchus (SPT>EEEE) (F) G-V curves (G) V1/2 (H) tau-activation (I) minimum tau-activation. Here and in all subsequent figures, solid lines = WT; dotted lines = chimeric channels. * p<0.05, *** p<0.001 (unpaired t test). See also Figures S3 and S4 and Tables S6 and S7.
Predicted structural properties of S3–S4 linkers
There is an increasing recognition that the S3–S4 linker influences potassium channel properties [26]. The prevailing view is that the S3–S4 linker’s influence on Drosophila shaker channel properties is due to its length and flexibility rather than its charged residues [27–30]. We note that the S3–S4 linkers in Brienomyrus and Gymnarchus kcna7a are almost identical in length, differing by only one amino acid (Figure 3D). However, we note the S3-S4 linker of the shaker channel of Drosophila and other arthropods is atypically long compared with that of other animals (Figures 3, S5), suggesting that S3-S4 linker may function differently in arthropods than in other animals. Therefore, we made a structural model of the Kv1.7a S3-S4 linkers of Brienomyrus and Gymnarchus.
The extra negative charges in the S3–S4 linker of Brienomyrus could contribute to different physical properties between the channels of the two species, including flexibility and charge. We compared the S3–S4 linkers of homology models of the Gymnarchus and the Brienomyrus Kcna7a voltage sensors (Figure S6). Taken as a whole, the overall content of flexible voltage-sensor residues is comparable emphasizing that the differences between S3–S4 linkers that transfers with the “negative patch” is likely not due to flexibility.
Electrostatic tuning of the voltage sensor
To test whether the additional glutamates act via their electrostatic properties, we conducted two experiments: replacing negatively charged aspartates for glutamates did not alter V1/2 (V1/2 [EEEE>DDDD] = −49.2 +/− 4.9 mV) and replacement with positively charged amino acids produced an even more profound rightward shift of voltage sensitivity than replacement with Gymnarchus’ neutral amino acids (V1/2 [EEEE>KKKK] = +16.0 +/−9.2 mV) ns p> 0.05, *** p<0.001 (one-way ANOVA followed by Dunnett’s post-test) (Figure 6, Table S7).
Figure 6:

Substitution of negatively charged (D) but not positively charged (K) amino acids in the Brienomyrus S3–S4 linker retains WT biophysical properties. (A) Representative currents (B) conductance-voltage curves (C) V1/2 values (D) tau-activation curves (E) minimum tau-activation curves. Insets below traces in (A) are the voltage protocols used’ and the statistics information ‘ns indicates not significant (p>=0.05), *** p< 0.001 (one way ANOVA followed by the Dunnetts posttest) compared to WT. See also Figures S5 and S6 and Table S7.
How might the negative patch influence channel behavior? The “repulsion hypothesis” suggests that this patch might face another negatively charged amino acid or patch of amino acids in the closed state. Under these conditions a focused, local interaction between the two could create a repulsive bias so that less depolarizing voltage is needed to move the S4 [31]. Alternatively, the negatively charged amino acids in this region may be forming salt bridges with positively charged amino acids in other parts of the channel favoring the open confirmation. The “surface charge” hypothesis states that the charged intra- and extracellular parts of proteins globally add to, or cancel out, the membrane potential caused by separation of ions. In this way S4 movement could occur at less depolarized membrane potentials.
To distinguish between these hypotheses, we devised a test based on the premise that if a local bias occurs via a local electrostatic repulsion, it should not matter if interacting partners are negative or positive. We identified negatively charged putative interaction partners primarily in extracellular loops near the S3–S4 linker (S3–S4, S1–S2) or in the S5-pore that were conceivably close enough to have an electrostatic interaction with the S3–S4 linker, converted them to positive residues (E/D>K), and tested whether this altered V1/2 (Figure 7). Some substitutions had little effect but some, such as D379K, made V1/2 more positive. We then combined any substitutions that shifted V1/2 with the positively charged [EEEE>KKKK] S3–S4 linker. We observed that the combination of two positive patches only shifted V1/2 to even more positive values, never a reversion to a more negative V1/2. Substituting the positive amino acids in the extracellular loop regions to negative amino acids did not have any effect on the V1/2. These results suggest that the negative patch in the S3–S4 linker is not acting via a local repulsive force or formation of salt bridges but, rather, globally by contributing to the surface charge.
Figure 7:

Summary showing negatively charged amino acids (E, D) in S1–S2, S3–S4 and S5–S6 loops that had quantitatively measurable effect on V1/2 when substituted with the positively charged amino acid lysine (K), alone and in combination with S3–S4 EEEE>KKKK in Brienomyrus kv1.7a (A) Schematic diagram of site of amino acid substitutions in S1–S2, S3–S4, S5–S6(black) and S3–S4 (red) that caused a significant measurable shift in V1/2. (B-D) G-V curves for amino acid substitutions in S1–S2 loop (B), S3–S4 loop (C), S5–S6 loop (D) that affected V1/2 in combination with S3–S4 EEEE>KKKK substitutions. (E) Summary of V1/2 for all groups depicted in this figure. For information on all substitutions made in the S1–S2, S3–S4, S5–S6 loops to assess possible electrostatic interactions with the S3–S4 loop ‘EEEE’ region in Brienomyrus kv1.7a see Table S7.
* indicates significance (* p<0.05, *** p<0.001) compared to Brienomyrus kv1.7a [WT] calculated using one way ANOVA followed by Dunnetts posttest. * indicates significance (*** p<0.001) compared to Brienomyrus kv1.7a [EEEE>KKKK] calculated using one way ANOVA followed by Dunnetts posttest. See also Figure S6.
Discussion
At the origin of the mormyrids, kcna7a shifted its expression from its ancestral location in skeletal muscle to strong selectivity for expression in the electric organ, where it is the vastly predominant potassium channel in electric organ. Accompanying this shift in expression, the kcna7a potassium channel gene evolved rapidly preceding the adaptive radiation of the mormyrids. This is a similar pattern to that of a muscle-expressing sodium channel gene that also shifted its expression to the mormyrid EO (scn4aa) [22, 33]. Because of: (1) the near exclusive expression of kcna7a over other voltage-gated potassium channels in the EO, (2) the observed amino acid substitutions in the S3–S4 linker in Kv1.7a, and (3) our measurements of the biophysical properties of the mormyrid channel compared to its ancestral form, we conclude that these biophysical changes enable ultra-brief EODs by shortening the duration of APs produced by electrocytes. Ultimately, this conclusion must be tested by recording native currents of elecctrocytes. While there are a number of other amino acid substitutions at conserved sites, future studies will elucidate their functions. We note that a few species of mormyrids, such as Campylomormyrus tshokwe, have secondarily and independently evolved long-duration EOD pulses [8, 34, 35]. The expression level of some Kv1 family genes [36] have been implicated in species differences in EOD duration in the explosively radiating genus Campylomormyrus, though kcna7a paralogs have not been examined in this group. It will be interesting to examine whether additional novel amino acid substitutions have occurred in C. tshokwe kcna7a, and within other species with long duration EOD pulses.
The prevailing view of the S3–S4 linker’s influence on shaker channel properties is that it is due to its length, flexibility or hydrophobicity rather than its charged residues [27–30]. Our data show that the long S3–S4 linker of the Drosophila shaker and other arthropods is not representative of other animal groups, including vertebrates (Figure S5). The S3–S4 linker of mormyrids possesses a naturally-occurring, extreme but instructive case of a large patch of negatively charged amino acids poised directly above the S4; other vertebrate potassium channels have negatively charged amino acids at one or more sites within the S3–S4 linker that could mediate such effects. Our study and a few other recent studies [31, 37] suggest that negative charges acting to alter outer membrane surface charge rather than flexibility are at play in tuning the voltage-sensitivity of vertebrate voltage-gated potassium channels. This concept is further supported by a complementary observation of an L-type Ca2+ channel found in elasmobranch electroreceptors that activates at more hyperpolarized potentials than expected due to a patch of positively charged amino acids in the S2–S3 linker localized near the inner mouth of the channel [38]. Thus, it seems that the addition of charged amino acids on either side of the S4 voltage sensor may be an evolutionarily simple and widespread way to modify channel voltage- sensitivity and gating kinetics.
STAR Methods
CONTACT FOR REAGENT AND RESOURCE SHARING
Further information and requests for resources and reagets should be directed to and will be fullfilled by the lead contact: Harold H. Zakon (h.zakon@austin.utexas.edu). All materials generated by this study are available by request, or as internet resources where described.
EXPERIEMNTAL MODEL AND SUBJECT DETAILS
Animal Sources
Petrocephalus soudenensis [Osteoglossiformes: Mormyridae]– A freshwater mormyrid species native to central Africa was obtained through the aquarium trade. Sex of individual was not determined. Cornell Museum of Vertebrates (CUMV: 91327, Specimen # 5727; Identified by M.E. Arnegard). Tissues were collected in RNA later prior to RNA-isolation. Gymnarchus niloticus [Osteoglossiformes: Gymnarchidae]) – A freshwater species native to central Africa, was obtained through the aquarium trade. Sex of individual was not determined. Tissues were collected in RNA later prior to RNA-isolation. All procedures used followed the American Physiological Society Animal Care Guidelines, and were approved by the Institutional Animal Care and Use Committee at University of Texas, Austin and Michigan State University.
Oocytes
Mature 9+ cm Female, darkly pigmented Xenopus leavis were obtained from Nasco, WI (ITEM# LM00535MX) and housed in the University animal facility. Oocytes were surgically removed from the frogs in accordance with the NIH guidelines. The surgical procedure was done using tricane anesthesia under a protocol approved by the IACUC of the University of Texas at Austin. The surgically removed oocytes were placed in a solution containing 108 mM NaCl, 1 mM EDTA, 2 mM KCl, and 10 mM HEPES. The thecal and epithelial layers were manually removed from the oocytes. Oocytes were then treated for 10 minutes with 0.5 mg/mL collagenase from Clostridium histolytic suspended in 83 mM NaCl, 2 mM KCl, 1 mM MgCl2 and 5 mM HEPES to remove the follicular layer. Defolliculated Stage V and VI were used for all mRNA injections. mRNA microinjections were done using the micro injector from Drummond Scientific Co., PA. Injected oocytes were incubated at 16°C in sterile modified Barth’s solution [88 mM NaCl, 1 mM KCl, 2.4 mM NaHCO3, 19 mM HEPES, 0.82 mM MgSO4, 0.33 mM Ca(NO3)2, 0.91 mM CaCl2, 10,000 units/l penicillin, 50 mg/l gentamicin, 90 mg/l theophylline, and 220 mg/l sodium pyruvate, pH 7.5] for 1–3 days after injection to achieve optimal channel expression for recordings.
METHOD DETAILS
RNA Extraction and Library Preparation for RNAseq –
Tissues were homogenized in liquid nitrogen using a ceramic mortar and pestle, and total RNA was extracted using Trizol (ThermoFisher Scientific, Waltham, MA USA) following the manufacturer’s specifications (see [43] for detailed methods). Total RNA was quantified using qubit and quality assessed using a Bioanalzyer (Agilent Technologies, Santa Clara, CA USA). Samples were then depleted of ribosomal RNA using the a RiboZero kit (Illumina, Inc. San Diego, CA) as per manufacturer’s specifications, or RNA samples were again assessed for concentration and quality before preparation of sequencing libraries. cDNA libraries were constructed from ribosomal RNA-depleted samples using the Illumina TruSeq RNA Sample Preparation (v.2) kit. All libraries were sequenced on an Illumina HiSeq2500 using 125bp single-end reads (2×125bp). Various mRNA libraries were sequenced on various platforms as summarized in Supplemental Table S1.
Additional Data Sources –
B. brachyistius – We downloaded the raw reads for Brienomyrus brachyistius electric organ and skeletal muscle tissues referenced in [1] with NCBI BioProject accession # (PRJNA248545). C. compressirostris – We downloaded the raw reads for skeletal muscle and electric organ tissue referenced in [39] with NCBI BioProject accession # (PRJNA192446).
Transcriptome Assembly –
For each species, short read sequences obtained from each tissue were combined. Quality control, adapter trimming, and quality filtering was performed using Trimmomatic version 0.33 [40] with the following settings: ILLUMINACLIP TruSeq3-PE.fa:2:30:10 SLIDINGWINDOW:4:30 MINLEN:60. Paired trimmed reads for each species were then assembled into de-novo transcriptomes using Trinity v.20140413p1 [41] with default parameters. To speed up assembly, reads from C. compressirostris were digitally normalized prior to assembly using the --normalize_reads flag. Results of all assemblies are summarized in Table S2.
Calculation of Expression Levels-
Short reads from individual tissue libraries were mapped to the appropriate transcriptome assembly using Bowtie2 v. 2.2.6 [42] with default parameters. Read counting and ambiguity resolution were performed using RSEM v. 1.3.0, [43]. Raw read counts were then scaled and normalized per sample by transforming to FPKM values, and samples were cross-sample normalized using a trimmed mean of M values (TMM; [44]) for comparison between libraries and species. Scaling and normalization was performed using Trinity v.20140413p1 scripts ‘align_and_estimate_abundance.pl’ and ‘abundance_estimates_to_matrix.pl’ respectively.
Assignment of Orthologues Between Electric Fish-
Using SeaView (http://doua.prabi.fr/software/seaview) nucleotide or amino acid sequences of mormyrid potassium channel genes were aligned with potassium channel genes (in the shaker family: nucleotide = kcnax; amino acid = kv1.x) of other teleosts, and human. Trees were rooted with D. melanogaster shaker, the canonical shaker family channel. Alignments were analyzed in a maximum likelihood format using the default parameters (model of evolution = GTR; nucleotide equilibrium frequency = empirical; number of invariable sites = none; number of rate categories = four; 100 bootstrap replicates). We then utilized the branch-site random effects likelihood (REL) algorithm [45] (HYPHY website, http://www.datamonkey.org/) to identify branches that have undergone episodic diversifying selection. B. brachyistius kcna7a was the reference gene with 1545 nucleotides. For analysis of positive selection the N and C termini and a poorly aligned segment were trimmed so that the dataset for was nucleotides 172–678 and 748–1401. Different datasets included: kcna7a alone, kcna7a and kcna7b together, and both of these datasets with human kcna7 as outgroup. In all analyses, the same three branches (Figure 3 in red) were significant for evidence of positive selection.
Mutagenesis and Expression in Oocytes-
The coding sequences of Kcna7a genes from Brienomyrus brachyistius and Gymnarchus niloticus were synthesized by GenScript (Piscataway, NJ, USA) and cloned into the pGEMHE vector. During synthesis the Kozak sequence (GCCACC) was added to the 5’ end of the sequences immediately before the start codon to improve translation efficiency. Mutations were introduced using the QuikChange II XL site directed mutagenesis kit from Agilent technologies, USA, and verified by sequencing. Invitro transcription was carried out using the mMESSAGE mMACHINE T7 transcription kit from Thermo Fisher Scientific as per the manufacturer’s protocol. The concentration of the synthesized capped mRNA was measured using the ND-1000 spectrophotometer from NanoDrop Technologies, Wilmington, DE, USA. Each oocyte was injected with 50 nl of 0.01–0.1 µg/µl mRNA suspended in nuclease free water.
Electrophysiology and Analysis –
Currents from mRNA injected oocytes was recorded using the two-electrode voltage clamp. All recordings were done at room temperature (21–23 C) using the OocyteClamp OC 725C amplifier from Warner Instruments Corp (Hamden, CT, USA). The bath solution contained 115 mM NaCl, 1.5 mM KCl, 10 mM HEPES and 1 mM MgCl2, pH- 7.4 adjusted with NaOH.The pipette solution consisted of 3 M KOAc and 15 mM KCl. Current activation was measured using a series of 10mV voltage steps (100 ms each) from a potential of −90mV to 40mV followed by a 100 ms tail pulse of −50 mV. For recording currents from Brienomyrus mutants that open at more depolarized potentials the voltage steps used were −70 to 60 mV or 80 mV in 10 mV increments. The K+ reversal potential was measured by a pulse protocol of 100 ms depolarization to 40 or 60 mV followed by a 200 ms test pulse of −120 mV to 0 mV in 10 mV increments. In all recordings the holding potential was maintained at −90 mV.
Data acquisition and the preliminary minimal analysis of I-V data were done using the pCLAMP 8 software from Axon Instruments, Inc., (Foster City, CA, USA). All other analysis was done using the GraphPad Prism 5 software. The ionic current (I) recorded during the voltage steps was converted to conductance (G) by dividing with the driving force (V-Erev). The half-activation potential (V1/2) and slope factor of the activation curve were obtained by fitting the G-V curves with a simple Boltzmann function. For calculation of tau-activation, the rising phase of the K+ channel current at each voltage step was fitted with the equation I(t)= Imax*(1-exp(−K*t))^n where K= 1/tau-activation. Although, we tried fitting with n=2,3,4, the best overall fit was obtained with n=2 and this has been used throughout this study. Time constants for deactivation were obtained by fitting with a single exponential.
Computational Methods and Results.
For numerical simulations we modeled the electrocyte as a single compartment. The capacitance C was 50 nF consistent with empirical measurements of whole-cell capacitance in electrocytes of weakly electric fish [46–48]. Differential equations were coded and integrated with Matlab (Mathworks, Inc., Natick MA) using Euler’s method with integration time steps of 1 × 10⁻⁹ sec. The current balance equation was:
| (1) |
where INa represents Na+ current, IK represents a non-inactivating delayed rectifier K+ current, IR is an inwardly-rectifying K+ current, and IL is the leak current. Equations for these currents were as follows:
| (2) |
| (3) |
| (4) |
| (5) |
The gating variables in Equations 2 and 3 are given by Equation 6 where j = m, h, or n:
| (6) |
The voltage-dependent values of j∞ evolved as follows:
| (7) |
where V50j and kj are derived from Boltzmann sigmoidal fits to empirical from the present results for j = n and from previous empirical data for electrocyte Na+ conductances for j = m [47]. These values are given in Table S3. τφ is given by Eqn. 8 for j = m and n:
| (8) |
and by Eqn. 9 for j = h:
| (9) |
Where values of αj, βj, µj, and σj were determined by least-squares best fits to empirical data from the present results for j = n, and from previous empirical data [49] for j = m or h. These parameter values are given in Table S3. We first compared simulated APs from model cells with identical Na+ and leak conductance parameters, but K+ conductance parameters derived from G-V and τ-V curves for kcna7a of either Gymnarchus or Brienomyrus (Supplemental Figure 2). To further explore the contributions of these parameters to changes in AP width, we then tested a set of 11305 model cells where we systematically varied kn, V50n, and μn between the values for Gymnarchus and those for Brienomyrus, thereby changing the GV curve slope, G-V curve midpoint, and τ-V curve midpoint, respectively (parameter ranges are shown in Table S4). We then used stepwise multiple linear regression (Matlab stepwiselm function) to determine the relative contributions of these parameters in determining AP width across all combinations of these parameters.
Structure Models.
The Protein Modeling Portal, http://www.proteinmodelportal.org [50] was used to submit projects to multiple servers for structure prediction. Kcna7a voltage-sensor domain protein sequences were submitted using Brienomyrus (residues 276–340) and Gymnarchus (residues 275–337). Some solutions returned obvious steric clashes. As a final step, the Yasara server was used to energy minimize solutions, add hydrogens, and to alleviate steric clashes within the models (http://www.yasara.org/minimizationserver.htm) [51]. The values used for amino acid flexibility score were determined previously [52], and rendered in place of B-factors in the model output structure files. Electrostatic surface potential was determined using the PDB2PQR and APBS (Adaptive Poisson-Boltzmann Solver) plugins for The PyMOL Molecular Graphics System, Version 0.99rc6 (Schrödinger, LLC) [53, 54]).
QUANTIFICATION AND STATISTICAL ANALYSIS
Phylogenetic Analysis:
Bootstrap values > 0.95 were considered significant support for nodes of phylogenetic trees. Assessment of episodic diversifying selection on nodes or branches of trees was done within the HyPhy format using the branch-site REL program. This uses the likelihood ratio test with a corrected p value of >0.01.
Electrophysiology:
Statistical analysis of electrophysiological results was performed using the GraphPad Prism 5 software. Statistical tests used were either Student’s t test or one-way ANOVA followed by the Dunnett’s post-test with a 95% confidence interval. For each experiment, the particular statistical tests used and significance thresholds are reported in each figure legend.
DATA AND SOFTWARE AVAILABILITY –
The raw sequence data generated in this project are available through the NCBI Sequence Read Archive (SRA) with the following accession numbers. Assembled transcriptomes and expression tables are available for download and BLAST searching via the EFISHGENOMICS web-portal (http://efishgenomics.integrativebiology.msu.edu). Focal sequences described in this analysis have been additionally deposited in NCBI Genbank with the accession numbers described in Table S3.
ADDITIONAL RESOURCES
In electric fish with ultra-brief discharges, Swapna et al. find a potassium channel that shortens action potentials by activating fast and close to resting potential. These properties derive from a patch of negative amino acids near the voltage sensor. Similarly placed charged amino acids may tune voltage-sensitivity of channels more generally.
Supplementary Material
Highlights.
-
❖
Some electric fish make brief discharges lasting only a few hundred microseconds.
-
❖
These fish have evolved a potassium channel that shortens action potentials
-
❖
This derives from a patch of negative amino acids above the channel’s voltage sensor
-
❖
The negative patch adds to surface charge enhancing sensitivity to depolarization
Acknowledgements:
The sequence data reported here are available from NCBI (accession numbers given in supplementary materials). Funding for this work was by NSF IOS # 1557657 (JRG), NSF IOS# 1557857 (HHZ), NSF IOS# 1350753 and IOS# 1257580 (MRM), NIH 2R01NS077821, to Richard Aldrich).
Footnotes
Publisher's Disclaimer: This is a PDF file of an unedited manuscript that has been accepted for publication. As a service to our customers we are providing this early version of the manuscript. The manuscript will undergo copyediting, typesetting, and review of the resulting proof before it is published in its final citable form. Please note that during the production process errors may be discovered which could affect the content, and all legal disclaimers that apply to the journal pertain.
Declaration of Interests:
The authors declare no competing interests.
Author Contribution:
Conceptualization: HHZ and JRG; Methodology: HHZ, SI, and JRG; Investigation: SI, AG, HHZ, JRG, MRM, DBH, YL, JMY; Writing-original draft: HHZ, JRG; Writing-review and editing: HHZ, JRG, SI, MRM, DBH; Funding Acquisition: HHZ, MRM and JRG; Supervision: HHZ and JRG
References
- 1.Gallant JR, Traeger LL, Volkening JD, Moffett H, Chen PH, Novina CD, Phillips GN, Anand R, Wells GB, Pinch M, et al. (2014). Genomic basis for the convergent evolution of electric organs. Science 344, 1522–1525. [DOI] [PMC free article] [PubMed] [Google Scholar]
- 2.Gracheva EO, Cordero-Morales JF, Gonzalez-Carcacia JA, Ingolia NT, Manno C, Aranguren CI, Weissman JS, and Julius D (2011). Ganglion-specific splicing of TRPV1 underlies infrared sensation in vampire bats. Nature 476, 88–91. [DOI] [PMC free article] [PubMed] [Google Scholar]
- 3.Gracheva EO, Ingolia NT, Kelly YM, Cordero-Morales JF, Hollopeter G, Chesler AT, Sanchez EE, Perez JC, Weissman JS, and Julius D (2010). Molecular basis of infrared detection by snakes. Nature 464, 1006–1011. [DOI] [PMC free article] [PubMed] [Google Scholar]
- 4.Rowe AH, Xiao Y, Rowe MP, Cummins TR, and Zakon HH (2013). Voltage-Gated Sodium Channel in Grasshopper Mice Defends Against Bark Scorpion Toxin. Science 342, 441. [DOI] [PMC free article] [PubMed] [Google Scholar]
- 5.Tarvin RD, Borghese CM, Sachs W, Santos JC, Lu Y, O’Connell LA, Cannatella DC, Harris RA, and Zakon HH (2017). Interacting amino acid replacements allow poison frogs to evolve epibatidine resistance. Science 357, 1261. [DOI] [PMC free article] [PubMed] [Google Scholar]
- 6.Dunlap K, Silva A, Smith G, and Zakon H (2017). Weakly electric fish: Behavior, neurobiology and neuroendocrinology 3rd edition In Hormones, Brain and Behavior, D Pfaff and M Joels, eds. (Elsevier; ), p. in press. [Google Scholar]
- 7.Hopkins CD (1973). Lightning as background noise for communication among electric fish. Nature 424, 268–270. [Google Scholar]
- 8.Hopkins CD (1981). On the diversity of electric signals in a community of mormyrid electric fish in West Africa. American Zoologist 21, 211–222. [Google Scholar]
- 9.Stoddard P (1999). Predation enhances complexity in the evolution of electric fish signals. Nature 400, 254–256. [DOI] [PubMed] [Google Scholar]
- 10.Carlson B, Hasan S, Hollmann M, Miller D, Harmon L, and Arnegard M (2011). Brain evolution triggers increased diversification of electric fishes. Science 332, 583–586. [DOI] [PubMed] [Google Scholar]
- 11.Hopkins CD (1980). Evolution of Electric Communication Channels of Mormyrids. Behav Ecol Sociobiol 7, 1–13. [Google Scholar]
- 12.von der Emde G, and Ringer T (1992). Electrolocation of Capacitive Objects in Four Species of Pulse-type Weakly Electric Fish I. Discrimination Performance. Ethology 91, 326–338. [Google Scholar]
- 13.Hopkins CD, and Bass AH (1981). Temporal coding of species recognition signals in an electric fish. Science 212, 85–87. [DOI] [PubMed] [Google Scholar]
- 14.Paintner S, and Kramer B (2003). Electrosensory basis for individual recognition in a weakly electric, mormyrid fish, Pollimyrus adspersus (G√ºnther, 1866). Behavioral Ecology and Sociobiology 55, 197–208. [Google Scholar]
- 15.Bass A, and Volman S (1987). From behavior to membranes: Testosterone-induced changes in action potential duration in electric organs.? (Proc. Natl. Acad. Sci. USA) 84, 9295–9298. [DOI] [PMC free article] [PubMed] [Google Scholar]
- 16.Bennett MVL (1971). Electric organs In Fish physiology, Volume 5, D.J. Randall, ed. (New York: Academic Press; ), pp. 347–491. [Google Scholar]
- 17.Gallant JR, Arnegard ME, Sullivan JP, Carlson BA, and Hopkins CD (2011). Signal variation and its morphological correlates in Paramormyrops kingsleyae provide insight into the evolution of electrogenic signal diversity in mormyrid electric fish. Journal of Comparative Physiology A. 197, 799–817. [DOI] [PubMed] [Google Scholar]
- 18.Finol-Urdaneta RK, Strüver N, and Terlau H (2006). Molecular and Functional Differences between Heart mKv1.7 Channel Isoforms. The Journal of General Physiology 128, 133–145. [DOI] [PMC free article] [PubMed] [Google Scholar]
- 19.Kalman K, Nguyen A, Tseng-Crank J, Dukes ID, Chandy G, Hustad CM, Copeland NG, Jenkins NA, Mohrenweiser H, Brandriff B, et al. (1998). Genomic Organization, Chromosomal Localization, Tissue Distribution, and Biophysical Characterization of a Novel Mammalian Shaker-related Voltage-gated Potassium Channel, Kv1.7. Journal of Biological Chemistry 273, 5851–5857. [DOI] [PubMed] [Google Scholar]
- 20.Kashuba VI, Kvasha SM, Protopopov AI, Gizatullin RZ, Rynditch AV, Wahlestedt C, Wasserman WW, and Zabarovsky ER (2001). Initial isolation and analysis of the human Kv1.7 (KCNA7) gene, a member of the voltage-gated potassium channel gene family. Gene 268, 115–122. [DOI] [PubMed] [Google Scholar]
- 21.Pond SLK, Frost SDW, and Muse SV (2005). HyPhy: hypothesis testing using phylogenies. Bioinformatics 21, 676–679. [DOI] [PubMed] [Google Scholar]
- 22.Arnegard ME, Zwickl DJ, Lu Y, and Zakon HH (2010). Old gene duplication facilitates origin and diversification of an innovative communication system--twice. Proceedings of the National Academy of Sciences 107, 22172–22177. [DOI] [PMC free article] [PubMed] [Google Scholar]
- 23.Jegla T, Marlow HQ, Chen B, Simmons DK, Jacobo SM, and Martindale MQ (2012). Expanded Functional Diversity of Shaker K+ Channels in Cnidarians Is Driven by Gene Expansion. PLoS ONE 7, e51366. [DOI] [PMC free article] [PubMed] [Google Scholar]
- 24.Erwin DH (2015). Early metazoan life: divergence, environment and ecology. Philosophical Transactions of the Royal Society B: Biological Sciences 370. [DOI] [PMC free article] [PubMed] [Google Scholar]
- 25.Lavoué S, Miya M, Arnegard ME, Sullivan JP, Hopkins CD, and Nishida M (2012). Comparable Ages for the Independent Origins of Electrogenesis in African and South American Weakly Electric Fishes. PLoS ONE 7, e36287. [DOI] [PMC free article] [PubMed] [Google Scholar]
- 26.Labro AJ, Priest MF, Lacroix J.r.m.J., Snyders DJ, and Bezanilla F (2015). Kv3.1 uses a timely resurgent K+ current to secure action potential repolarization. Nature Communications 6, 10173. [DOI] [PMC free article] [PubMed] [Google Scholar]
- 27.Carvalho-de-Souza JL, and Bezanilla F (2018). Nonsensing residues in S3–S4 linker’s C terminus affect the voltage sensor set point in K+ channels. The Journal of General Physiology 150, 307. [DOI] [PMC free article] [PubMed] [Google Scholar]
- 28.Gonzalez C, Rosenman E, Bezanilla F, Alvarez O, and Latorre R (2000). Modulation of the Shaker K(+)Channel Gating Kinetics by the S3–S4 Linker. The Journal of General Physiology 115, 193–208. [DOI] [PMC free article] [PubMed] [Google Scholar]
- 29.Mathur R, Zheng J, Yan Y, and Sigworth FJ (1997). Role of the S3–S4 Linker in Shaker Potassium Channel Activation. The Journal of General Physiology 109, 191–199. [DOI] [PMC free article] [PubMed] [Google Scholar]
- 30.Priest MF, Lacroix J.r.m.J., Villalba-Galea CA, and Bezanilla F (2013). S3–S4 Linker Length Modulates the Relaxed State of a Voltage-Gated Potassium Channel. Biophysical Journal 105, 2312–2322. [DOI] [PMC free article] [PubMed] [Google Scholar]
- 31.Sand R, Sharmin N, Morgan C, and Gallin WJ (2013). Fine-tuning of Voltage Sensitivity of the Kv1.2 Potassium Channel by Inter-helix Loop Dynamics. Journal of Biological Chemistry. [DOI] [PMC free article] [PubMed] [Google Scholar]
- 32.Kennedy A, Wayne G, Kaifosh P, Alvina K, Abbott LF, and Sawtell NB (2014). A temporal basis for predicting the sensory consequences of motor commands in an electric fish. Nat Neurosci 17, 416–422. [DOI] [PMC free article] [PubMed] [Google Scholar]
- 33.Paul C, Kirschbaum F, Mamonekene V, and Tiedemann R (2016). Evidence for Non-neutral Evolution in a Sodium Channel Gene in African Weakly Electric Fish (Campylomormyrus, Mormyridae). Journal of Molecular Evolution 83, 61–77. [DOI] [PubMed] [Google Scholar]
- 34.Lamanna F, Kirschbaum F, Waurick I, Dieterich C, and Tiedemann R (2015). Cross-tissue and cross-species analysis of gene expression in skeletal muscle and electric organ of African weakly-electric fish (Teleostei; Mormyridae). BMC Genomics 16, 668. [DOI] [PMC free article] [PubMed] [Google Scholar]
- 35.Sullivan J, Lavoué S, and Hopkins C (2002). Discovery and phylogenetic analysis of a riverine species flock of African electric fishes (Mormyridae: Teleostei). Evolution 56, 597–616. [DOI] [PubMed] [Google Scholar]
- 36.Nagel R, Kirschbaum F, and Tiedemann R (2017). Electric organ discharge diversification in mormyrid weakly electric fish is associated with differential expression of voltage-gated ion channel genes. J Comp Physiol A 203, 183–195. [DOI] [PubMed] [Google Scholar]
- 37.Elinder F, Madeja M, Zeberg H, and Århem P (2016). Extracellular Linkers Completely Transplant the Voltage Dependence from Kv1.2 Ion Channels to Kv2.1. Biophysical Journal 111, 1679–1691. [DOI] [PMC free article] [PubMed] [Google Scholar]
- 38.Bellono NW, Leitch DB, and Julius D (2017). Molecular basis of ancestral vertebrate electroreception. Nature 543, 391–396. [DOI] [PMC free article] [PubMed] [Google Scholar]
- 39.Lamanna F, Kirschbaum F, and Tiedemann R (2014). De novo assembly and characterization of the skeletal muscle and electric organ transcriptomes of the African weakly electric fish Campylomormyrus compressirostris (Mormyridae, Teleostei). Mol Ecol Resour 14, 1222–1230. [DOI] [PubMed] [Google Scholar]
- 40.Bolger A, Lohse M, and Usadel B (2014). Trimmomatic: A flexible trimmer for Illumina Sequence Data. Bioinformatics 30, 2114–2120. [DOI] [PMC free article] [PubMed] [Google Scholar]
- 41.Grabherr MG, Haas BJ, Yassour M, Levin JZ, Thompson DA, Amit I, Adiconis X, Fan L, Raychowdhury R, Zeng Q, et al. (2011). Full-length transcriptome assembly from RNA-Seq data without a reference genome. Nat Biotech 29, 644–652. [DOI] [PMC free article] [PubMed] [Google Scholar]
- 42.Langmead B, Trapnell C, Pop M, and Salzberg SL (2009). Ultrafast and memory-efficient alignment of short DNA sequences to the human genome. Genome Biology 10, R25. [DOI] [PMC free article] [PubMed] [Google Scholar]
- 43.Li B, and Dewey CN (2011). RSEM: accurate transcript quantification from RNA-Seq data with or without a reference genome. BMC Bioinformatics 12, 323. [DOI] [PMC free article] [PubMed] [Google Scholar]
- 44.Robinson M, and Oshlack A (2010). A scaling normalization method for differential expression analysis of RNA-seq data. Genome Biology 11, R25. [DOI] [PMC free article] [PubMed] [Google Scholar]
- 45.Kosakovsky Pond SL, Murrell B, Fourment M, Frost SDW, Delport W, and Scheffler K (2011). A Random Effects Branch-Site Model for Detecting Episodic Diversifying Selection. Molecular Biology and Evolution 28, 3033–3043. [DOI] [PMC free article] [PubMed] [Google Scholar]
- 46.Ban Y, Smith BE, and Markham MR (2015). A highly polarized excitable cell separates sodium channels from sodium-activated potassium channels by more than a millimeter. J. Neurophysiol. 114, 520–530. [DOI] [PMC free article] [PubMed] [Google Scholar]
- 47.Markham MR, Kaczmarek LK, and Zakon HH (2013). A sodium-activated potassium channel supports high-frequency firing and reduces energetic costs during rapid modulations of action potential amplitude. J. Neurophysiol. 109, 1713–1723. [DOI] [PMC free article] [PubMed] [Google Scholar]
- 48.Markham MR, and Zakon HH (2014). Ionic Mechanisms of Microsecond-Scale Spike Timing in Single Cells. The Journal of Neuroscience 34, 6668–6678. [DOI] [PMC free article] [PubMed] [Google Scholar]
- 49.Markham M, Kaczmarek L, and Zakon H (2013). A sodium-activated potassium channel supports high-frequency firing and reduces energetic costs during rapid modulations of action potential amplitude. Journal of Neurophysiology 109, 1713–1723. [DOI] [PMC free article] [PubMed] [Google Scholar]
- 50.Haas J, Roth S, Arnold K, Kiefer F, Schmidt T, Bordoli L, and Schwede T (2013). The Protein Model Portal—a comprehensive resource for protein structure and model information. Database 2013, bat031-bat031. [DOI] [PMC free article] [PubMed] [Google Scholar]
- 51.Krieger E, Joo K, Lee J, Lee J, Raman S, Thompson J, Tyka M, Baker D, and Karplus K (2009). Improving physical realism, stereochemistry, and side-chain accuracy in homology modeling: Four approaches that performed well in CASP8. Proteins: Structure, Function, and Bioinformatics 77, 114–122. [DOI] [PMC free article] [PubMed] [Google Scholar]
- 52.Bhaskaran R, and Ponnuswamy PK (1988). Positional flexibilities of amino acid residues in globular proteins. International Journal of Peptide and Protein Research 32, 241–255. [DOI] [PubMed] [Google Scholar]
- 53.Baker NA, Sept D, Joseph S, Holst MJ, and McCammon JA (2001). Electrostatics of nanosystems: Application to microtubules and the ribosome. Proceedings of the National Academy of Sciences 98, 10037–10041. [DOI] [PMC free article] [PubMed] [Google Scholar]
- 54.Dolinsky TJ, Nielsen JE, McCammon JA, and Baker NA (2004). PDB2PQR: an automated pipeline for the setup of Poisson–Boltzmann electrostatics calculations. Nucleic Acids Research 32, W665-W667. [DOI] [PMC free article] [PubMed] [Google Scholar]
Associated Data
This section collects any data citations, data availability statements, or supplementary materials included in this article.