

Abstract
Macrophages protect the body from damage and disease by targeting antibody-opsonized cells for phagocytosis. Though antibodies can be raised against antigens with diverse structures, shapes, and sizes, it is unclear why some are more effective at triggering immune responses than others. Here we define an antigen height threshold that regulates phagocytosis of both engineered and cancer-specific antigens by macrophages. Using a reconstituted model of antibody-opsonized target cells, we find that phagocytosis is dramatically impaired for antigens that position antibodies >10 nm from the target surface. Decreasing antigen height drives segregation of antibody-bound Fc receptors from the inhibitory phosphatase CD45 in an integrin-independent manner, triggering Fc receptor phosphorylation and promoting phagocytosis. Our work shows that close contact between macrophage and target is a requirement for efficient phagocytosis, suggesting that therapeutic antibodies should target short antigens in order to trigger Fc receptor activation through size-dependent physical segregation.
Keywords: macrophages, Fc receptor, protein segregation, ITAM, immune modulation, antibody, antigen, phagocytosis, CD45, cancer immunotherapy, kinetic segregation model
In brief
The size of an antigen is a critical determinant of efficient macrophage phagocytosis

INTRODUCTION
Controlled activation of immune cells is essential to protect the body from pathogens and diseased cells while limiting damage to healthy cells. Antibodies provide one way to control immune response by specifically targeting cells displaying foreign antigens for destruction by phagocytes and other innate immune cells. Macrophages use antibody-dependent cellular phagocytosis (ADCP) to destroy bacterial and fungal pathogens as well as virally-infected host cells. Recently, ADCP has also been shown to contribute significantly to anti-tumor immunity during monoclonal antibody (mAb) therapy (DiLillo et al., 2014; Erwig and Gow, 2016; Weiskopf and Weissman, 2015).
Over the past decade, the clinical use of mAbs to treat solid and hematological cancers has rapidly expanded. Humanized mAbs, including the anti-CD20 antibodies rituximab (Rituxan) and the anti-HER2 mAb trastuzumab (Herceptin), retarget Fc-receptor bearing immune cells against tumor cell targets, leading to cell death and clearance of malignant cells through myeloid cell mediated ADCP (Weiskopf and Weissman, 2015), as well as natural killer cell mediated antibody-dependent cellular cytotoxicity (ADCC) (Clynes et al., 2000). Recent studies have also suggested that the therapeutic mechanism of the checkpoint inhibitor mAb anti-CTLA-4 is dependent on Fc-dependent depletion of regulatory T cells by macrophages within the tumor (Simpson et al., 2013).
What makes an antibody effective at stimulating an immune response? Biochemical properties of the antibody, including binding affinity, isotype, and glycosylation, are known to be important (Raju, 2008). However, the role of physical properties of the antigen, including its structure, shape, and size, remains unclear. Whether antigen height affects macrophage effector function could have important implications for antigen and epitope selection for therapeutic mAbs and could provide new insight into the molecular mechanism that govern macrophage activation.
Antibody-dependent cellular phagocytosis is triggered by binding between the Fc region of IgG and macrophage Fcγ receptors (FcγRs), though the mechanism by which Fc binding to an FcγR leads to activation and phagocytosis is still under investigation. Unlike toll-like receptors, which dimerize upon ligand binding (Akira and Takeda, 2004), FcγR bind to IgG with one-to-one binding stoichiometry, and there is no known conformational change in FcγR upon binding (Lu et al., 2011). Instead, it has been suggested that clustering of multiple FcγRs on the fluid plasma membrane is necessary for receptor activation (Goodridge et al., 2012). Ultimately, phosphorylation of the FcγR immunoreceptor tyrosine-based activation motif (ITAM), which is controlled by a balance of Src family kinase (SFK) and tyrosine-phosphatase activity, is required for the activation of phagocytosis (Fitzer-Attas et al., 2000; Zhu et al., 2008).
Signaling through phosphorylated ITAMs occurs in macrophages as well as other immune cells, including T-cells (Dushek et al., 2012; McNeill et al., 2007; Zikherman et al., 2010). The kinetic segregation model of TCR signaling, originally formulated by Davis and van der Merwe (Davis and van der Merwe, 1996, 2001, 2006), proposes that the phosphatases CD45 and CD148 are physically excluded from sites of TCR-pMHC binding due to their large extracellular domains, resulting in a local decrease in phosphatase activity around the TCR that leads to phosphorylation and activation of the receptor (Anton van der Merwe et al., 2000; Choudhuri et al., 2005; Cordoba et al., 2013; James and Vale, 2012; Varma et al., 2006). It has been previously proposed that a similar size-dependent mechanism of phosphatase segregation at close contacts between a macrophage and a target cell may trigger FcγR activation (Dushek et al., 2012; Goodridge et al., 2012), but direct evidence is lacking. Furthermore, alternate mechanisms for signaling through FcγR have been reported, including establishment of a diffusion barrier by integrin binding (Freeman et al., 2016) and concentration of SFKs and FcγR into lipid micro-domains (Beekman et al., 2008; Katsumata et al., 2001).
Here we show that antibody-dependent phagocytosis and FcγR signaling is critically dependent on the height of an antibody above the target cell surface and independent of other adhesive interactions with the surface. Using reconstitution of an opsonized target, we find that antigens >10 nm from the target surface do not drive physical segregation of the large phosphatase CD45 and therefore inhibit phagocytosis. This size-dependent FcγR signaling holds true not only for engineered antigens but also for the tumor-expressed CEACAM antigens. Our results suggest that therapeutic mAbs intended to trigger ADCP will be most effective when targeting antigens within 10 nm from the cell surface.
RESULTS
Reconstitution of a cell-like target particle for FcγR-mediated phagocytosis
In order to isolate the mechanism of FcγR signaling in macrophages, we reconstituted a minimal model of an antibody-opsonized target cell-surface in vitro. This model system consisted of glass micro-beads coated with a fluid supported-lipid bilayer (SLB) and antibody (Figure 1A). To bind antibodies close to the bilayer, we incorporated lipids with a biotinylated head-group into the membrane and incubated with a monoclonal anti-biotin IgG1 antibody (anti-biotin IgG). The biotin-bound antibody is able to diffuse fluidly on the membrane surface, emulating diffusion of an antigen on phagocytic targets such as tumor cells. To investigate phagocytosis of these cell-like target particles, we added them to an imaging chamber seeded with RAW 264.7 macrophage-like cells. At the point of contact between an opsonized target particle and a macrophage, we observed a striking enrichment of labeled anti-biotin IgG (Figure 1B), consistent with binding between the surface-bound antibody and macrophage FcγR and subsequent enrichment of the antibody-FcγR complex at the contact site. We observed little to no internalization of non-opsonized target particles but saw robust phagocytosis of target particles that were IgG-opsonized, including internalization of multiple beads per cell (Figure 1C).
Figure 1. Reconstitution of a cell-like target particle for FcγR-mediated phagocytosis.
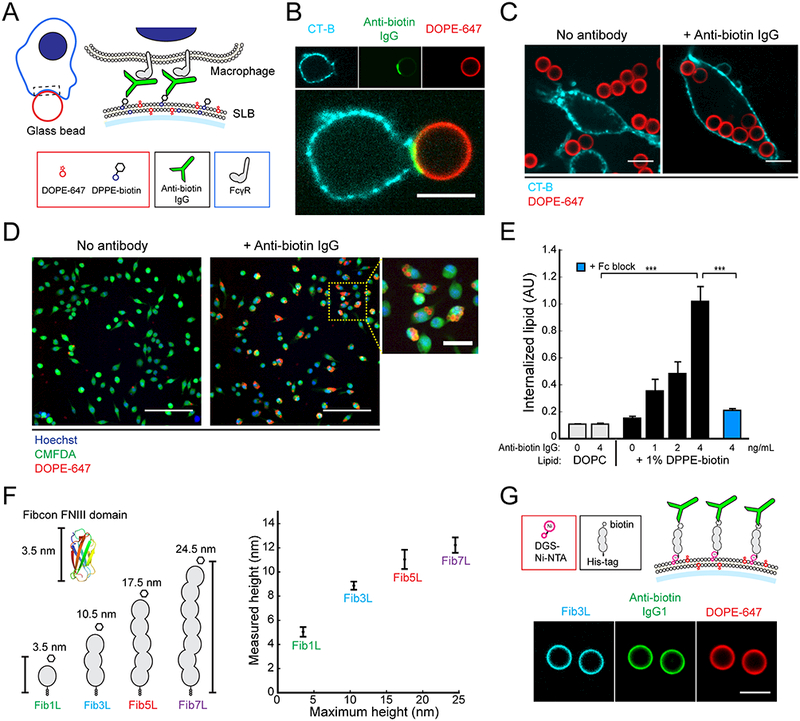
(A) Target particles assembled in vitro from glass beads coated in a fluid supported lipid bilayer (lipid composition: DOPC, 0.2% DOPE-647, up to 2% DPPE-biotin). Anti-biotin IgG in solution binds fluidly to the lipid surface through interaction between the antigen-binding region of IgG and the biotin head-group of DPPE-biotin. Contact between a macrophage and a target particle leads to binding between FcγRs on the macrophage surface and the Fc region of anti-biotin IgG. (B) Confocal fluorescence images (60×) of a RAW 264.7 macrophage-like cell at a contact interface with a 6.46 μm target particle. The macrophage membrane (cyan) is labeled with cholera-toxin B 555. Target particle membrane (red) contains fluorescent DOPE-647. Scale bar is 5 μm. (C) 3.78 μm target particles containing only lipid (left) or pre-incubated with 4 ng/mL anti-biotin IgG (right) are added to a well containing RAW 264.7 cells. Scale bar is 10 μm. (D) Representative confocal fluorescence images (20×) of a field-of-view (FOV) from the imaging-based phagocytosis assay. Cells are labeled with 0.5 μM CellTracker Green (CMFDA) and 10 μg/mL Hoechst 33342. Scale bar is 100 μm for large field of view (FOV), 25 μm for zoom-in. (E) Quantification of fluorescence from internalized beads. Error bars are standard error across 6 independent wells. For each well, internalized lipid is an average quantification of N > 250 cells. P-values are two-sample Student’s T-test, where ***p < .001. (F) A size-variant antigen family is constructed from repeats of the Fibcon synthetic FNIII domain (pdb 3TEU). Proteins in the family are named FiblL, Fib3L, Fib5L, and Fib7L, and in a fully extended configuration have heights of 3.5 nm, 10.5 nm, 17.5 nm, 24.5 nm respectively (‘maximum height’) (left). The distance between the lipid bilayer and the N-terminus of the antigen was measured using a one-dimensional fluorescence localization method (‘measured height’) (right) (see Experimental Procedures). The N-terminal height above the bilayer for FiblL, Fib3L, Fib5L, and Fib7L was 5.0 +/− 0.40 nm, 8.9 +/− 0.34 nm, 11.0 +− 0.8 nm, and 12.2 +/− 0.64 nm respectively. Error bars are standard deviation over N > 12 beads. (G) Fibcon proteins with a C-terminal His-tag were N-terminally labeled with biotin to construct synthetic protein antigens that bind fluidly to a SLB coated bead containing 0.8% DGS-Ni-NTA lipid (top). Confocal fluorescence images (20×) of Fib3L antigen coated and anti-biotin IgG opsonized target particles (bottom). Scale bar is 5 μm. See also Figure SI and Figure S2.
To quantify phagocytosis, we used confocal microscopy to image the internalization of target particles at single-cell resolution. Total SLB fluorescence within a cell was used as a proxy for the amount of phagocytosis. (Figure 1D and E, and Experimental Procedures). Opsonization with anti-biotin IgG was both necessary and sufficient for phagocytosis, as evidenced by the lack of internalization in the absence of antibody or biotinylated lipid. Phagocytosis increased with increasing concentrations of anti-biotin IgG, and could be blocked by incubating macrophages with antibodies (Fc block) against CD16 (FcγRIII) and CD32 (FcγRIIB), demonstrating that internalization of the opsonized SLB-coated beads is FcγR specific (Figure 1E).
Production of size-variant antigens based on a synthetic FNIII domain
Cell-surface molecules often contain repeats of common domains such as Ig and FNIII (A F Williams and Barclay, 1988). To model antigens of different heights on our target particles, we developed a family of size-variant proteins based on repeats of a synthetic FNIII domain (Fibcon), which has a size of ~3.5 nm (Figure 1F) (Jacobs et al., 2012). Each protein consists of repeats of the Fibcon domain with no inter-domain linker. We named the repeat proteins Fib1L, Fib3L, Fib5L, and Fib7L to denote the number of repeated domains. A C-terminal His-tag on each protein enables it to bind nickel-chelating lipids incorporated into the bead SLB, and proteins were expressed and purified in E. coli to exclude glycosylation.
In a fully-extended configuration, we estimate from the crystal structure of the Fibcon domain (PDB 3TEU) that the Fibcon-family proteins have maximum lengths of 3.5 nm, 10.5 nm, 17.5 nm, and 24.5 nm respectively (labeled ‘maximum height’ in Figure 1F). To directly quantify their average extension when bound to an SLB via the His-tag, we developed a single-axis fluorescence localization method to measure the distance between the protein N-terminus and the SLB (Experimental Procedures). Our measurements show that the Fibcon repeat proteins bind to the bilayer in an upright but not fully-extended configuration, as expected for a semi-flexible polymer, with measured heights of 5.0 +/− 0.40 nm, 8.9 +/− 0.34 nm, 11.0 +/− 0.8 nm, and 12.2 +/− 0.64 nm respectively (labeled ‘measured height’ in Figure 1F). We further confirmed the relative size of the Fibcon-family proteins with calibrated gel filtration (Figure S1A).
To construct antigens with identical height-defined epitopes, we incorporated an N-terminal YBBR tag for site-specific enzymatic modification and used SFP synthase to enzymatically couple biotin-CoA to the proteins (Figure S1A and B). The result was a family of size-variant antigens that diffuse freely on the minimal target particles and can be bound by anti-biotin IgG (Figure 1G).
Phagocytosis of antibody-opsonized target particles is antigen-height dependent
To determine the impact of antigen height on phagocytosis, we quantified phagocytosis of target particles (3.78-μm diameter) bound with biotinylated Fib1L, Fib3L, Fib5L, and Fib7L protein antigens opsonized with anti-biotin IgG (Figure 2A and Figure S1D). Strikingly, we observed decreasing phagocytosis with increasing antigen height; macrophages efficiently internalized beads coated with Fib1L antigen, while phagocytosis was significantly impaired against Fib3L antigen and nearly absent for Fib5L and Fib7L antigen coated beads (Figure 2B). Using fluorescence correlation spectroscopy, we determined the antibody surface concentration to be approximately 100 molecules/μm2 (Figure S1F). We confirmed that antibody surface concentration was equal for each bead, regardless of antigen, using flow cytometry (Figure S1C). Therefore, differences in Fibcon-family antigen lengths - not antibody surface concentration - were responsible for the observed decrease in phagocytosis.
Figure 2. Phagocytosis of antibody-opsonized target particles is antigen-height dependent.
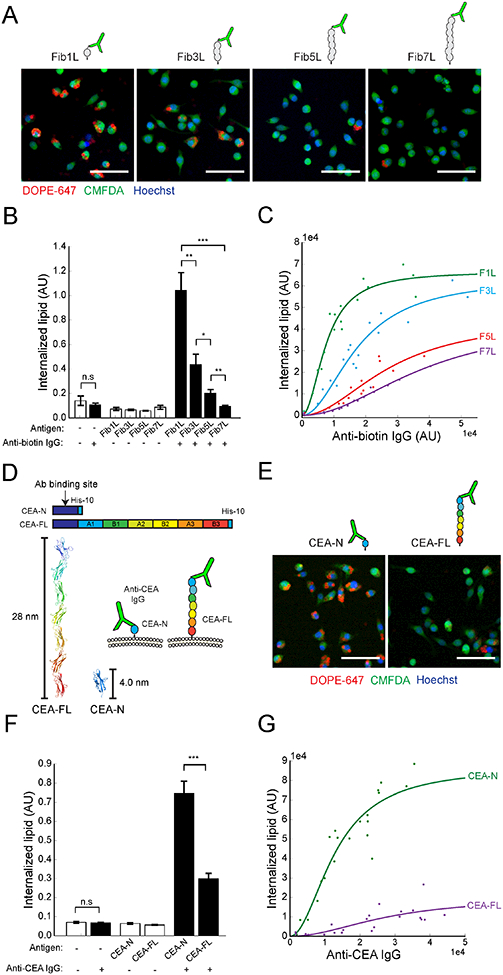
(A) Representative confocal fluorescence images (20×) of phagocytosis of target particles bound with biotinylated FiblL, Fib3L, Fib5L, and Fib7L protein antigen and opsonized with 4 ng/mL anti-biotin IgG. Cells are labeled with 0.5 μM CellTracker Green (CMFDA) and 10 μg/mL Hoechst 33342. Scale bar is 50 μm. (B) Microscopy quantification of phagocytosis for Fib1L, Fib3L, Fib5L, and Fib7L target particles. Error bars represent standard error across 9 independent wells. For each well, internalized lipid is an average quantification of N > 330 cells. P-values are two-sample Student’s T-test, where *P < 0.05, **P < 0.01, ***p < 0.001. (C) Flow-cytometry quantification of phagocytosis for Fib1L, Fib3L, Fib5L, and Fib7L targets at increasing anti-biotin IgG concentrations. Data points corresponds to an independent well with N > 8000 cells. IgG fluorescence intensity (anti-biotin IgG, Alexa Fluor 488) was pre-measured via flow cytometry from a sample of target particles (N > 3500 beads). Each set of data points is fit with a hill equation with a coefficient of 2 using the equation f(x) = (ymax*x2) / (kd + x2). (D) Full-length CEACAM5 (CEA-FL, 28.0 nm) and truncated CEACAM5 consisting of the N-terminal domain (CEA-N, 4.0 nm). A pan-CEACAM IgG1 antibody (anti-CEA IgG) (D14HD11) binds to the shared N-terminal domain. (E) Representative confocal fluorescence images (20×) of phagocytosis of target particles bound with CEA-N and CEA-FL antigen opsonized with 4 ng/mL anti-CEA IgG. Cells are labeled with 0.5 μM CellTracker Green (CMFDA) and 10 μg/mL Hoechst 33342. Scale bar is 50 μm. (F) Microscopy quantification of phagocytosis for CEA-N and CEA-FL target particles. Error bars are standard error across 9 independent wells. For each well, internalized lipid is an average quantification of N > 420 cells. P-values are two-sample Student’s T-test, where ***p < 0.001. (G) Flow-cytometry quantification of phagocytosis for CEA-N and CEA-FL targets across a range of bound anti-CEA IgG concentrations. IgG fluorescence intensity (anti-CEA IgG, PE) was pre-measured via flow cytometry from a sample of beads (N > 3500 beads). Each set of data points is fit with a Hill equation with a coefficient of 2 using the equation f(x) = (ymax*x2) / (kd + x2).
Since phagocytosis is known to be modulated by antibody concentration (Ben M’Barek et al., 2015), we investigated whether the observed antigen height-dependent phagocytosis was unique to one concentration. Using flow cytometry, we assayed phagocytic efficiency across a range of anti-biotin IgG concentrations for each antigen. While all antigen heights show increased phagocytosis with increasing concentrations of anti-biotin IgG, the data reveals a consistent size-dependent effect on phagocytosis, with dramatically reduced sensitivity as a function of antibody concentration for Fib5L and Fib7L (Figure 2C). Our data suggest that short antigens promote efficient phagocytosis, while antigens that are >10 nm have severely diminished phagocytic capacity.
Phagocytosis of CEACAM antibody opsonized target particles is antigen-height dependent
We next explored whether antigen height dependence is unique to our synthetic proteins or a more general property of antibody-dependent phagocytosis. To address this, we used members of the CEACAM family of cell-surface proteins, which are associated with tumor progression and include both short and tall antigens (Beauchemin and Arabzadeh, 2013). We expressed and purified full-length CEACAM5 (CEA-FL, 28.0 nm estimated height) and a truncated version of CEACAM5 consisting of only the N-terminal domain (CEA-N, 4.0 nm estimated height) (Figure 2D and Figure S2A) (Korotkova et al., 2008). We selected a pan-CEACAM IgG1 antibody (anti-CEA IgG) that binds directly to the N-terminal domain of CEACAM5 (Figure S2B) so that target membranes coated with CEA-FL or CEA-N could be opsonized in the same way as our synthetic antigens.
Consistent with the Fibcon-family antigen experiments, we found that target particles with short CEA-N were efficiently internalized, while phagocytosis of particles with long CEA-FL were significantly reduced (Figure 2E, F). Confocal images of cells acquired during the phagocytosis reveal that multiple beads-per-cell were internalized for CEA-N target beads, while CEA-FL target beads bound to the cell surface but were not internalized. (Figure S2D). Using flow-cytometry, we again confirmed that equal surface concentrations of antibody were bound to CEA-FL and CEA-N coated target particles (Figure S2C). We assayed phagocytic efficiency across a range of concentrations of anti-CEACAM and observed that while phagocytosis increases with increasing antibody concentration for both antigens, the increase is significantly greater for CEA-N (Figure 2G). We conclude that antibody-dependent phagocytosis of CEACAM-family antigens is dependent on antigen height, consistent with our Fibcon-family antigen results.
Visualization of early Fc receptor signaling prior to phagocytosis
Our experiments with variable height antigens show a consistent and significant decrease in FcγR-mediated phagocytosis with increasing antigen height, in the absence of integrin engagement or other adhesive interactions. This indicates either a reduction in activation of the FcγR or a reduction of signal transduction downstream of the receptor. The first signaling event after FcγR-antibody binding is phosphorylation of the receptor’s ITAM motif by Src family kinases (SFK), followed by recruitment of Syk kinase to the ITAM via its tandem SH2 domains (Crowley et al., 1997). To test whether antigen height-dependent phagocytosis linked to changes in ITAM signaling, we imaged the distribution of phosphotyrosine on cells fixed during phagocytosis of a target particle with a short antigen, Fib1L, and a long antigen, Fib 7L. Visualization of nascent phagocytic cups by immunofluorescence revealed enrichment of ITAM tyrosine phosphorylation at the contact site for the Fib1L but no phosphorylation for the Fib7L (Figure S3A).
To image the dynamics of ITAM phosphorylation, we developed a live-cell protein-based ITAM phosphorylation sensor that is specific to phosphorylated ITAM (pITAM). The pITAM sensor is formed from the tandem SH2 domains of Syk kinase, which are known to mediate binding of Syk to the pITAM (Turner et al., 2000), and an N-terminal fusion with mCherry (Figure 3A and S3B, Supplementary Video 2). We established a stable RAW 264.7 cell line expressing pITAM sensor under the control of a constitutive weak promoter UBC to prevent competition with endogenous Syk and to reduce signal background (Qin et al., 2010). We replaced the SLB-coated target particles, which geometrically limit our ability to spatially resolve FcγR organization, with an SLB-coated coverslip (emulating the target surface) that permits high-resolution imaging with Total Internal Reflection Fluorescence (TIRF) microscopy (Figure 3B). Upon contact between cells expressing the pITAM sensor and a target surface coated with anti-biotin IgG opsonized Fib1L, we found that the sensor is rapidly recruited from the cytoplasm to antibody-FcγR clusters at the membrane interface (Figure 3C top, and S3C). The pITAM sensor dissociates from these clusters within seconds upon addition of the Src kinase inhibitor PP2, consistent with sensor-specificity for phosphorylated ITAM (Figure S3D). The phosphorylated antibody-FcγR clusters range in size from sub-diffraction limited (< 200 nm) to a few micrometers in size, and they are distributed across the contact interface of the macrophage (Figure 3C).
Figure 3. Fc receptor phosphorylation decreases with increasing antigen height.

(A) A live-cell sensor of ITAM phosphorylation (pITAM sensor). The sensor consists of a N-terminal mCherry fluorescent protein flexibly linked to the tandem-SH2 domains of Syk kinase. Upon phosphorylation of FcγR ITAM by Src family kinases, the sensor protein is recruited to the phosphorylated ITAM through the tandem-SH2 domains. (B) TIRF microscopy of the interface between a macrophage and an antibody opsonized planar supported lipid bilayer enables high-resolution visualization of protein spatial organization at the contact site. (C) TIRF microscopy (lOOx) images of the contact interface between a macrophage and a supported lipid bilayer bound with Fib1L (top) or Fib7L antigen and opsonized with anti-biotin IgG. Scale bar is 10 μm. (D) Quantification of TIRF signal from pITAM sensor across the membrane-contact area at macrophage-SLB contact sites for FiblL, Fib3L, Fib5L, and Fib7L bound SLBs. Error bars are standard deviation over N > 180 cells from three independent trials. P-values are two-sample Student’s T-test on the mean value from independent trials, where **P < 0.01. (E) Quantification of mean TIRF signal from anti-biotin IgG (Alexa Fluor 488) from high-intensity clusters within the membrane-contact area at macrophage-SLB contact sites for Fib1L and Fib7L bound SLBs. Error bars are standard deviation from N > 18 cells. P-values are two-sample Student’s T-test, where ***p < 0.001. (F) TIRF images of antibiotin IgG (green, Alexa Fluor 488) and pITAM sensor (red) at macrophage-SLB contacts for Lat-A treated cells (left). Quantification of TIRF signal from pITAM sensor across the membrane-contact area at macrophage-SLB contacts for Lat-A treated cells (right). Scale bar is 10 μm. Error bars are standard deviation over N > 600 cells from three independent trials. P-values are two-sample Student’s T-test on the mean value from independent trials, where *P < 0.05. (G) Quantification of TIRF signal from pITAM sensor across the membrane-contact area for Lat-A treated cells contacting SLBs bound with CEA-N and CEA-FL antigen and opsonized with anti-CEA IgG. Error bars are standard error over 3 independent wells with mean intensity computed from N > 200 cells for each well. P-values are two-sample Student’s T-test on the mean value from independent trials, where *P < 0.05. See also Figure S3.
Fc receptor phosphorylation decreases with increasing antigen height
We next asked whether phosphorylation of the FcγR ITAM changes systematically with antigen height. To answer this, we used TIRF microscopy to quantify membrane-localized sensor fluorescence intensity at the macrophage-contact interface after cell spreading on a planar SLB coated with antibody-opsonized Fibcon-family antigens. We found that the level of pITAM sensor recruitment decreases significantly between Fib1L and Fib3L antigen, with recruitment dropping to near background levels for Fib5L and Fib7L (Figure 3C, D). We also noted that while anti-biotin IgG clusters at both Fib1L and Fib7L opsonized surfaces, there was a slight decrease in anti-biotin IgG concentration within these clusters for Fib7L antigen (Figure 3E).
Small clusters of antibody-FcγR can be seen in the TIRF microscopy movies of the macrophage-opsonized surface trafficking inward from the periphery of the cell (Supplementary video 1), consistent with interactions between FcγR and the actin cytoskeleton that have been previously described (Freeman et al., 2016; Jaumouillé and Grinstein, 2011). Interestingly, the decrease in pITAM sensor recruitment with increase in antigen height was still evident in Latrunculin A treated cells, suggesting that interactions between FcγR and the cortical actin cytoskeleton is not necessary for receptor phosphorylation (Figure 3F). We also observed a decrease in FcγR ITAM phosphorylation in cells interacting with tall CEA-FL relative to short CEA-N antigen (Figure 3G), indicating that size-dependent phosphorylation of FcγR ITAMs is not unique to a single family of antigens.
Receptor activation is dependent on height rather than receptor density
Since total concentration of antibody on a target particle can modulate phagocytosis (Figure 1E, 2C, 2G), we asked whether differences in effective concentration of FcγR within clusters for antigens of different heights could be responsible for the size-dependent signaling we see. To quantify the concentration of antibody-FcγR complexes in clusters formed with Fib1L and Fib7L antigens, we measured the average intensity of anti-biotin IgG within these clusters (Figure 3E). We found that for Fib7L antigens, the average concentration of clustered anti-biotin IgG was slightly lower compared to Fib1L antigens. This result could be explained by a size-dependent decrease in the twodimensional receptor-ligand affinity due to increasing conformational freedom of the antigen, which has been predicted and modelled physically, as well as observed at the T-cell immunological synapse (Milstein et al., 2008; Wu et al., 2011).
To determine if reduced receptor density could be explained by a decrease in receptor-ligand affinity with increasing antigen height, we formed giant plasma membrane vesicles (GPMVs) from detached cellular-membrane blebs. These GPMVs have a lipid and membrane protein composition similar to the plasma membrane, but they lack a cortical actin cytoskeleton and membrane cortex attachments. We isolated GPMVs from RAW 264.7 cells and added them to SLBs with antibody-opsonized Fibcon-family antigens (Figure 4A). The GPMVs settled onto the SLBs and formed planar footprints, with anti-biotin IgG bound to FcγR clearly enriched at the interface (Figure 4B). We quantified the relative two-dimensional receptor-ligand affinity of the FcγR to the different sized Fibcon-IgG by taking the intensity ratio between regions beneath the GPMVs and regions of the SLB background, a quantity that we term the ‘enrichment index’ (Schmid et al., 2016). Although we observed significant enrichment of anti-biotin IgG at the interface for each antigen, consistent with FcγR binding, the data indicated only a slight decrease in receptor-ligand affinity with increasing antigen height (enrichment index: Fib1L = 9.60 +/− 2.30, Fib3L = 8.31 +/− 1.44, Fib5L = 7.26 +/− 1.33, Fib7L = 6.82 +/− 0.99) (Figure 4C).
Figure 4. Receptor activation is dependent on height rather than receptor density.

(A) Giant plasma membrane vesicles (GPMVs) are formed by treating adhered macrophages to induce membrane blebbing and vesiculation. GPMVs dropped onto an opsonized supported lipid bilayer triggers binding between FcγR in the GPMVs and antibody on the SLB. (B) TIRF microscopy (lOOx) images of GPMV-SLB contacts at anti-biotin IgG opsonized SLBs for Fib1L, Fib3L, Fib5L, and Fib7L show a decrease in anti-biotin IgG (green, Alexa Fluor 488) intensity at the contact site with increasing antigen height. Anti-biotin IgG enrichment is calculated as the ratio of intensity within the GPMV-SLB contact site (in) and outside the contact site (out). Scale bar is 5 μm. (C) Quantification of anti-biotin IgG enrichment at GPMV-SLB contacts for Fib1L, Fib3L, Fib5L, and Fib7L bound SLBs. Error bars are standard deviation over N > 180 GPMVs from three independent trials. P-values are two-sample Student’s T-test on the mean value from independent trials, where *P < 0.05. (D) Quantification of pITAM sensor intensity in TIRF as a function of anti-biotin IgG at single GPMV contacts for Fib1L and Fib7L bound SLBs. Points are binned along the x-axis into three equally spaced bins by Anti-biotin (AU) value. Error bars are standard error over a minimum of 4 and a maximum of 13 binned cells. P-values are two-sample Student’s T-test on the mean value from independent trials, where **P < 0.01.
To exclude the possibility that the slight decrease in receptor-ligand affinity is sufficient to account for our observation of antigen size-dependent ITAM phosphorylation, we incubated macrophages with the pITAM sensor on antibody-opsonized Fib1L and Fib7L surfaces and quantified single-cell anti-biotin IgG intensity relative to pITAM sensor recruitment (Figure 4D). Despite cell-to-cell variations, pITAM sensor recruitment to Fib1L-IgG is significantly higher than to Fib7L-IgG across the entire range of anti-biotin IgG concentration observed in the wild-type macrophage population, suggesting that the small change in receptor concentration alone cannot explain the decreased phosphorylation for tall antigens. As a further check, we renormalized the antibody concentration axis of our plot of Fibcon-family antigen-coated particle phagocytosis (Figure 2C) by the enrichment index for each antigen (Figure S1E). Interestingly, the renormalization caused the Fib5L and Fib7L trends to collapse onto a similar curve, suggesting that the difference in phagocytic efficiency between these antigens may be explained by differences in their affinity due to height. However, the phagocytic response of the Fib1L and Fib3L remain significantly different, with the strongest response observed for the shortest Fib1L antigen, indicating a clear dependence of phagocytosis on antigen size rather than affinity or density.
Phosphatase exclusion from antibody-FcγR clusters is antigen-height dependent
Phosphorylation of the FcγR ITAM is reversed by receptor-tyrosine phosphatases CD45 and CD148 (Zhu et al., 2008). To investigate how inhibitory phosphatases are spatially organized on the membrane relative to enriched antibody-FcγR, we used labeled antibodies to image the distribution of CD45 at the interface between a macrophage and an SLB bound with antibody-opsonized Fibcon-family antigens. TIRF images revealed striking segregation of anti-biotin IgG from CD45 when macrophages engaged with a Fib1L opsonized surface (Figure 5A, Supplementary Video 3). In contrast, we observed no segregation of CD45 from anti-biotin IgG clusters on a Fib7L opsonized surface (Supplementary Video 4). We note that domains of CD45 segregation, which colocalize with antibody-FcγR clusters, are small (nanometers to microns in scale) and distributed across the contact interface.
Figure 5. Phosphatase exclusion from antibody-FcγR clusters is antigen-height dependent.

(A) Live-cell TIRF microscopy (100×) images at the macrophage-SLB contact interface for SLBs bound with FiblL and Fib7L opsonized with anti-biotin IgG. For FiblL SLBs (top), anti-biotin IgG (green, Alexa Fluor 488) is clustered at the cell-SLB interface, while CD45 (red, anti-CD45 Alexa Fluor 647) is segregated from IgG clusters. A line-scan through a region of the interface shows an anti-correlation between anti-biotin IgG and CD45 localization. For Fib7L SLBs (bottom), anti-biotin IgG is similarly clustered at the cell-SLB interface, however CD45 is not segregated from high-intensity IgG clusters. A line-scan through a region of the interface shows correlation between anti-biotin IgG and CD45 localization. Scale bar is 15 μm. (B) TIRF microscopy (100×) images at the GPMV-SLB contact interface for SLBs bound with DPPE-biotin, FiblL, Fib3L, Fib5L, and Fib7L antigens. Anti-biotin IgG (green, Alexa Fluor 488) is enriched at the contact interface for each antigen. CD45 (red, anti-CD45 Alexa Fluor 647) is excluded in a size-dependent manner from DPPE-biotin and FiblL, but not Fib3L, Fib5L, and Fib7L, GPMV-SLB contacts. Scale bar is 5 μm. (C) Quantification of the Pearson’s correlation coefficient between anti-biotin IgG (green) and anti-CD45 (red) channels for individual GPMV-SLB contacts. CD45 segregation, corresponding to a Pearson’s correlation coefficient of ~0, is evident for DPPE-biotin and FiblL antigens, but not for Fib3L, Fib5L, and Fib7L GPMV-SLB contacts. Box and whiskers denote inner quartile range and full range excluding outliers (> 1.5 quartile range). (D) Model of size-dependent segregation of CD45 at contact sites formed by FcγR-IgG binding. The FcγR-IgG complex spans ~11.5 nm, while CD45RO is ~22.5 nm tall. The membrane-membrane distance enforced by the FcγR-IgG-FiblL complex is ~15.0 nm.
We next asked whether CD45 was physically excluded from close membrane-membrane contacts formed by antibody-FcγR binding due solely to steric interaction between its large extracellular domain and the cell membranes. To quantify the ability of the membrane-interface to exclude large proteins, we again turned to GMPVs and generated interfaces between GPMVs and planar SLBs for each of the Fibcon-family antigens. TIRF images of the interface show that CD45 is almost completely excluded from the membrane interface for both an anti-biotin IgG opsonized lipid (DPPE-biotin) and Fib1L antigen (Figure 5B). However, interfaces formed with Fib3L antigens were populated by freely diffusing CD45, with similar results for Fib5L and Fib7L antigens. Co-localization analysis revealed a size-dependent segregation threshold, with antigens Fib3L (estimated height 10.5 nm) and taller antigens failing to exclude CD45 (Figure 5C).
We have previously shown that proteins >5 nm taller than a membrane interface are excluded from the reconstituted membrane interfaces due to steric interaction with the membranes (Schmid et al., 2016). To determine if our experimental results are consistent with exclusion of CD45, we computed the size of each Fibcon-family antigen-IgG-FcγR complex by adding the extended height of the antigen to the distance between the base of FcγR and the antigen-binding site of an IgG antibody (11.5 nm) (Lu et al., 2011) (Figure S5), and compared this to the height of CD45RO (PDB 5FMV, 22.5 nm), which is the sole isoform expressed in RAW 264.7 cells (Chang et al., 2016) (Figure 5D). The membrane interface distance formed by cells binding to opsonized lipid (~11.5 nm) and opsonized Fib1L (~15 nm) are both significantly shorter than CD45RO and are thus predicted to exclude CD45RO from the interface, while cells binding to opsonized Fib5L and Fib7L (~27 nm and ~36 nm, respectively) are taller and not predicted to exclude CD45RO, with opsonized Fib3L interfaces (~22 nm) predicted to show only partial exclusion. These predictions are entirely consistent with the GPMV data and support a size-dependent mechanism of CD45 segregation, with an antigen height threshold of ~10 nm.
Truncation of the CD45 ectodomain using CRISPR/Cas9 disrupts phagocytosis
If segregation of CD45 is necessary for FcγR phosphorylation and phagocytosis, then we expect that decreasing the size of the CD45 ectodomain would decrease phagocytic efficiency against antibody-bound short antigens. To test this without altering the endogenous balance of phosphatase and kinase activity, and to avoid overexpression artifacts, we developed a strategy for truncating the ectodomain of endogenous CD45 using CRISPR/Cas9 (Figure 6A and Figure S4). Using two independent guide RNAs, we targeted the intronic region downstream of the first coding exon (containing the start codon and the signal peptide) and a separate intronic region directly upstream of an exon coding for the D3 FNIII domain. Excision followed by repair via non-homologous end joining resulted in a gene coding for CD45 protein with a truncated ectodomain, containing only the two final FNIII domains D3-D4. The ectodomain of this protein (CD45 D3-D4) is predicted to be 7.0 nm tall (based on analysis of full-length CD45, 5FN6), which is short enough to disrupt segregation of CD45 at a contact-interface formed through Fib1L.
Figure 6. Truncation of the CD45 ectodomain using CRISPR/Cas9 disrupts phagocytosis.

(A) Truncation of the CD45 ectodomain using CRISPR/Cas9 genome editing. Dual cutting by independent guide RNAs within intronic regions flanking the first coding exon results in excision of the genomic region coding for the variable mucin domain and dl-d2 FNIII domains of CD45. Repair by non-homologous end-joining results in a gene coding for CD45 with a truncated ectodomain and the native transmembrane domain and tandem phosphatase domains of CD45. (B) Confocal fluorescence images (60×) of CD45 wild-type RAW 264.7 cells (left) and CD45 D3-D4 RAW 264.7 cells (right) incubated with FiblL antigen and anti-biotin opsonized target particles. Scale bar is 20 μm. (C) Quantification of phagocytosis for CD45 wild-type and CD45 D3-D4 cells. Error bars are standard error over 3 independent wells. For each well, internalized lipid is an average quantification of N > 250 cells. P-values are two-sample Student’s T-test, where ***p < 0.001. (D) A model of the inhibition of phagocytosis by CD45 D3-D4. Truncation of the CD45 ectodomain reduces its height from −22.5 nm to −7.0 nm. An interface formed by FcγR-IgG-FiblL binding spans −15.0 nm, which is sufficiently close to segregate wild-type CD45, reducing the local concentration of the phosphatase at sites of FcγR-IgG and triggering phosphorylation and activation of the macrophage. However, CD45 D3-D4 is −8 nm shorter than the interface, and thus is not segregated from the contact site. The failure to segregate CD45 D3-D4 upon FcγR-IgG binding leaves a higher local concentration of CD45 phosphatase at the contact site, suppressing phosphorylation and inhibiting phagocytosis. See also Figure S4 and Figure S5.
We then compared the phagocytosis of a population of CD45 D3-D4 cells to wild-type CD45 cells. Truncation of the CD45 ectodomain significantly reduced phagocytosis of the short Fib1L antigens opsonized with anti-biotin IgG (Figure 6B-C). Microscopy images of cells collected during the process of phagocytosis show multiple beads bound to the cell periphery of the truncated CD45 D3-D4 cells, with dramatically reduced internalization relative to the full-length CD45RO cells, consistent with disrupted phagocytosis. Taken together, our results show that antigen size critically determines the success of antibody-dependent phagocytosis through size-dependent CD45 exclusion leading to FcγR phosphorylation. By differentially segregating kinase and phosphatase activity during interactions with opsonized targets, macrophages translate physical close contact into biochemical recognition and downstream activation.
DISCUSSION
Antibodies have become vital therapeutic agents for battling cancer, autoimmune diseases, and neurodegenerative diseases (Nimmerjahn and Ravetch, 2008; Waldmann, 1991). As a result, understanding how antibodies direct immune effector cell function, and how they might be targeted to promote desired behavior, has become increasingly important. Previous work has shown that biochemical properties of the antibody Fc domain, such as isotype and glycosylation, can produce divergent immune responses due to changes in binding specificity and affinity for activating and inhibitory Fc receptors (Jefferis, 2009; Nimmerjahn and Ravetch, 2005).
In this work, we demonstrate that antibody-dependent phagocytosis is controlled by the height of an antibody above the target-cell surface through changes in both Fc-receptor accumulation and phosphorylation. Our results are consistent with the kinetic segregation model of T-cell activation (Davis and van der Merwe, 1996, 2001, 2006; Shaw and Dustin, 1997; Wild et al., 1999), where elegant studies reconstituting the T-cell signaling network have provided evidence that the size-dependent segregation of the phosphatase CD45 from the TCR complex is necessary for T-cell activation (Carbone et al., 2017; Chang et al., 2016; Choudhuri et al., 2005; James and Vale, 2012). However, while TCR activation occurs through a receptor-ligand complex with defined binding geometry and characteristic height (15 nm) (Davis and van der Merwe, 2006), the height of the antigen-antibody-FcγR complex depends on both antigen height and antibody binding site, and thus naturally span a broad range of membrane-interface distances.
Our work showing antibody-dependent phagocytosis in the absence of additional adhesions differs from the recent observations of Freeman et al. (Freeman et al., 2016), who found that integrins and the cytoskeleton form a diffusion barrier required for segregation of CD45. Importantly, the model target surface used by Freeman et al. is a layer of immobilized antibody on a surface that limits the density of FcγR that can accumulate at a given point on the membrane. However, if both the antibody and FcγR are capable of diffusion, as is the case for cell-surface tumor antigens such as CD20 and Her2, the local density of the FcγR can increase significantly at the membrane interface. Our results with a freely-diffusing antigen suggest that enrichment of antibody-FcγR at contact sites on a fluid membrane is sufficient to activate phagocytosis, without requiring integrins to bridge low-density points of contact or an actin-based diffusion barrier to exclude CD45. These observations are consistent with previous evidence showing that knockdown of talin, which disrupts complement-dependent phagocytosis via the αMβ2 integrin, has no effect on FcγR-mediated phagocytosis (Lim et al., 2007).
Given the role we identify for antigen size, we wondered if mAbs that are successful in clinical trials and approved for use might be biased towards those targeting short antigens or membrane-proximal epitopes, which would give them the potential to act through FcγR-dependent ADCP and ADCC. Interestingly, nearly all of the target antigens for clinically approved mAbs are small (< 10 nm) cell-surface proteins (CD19, CD20, CD33, CD38, CD52, CTLA-4, EpCAM, PD-1, PD-L1), based on the available information (Gül and van Egmond, 2015) (Supplementary Table 1).
Our work supports the idea that size-dependent physical segregation is a general phenomenon across multiple immune cells, including KIR family receptors and NKG2D on NK cells (Brzostek et al., 2010; Deng et al., 2015; Köhler et al., 2010), C-type lectin receptors on macrophages and dendritic cells (Goodridge, 2011), and CD28 family checkpoint receptors CTLA-4 and PD-1 (Yokosuka et al., 2010, 2012). Activation by size-dependent segregation has broad implications for antigen selection, including for bispecific antibodies and chimeric antigen receptors targeting cytotoxic T-cells and NK cells to tumors, as well as for mAb-guided phagocytes and NK cells (Cleary et al., 2017). Whether B cell receptor signaling through the ITAM-bearing CD79a/b could bias the selection of the natural antibody repertoire by size remains to be explored. Finally, our study demonstrates that small changes in membrane-membrane distance or protein height can have a large effect on protein localization at cell-cell contacts, a principle that could potentially be harnessed to engineer interfaces to counteract immune evasion.
STAR METHODS
Contact for reagent and resource sharing
Further information and requests for reagents may be directed to and will be fulfilled by the Lead Contact Daniel A. Fletcher (fletch@berkeley. edu).
EXPERIMENTAL MODEL AND SUBJECT DETAILS
RAW 264.7 cells
This murine, male, macrophage-like cell line was maintained in RPMI 1640 medium with 10% fetal bovine serum (FBS, Life Technologies), 1% Pen-Strep (Life Technologies), at 37°C, 5% CO2. Cells were negative for mycoplasma as verified with Mycoalert mycoplasma detection kit (Lonza).
METHOD DETAILS
Preparation of minimal target cell.
Target cells (target particles) were generated by coating glass beads with a fluid supported lipid bilayer, to which antigens with specific antibody binding sites were attached. The individual steps are described in detail below.
Small unilamellar vesicles (SUVs)
SUVs were prepared by rehydrating a lipid film composed primarily of POPC, doped with up to 2% of DPPE-biotin or DGS-NI-NTA and 0.8% DOPE-647 in pure deionized H20. The rehydrated solution was vortexed briefly, sonicated at low-power (20% of max) using a tip-sonicator, and finally filtered through a 200 nm PTFE filter (Millipore). Solutions of SUVs were stored on ice and used within 48 hours to avoid phospholipid oxidization.
Supported-lipid bilayer (SLB) coated glass beads
40 μL of 3.78 μm glass bead (Bangs labs) slurry (10% solids) were cleaned using a 3:2 mixture of H2S04:H202 (Piranha), and clean beads were spun down at 1000 G and washed 3 times before being resuspended in 400 μL of pure water. Clean beads were stored in water at room temperature and used within 48 hours. To assemble supported-lipid bilayers (SLBs), 20 μL of SUV solution was diluted in 80 μL of MOPS buffer (25 mM MOPS pH 7.4, 125 mM NaCl,), and 10 μL of clean bead slurry were added and mixed gently by pipetting. The bead/SUV mixture was incubated for 15 minutes at room temperature while rotating continuously to reduce bead sedimentation. Beads were spun down gently at 50 G for 1 minute, and SUV solution was carefully removed and replaced with PBS (Phosphate Buffered Saline, Corning). The fluidity of the lipid-bilayer was assessed by imaging beads deposited on a glass coverslip with a spinning-disk confocal microscope (Nikon) at 60× magnification and high laser power, where diffusion of single-molecules of labeled lipid was visible after photo-bleaching a small region-of-interest.
Antibody-opsonized target particles
SUV mixtures with up to 2% DGS-Ni-NTA were used to prepare SLB-coated beads. To prepare target particles, beads were incubated with 50 nM of recombinant protein antigen containing a C-terminal 10-His tag for 15 minutes. The protein binds fluidly to the surface via the Nickel-His interaction, and the interaction of one-protein with up to ten DGS-Ni-NTA lipids lead to nearly irreversible attachment (Chikh et al, 2002). To prepare opsonized target particles, anti-biotin IgG was added at .1-.5 ug/mL and incubated along with the protein, such that the anti-biotin IgG bound fluidly to the surface via interaction with the His-tagged protein.
Quantification of antibody surface concentration
Fluorescence correlation spectroscopy was used to quantify the surface concentration of antibodies on the target particle surface. SLB coated coverslips were made with a series of lipids containing small fractions of DOPE-488. Fluorescence correlation spectroscopy was used to quantify the number of fluorophores present in the SLBs and TIRF images were captured of the same SLBs. A calibration curve was created to correlate TIRF intensity values with absolute fluorophore numbers. Using this method, an SLB made using 2% DGS-Ni-NTA, 50 nM protein antigen, and 125 ng/mL anti-biotin IgG were found to have 80 antibodies/μm2 (Figure S1). Additionally, antibody-opsonized target particles were analyzed using flow cytometry in combination with calibrated beads with known numbers of fluorophores (Bangs Laboratories), which measured the antibody surface density at 120 antibodies/μm2 (Figure S1).
Size-variant protein antigens.
Two families of proteins were prepared and bound to the supported lipid bilayer of the target particles to present an antibody at a known distance from the membrane.
Design of Fibcon repeat proteins (Fib1L-Fib7L)
The FNIII domain occurs with high frequency in cell-surface proteins, where it is often linked together in an N-C topology to create proteins with extended height (Doolittle, 1995). We designed a family of synthetic proteins that similarly rely on the FNIII domain to generate height. The Fibcon domain is a high-stability FNIII domain designed through multiple-sequence alignment (Jacobs, 2012). The DNA sequence coding for the Fibcon protein was ordered as a synthesized gene fragment (Integrated DNA Technologies). Repeats of the Fibcon sequence were cloned into a pET28b vector (EMD Millipore) for expression in E. coli cells with no linker region via Gibson assembly (Gibson et al, 2009). The Fibcon repeat sequence was flanked by an N-terminal YBBR peptide (Yin et al, 2005) and a C-terminal His-10 followed by a KCK sequence for chemical labeling, and it was terminated with an additional His-6 sequence.
Fibcon family protein expression and purification
All proteins were expressed in Rosetta DE3 competent cells (EMD Millipore). Cells were grown at 37 °C to OD = 0.8, induced with 0.3 mM IPTG (Isopropyl β-D-1-thiogalactopyranoside, Calbiochem) overnight at 18 °C. Cells were harvested and resuspended in 25 mM HEPES pH 7.4 (4-(2-hydroxyethyl)-1-piperazineethanesulfonic acid, Fisher Scientific), 150 mM NaCl (Fisher Scientific), 0.5 mM TCEP (tris(2-carboxyethyl)phosphine, Fisher Scientific) and 10 mM imidazole (Sigma Aldrich), and lysed by freeze thawing and sonication. The lysate was centrifuged for 45 min at 20,000g, affinity purified over a His-Trap HP column (GE Healthcare) through imidazole gradient elution on an AKTA Pure (GE Healthcare) system. Peak fractions were concentrated and gel-filtered via a Superdex 200 column into 25 mM HEPES pH 7.4, 150 mM NaCl, 0.5 mM TCEP. Proteins were concentrated, and purity was assayed on an SDS page gel. To compare Fib1L, Fib3L, Fib5L, and Fib7L proteins, the protein molecular weight was verified by an elution shift during gel-chromatography from a calibrated Superdex 75 10/300 GL column (Figure S1).
Height measurement of Fibcon-family antigens
In order to accurately quantify the height of the Fibcon family antigens when bound to the membrane, Fibcon proteins were fluorescently labeled at the N-terminus and bound via C-terminal his-tag to glass beads coated in a fluorescent lipid bilayer. The bead was immobilized on glass surface to minimize vibration during imaging. Confocal images of the bead’s equatorial plane were repeatedly captured while fluorescence of protein and lipid were being illuminated alternatively, collecting the positions of fluorophores from proteins and lipids simultaneously at the bead’s equatorial plane, which due to the confocal imaging results in a series of images containing a single a fluorescent circle. We estimated the radii of the fluorescent circles for each channel, protein and lipid, by averaging the location of thousands of fluorophores with the precision of 0.5 nm, made possible by the large number of photons that can be collected from diffusing proteins or lipids. The radius for each fluorescence channel was measured in pixel and converted to nanometer based on the known diameter of the bead (6.8μM). The difference between the radius measured from the lipid channel and the radius measured from the protein channel represents the mean height of the protein. The measurement was repeated in 8 to 10 independent beads. All calculations were done using a custom program written in Matlab (Mathworks).
Site-specific biotinylation of Fibcon proteins
Fibcon proteins were biotinylated at the N-terminus using an SFP synthase catalyzed reaction, which conjugates biotin to the YBBR tag. 100 M recombinant Fibcon protein, 120 M biotin CoA, 10 M SFP synthase (purified according to published protocols (Yin et al, 2006), and 40 mM MgCl were mixed in a 100 L reaction volume and rotated for 3 hours at room temperature. The labeled protein product was purified on a Superdex 75 10/300 gel filtration column (GE Healthcare) into 25 mM HEPES pH 7.4, 150 mM NaCl, 0.5 mM TCEP. Biotinylation of the product was confirmed by attaching the protein to a supported lipid bilayer and imaging the binding of anti-biotin IgG.
Design and characterization of CEACAM5 proteins
Human CEACAM5 (Uniprot P06731) was chosen as a model antigen due to its relevance in cancers and relatively tall height of seven Ig-like domains (estimated ~28 nm). Full length CEACAM5 (CEA-FL, AA 34–677) DNA was cloned into pHR lentiviral expression vector (Clonetech). In parallel, a shortened version of CEACAM5 (CEA-N, AA 34–144) containing only the N-terminal domain linked to the native GPI anchor was cloned into the same vector. Anti-CEA IgG was expected to bind to the N terminal domain of all CEACAMs, as this is the only domain shared by the family. To test this, CEA-FL and CEA-N were transiently transfected in HEK cells using TransIT-293T transfection reagent (Mirus Bio) along with a construct containing only the two membrane proximal domains of CEACAM5 as a control. These cells were fixed and binding of Anti-CEA IgG was confirmed in the case of both CEA-FL and CEA-N, but not in the control lacking the N-terminal domain (Figure S2).
Preparation of CEA-N and CEA-FL protein antigens
HEK293T cells were grown to 70% confluency in a T175 flask and transfected with a construct consisting of CEA-N or CEA-FL with the GPI-anchor replaced with a C-terminal his-tag in a pCAGGS expression vector using TransIT-293T transfection reagent (Mirus Bio). After 48 hours, the supernatant was collected and Halt™ protease and phosphatase inhibitor was added (ThermoFisher). The proteins were affinity purified over a His Trap Excel column (GE Healthcare) and eluted with a high imidazole buffer containing 25 mM HEPES, 150 mM NaCl and 500 mM imidazole at pH 7.4. The proteins were gel-filtered using a Superdex 200 column (GE Healthcare) and the buffer was exchanged to remove imidazole. The proteins were concentrated and the purity was confirmed using SDS-PAGE (Figure S2).
Quantification of phagocytosis.
Phagocytosis of target particles by macrophage-like RAW 264.7 cells was quantified using microscopy and flow cytometry.
Microscopy assay of phagocytosis
96-well flat-bottom tissue-culture plates (Corning) were seeded with 35,000 cells in 200 μL of RPMI 1640 medium. Cells were incubated at 37 °C for at least 2 hours to allow attachment to the plastic surface. To start the assay, 100 μL of target particle suspension containing −500,000 beads was added to each well, and the plate was returned to 37 °C for exactly 20 minutes. After 20 minutes, wells were washed once with PBS to remove non-internalized and partially bound beads, and then overlaid with a PBS containing 1 μM CMDFA and 10 μM Hoechst 33342 to fluorescently stain the cell-cytoplasm and cell-nuclei. Individual wells were imaged after 10 minutes with the staining solution on a spinning-disk confocal microscope (Nikon) at 20×. For each well, a grid pattern of 4 fields-of-view was recorded. Images were segmented using a routine written with CellProfiler (Broad Institute) to isolate single-cells, and the bead fluorescence intensity in the lipid (DOPE-647) channel was integrated on a single-cell basis to generate the quantification of internalized lipid.
Flow-cytometry assay of phagocytosis
96-well plates were prepared for phagocytosis as described above. To start the assay, 100 μL of bead-protein-antibody solution was added to each well, and the plate was returned to 37 °C for 20 minutes. After 20 minutes, wells were washed once with PBS to remove non-intemalized and partially bound beads, and then overlaid with PBS containing 20 mM EDTA and 10 μM Hoechst 33342. Cells were gently de-adhered by pipetting up and down, then left suspended within the 96-well plate for flow-cytometry. Flow cytometry was performed on the Attune NxT equipped with an autosampler and analyzed with the provided software (Thermo Fisher). Single-cells were gated using the Hoechst channel in addition to forward and side-scatter. The 647 channel recording the fluorescence of DOPE-647 was used to quantify internalized lipid per cell (Figure S1).
Probes for imaging of FcR phosphorylation.
The phosphorylation state of the FcR ITAM was detected using both immunofluorescence and a live-cell sensor based on Syk kinase.
Immunofluorescence of FcR phosphorylation
For imaging interfaces between cells and supported lipid bilayer coated beads, cells were seeded into 8-well imaging chambers with a cover-glass bottom (Cellvis) and beads were added to the wells once the cells had fully adhered to the cover-glass. After a 15 minute incubation at 37 °C, the cells were fixed for 10 minutes with 4% paraformaldehyde in PBS. Cells were permeabilized with 0.1% saponin (Alfa Aesar) and blocked with 3% (w/v) BSA in PBS along with 0.5 g/mL Fc Block™ (BD Biosciences). Saponin (0.1%) was included in all subsequent probing and washing steps. Phospho-Tyrosine antibody (P-Tyr-1000 MultiMab™, Cell Signaling Technology) was added to cells at a dilution of 1:500 and incubated at room temperature for 1 hour. The cells were washed and secondary antibody (Alexa Fluor 488 AffiniPure Donkey Anti-Rabbit IgG, Jackson ImmunoResearch) was added at a dilution of 1:1000 and incubated for 1 hour at room temperature. The cells were given a final wash in PBS before imaging.
A live-cell sensor of FcR phosphorylation
The tyrosine-protein kinase Syk is recruited to the phosphorylated ITAM of Fc-receptors via an interaction with its tandem-SH2 domains (Chu et al, 1998). A sensor that localizes specifically to phosphorylated ITAMs was designed by placing a fluorescent protein C-terminal from the isolated Syk SH2 domains. The sensor construct consists of a C-terminal mCherry fluorescent protein, followed by a linker region (GGGSGGGG), followed by amino acids 2–261 of the tyrosine-protein kinase Syk from Mus musculus (NP_035648), a region which covers the tandem SH2 domains of Syk (Figure S3). The sensor was cloned into the pHR lentiviral expression vector (Clonetech) under control of the low-expression UBC promotor.
Stable FcR phosphorylation sensor cell line
HEK293T cells were grown in a 6-well plate to 80% confluency, and 160 ng VSV-G, 1.3 μg CMV 8.91, and 1.5 μg target vector were transfected into HEK293T cells using TransIT-293T transfection reagent (Miras Bio). Viral supernatants were collected 60 hours after transfection and spun at 4000 G to remove HEK293T cells. Viral supernatant was stored at 4 °C for no longer than 48 hours prior to infection. For lentiviral infection, 500 μL of viral supernatant was added to 5e5 RAW 264.7 macrophages along with 4 μg/mL polybrene, and cells were spun at 400G for 25 minutes at 37 °C and then resuspended and plated in a 6-well plate. Viral media was replaced fresh growth media 24 h after infection. Cells were sorted via fluorescence-activated cell sorting on an Influx Cell Sorter (Beckton-Dickinson), and a population of cells expressing the mCh-Syk-SH2 sensor was expanded and frozen for later use.
Live cell imaging of FcR phosphorylation.
FcR ITAM phosphorylation of macrophages engaged with antigens on a supported lipid bilayer was imaged in TIRF microscopy.
Preparation of SLB on coverslips
SLBs were formed by fusion of SUVs (see ‘Preparation of small unilamellar vesicles (SUVs)’) to RCA-cleaned glass coverslips. 40 μL of SUV solution was diluted in 60 μL of MOPS buffer (25 mM MOPS (3-(N-morpholino)propanesulfonic acid), Fisher Scientific), 125 mM NaCl, pH 7.4) in a PDMS (Polydimethylsiloxane, Sylgard) chamber sealed over an RCA cleaned coverslip. The SUV mixture was incubated for 15 minutes at room temperature. Next, the excess SUVs were thoroughly removed by washing 5× with 60 μL of PBS without drying the coverslip. The fluidity of the resulting lipid-bilayer was assessed by imaging with a spinning-disk confocal microscope (Nikon) at 6× magnification and high laser power, where diffusion of single-molecules of labeled lipid was visible after photo-bleaching a small region-of-interest.
Live cell TIRF microscopy of FcR phosphorylation
A solution consisting of 50 nM antigen protein and 125 ng/mL of IgG antibody was added to the hydrated SLB and incubated for 15 minutes at 37 °C. Ie4 RAW 264.7 were added dropwise to the imaging chamber and allowed to settle towards the SLB over 5 minutes. Where stated, cells were preincubated with CT-B-555 to stain the cell membrane. Total Internal Reflection Fluorescence (TIRF) imaging was performed on a Ti Eclipse microscope (NIKON) using a 60× TIRF 1.49 NA objective and an iXon Ultra EMCCD (Andor). All imaging experiments were performed within an incubator stage insert in a 5% C02 environment at 37 °C (Oko labs).
Image processing of FcR phosphorylation
Images were processed with custom code written in Python (Python.org) and MATLAB (MathWorks). For quantifying mCh-Syk-SH2 localization at the plasma membrane, single-cells were segmented using the CT-B-555 channel, and the intensity of the mCh-Syk-SH2 channel was integrated within this region to quantify sensor-recruitment. To quantify mCh-Syk-SH2 localization to individual clusters of antibody-FcR, Otsu thresholding was performed to isolate high-intensity anti-biotin IgG clusters from the background level of anti-biotin IgG bound to the SLB, and the intensity of the mCh-Syk-SH2 channel within these clusters was averaged to quantify sensor recruitment for each cell.
Live cell TIRF imaging of CD45 localization
To image CD45 localization, cells were incubated with 0.5 μg/ml anti-mouse CD45 antibody (clone 30-F11) directly conjugated to Alexa Fluor 647 (Biolegend) for 10 minutes. 50 μL of cells (le4 cells) were diluted directly into 100 μL imaging chambers containing hydrated, protein and antibody bound SLBs (described above). After allowing cells to settle to the SLB over 5 minutes, two-color TIRF images of CD45 (647) and antibiotin IgG (488) localization were collected on newly surface-engaged cells over a period of 15 minutes.
Giant plasma-membrane vesicles (GPMVs).
The plasma membrane of RAW 264.7 cells was isolated and used to quantify affinity of antibody-bound antigens to FcR and segregation of CD45.
GPMV formation
GPMVs were made following the protocol outlined by Sezgin et al. (Sezgin et al, 2012). In brief, cells were seeded in a 6-well plate and allowed to adhere. They were then washed with buffer (10 mM HEPES pH 7.4, 150 mM NaCl, 2 mM CaCl2) before addition of vesiculation agent (25 mM PFA and 2 mM DTT in the same buffer). GPMVs formed for one hour at 37 °C and were collected by removing the supernatant from the cells.
TIRF imaging of GPMV-SLB interfaces
GPMVs were added directly to 100 μL imaging chambers containing hydrated, antibiotin IgG opsonized SLBs (described above). After settling for 15 minutes, FcR-engaged GPMVs were identified by enrichment of the anti-biotin IgG signal and TIRF images of the GPMV-SLB interfaces were captured. To image CD45 localization, Alexa Fluor 647 labeled CD45 antibody (clone 30-F11) (Biolegend) was added to the well to a concentration of 0.5 μg/mL. CT-B-555 was used as a general membrane stain for GPMVs and was added to the well at a concentration of 0.5 μg/mL. The GPMVs were imaged after an incubation period of 10 minutes.
Enrichment analysis
For quantifying antibody-FcR enrichment at the GPMV-SLB contact, single GPMV footprints were segmented using the CT-B-555 channel, and the intensity of the antibiotin IgG channel was averaged within this region to quantify antibody intensity within footprint region (‘in’). The average intensity within the background region (‘out’) was measured, and an ‘enrichment ratio’ for each footprint was calculated as the ratio of intensity in region ‘in’ over region ‘out’ (Figure 4B).
Correlation analysis
For quantifying correlation between CD45 and anti-biotin IgG, the CT-B-555 channel was used to segment regions of GPMV-SLB contact. The Pearson’s correlation coefficient was calculated between the CD45 and anti-biotin IgG channels within these regions to quantify colocalization.
CRISPR editing to generate CD45 truncation
The gene coding for the CD45 protein from Mus musculus (geneID 19264) was truncated by a CRISPR/Cas9 exon excision strategy (Nelson et al, 2015) using guide RNAs targeting the intronic regions preceding the second coding exon (Exon 3) and directly following the exon coding for the D3 FNIII domain (Exon 8), resulting in a gene coding for CD45 protein with a truncated ectodomain containing only the two final FNIII domains D3-D4 (CD45 D3-D4) (Figure 6A).
sgRNA design and expression vector cloning
Target sequences for wild-type spCas9 nuclease were selected using the Deskgen CRISPR/Cas9 design tool (www.deskgen.com). For each genomic region to be cut, two target sequences were selected for high activity scores via the algorithm in Doench et al 2016 and low chance of off-target effects as calculated by the algorithm in Hsu et al 2013. For the region preceding Exon 3 (Chr1 bp 138126429 – 138126489), two target sequences were selected: Start-1 CTAATGGATGACCTAAGATG TGG, Start-2 AGAGCAATTCCTGTAACGGG AGG. For the region following Exon 8 (Chr1 bp 138110583-138110643), two target sequences were selected: D3–1 AAACCTTATTAAATAGAAAG GGG, D3–2 TGGTGTTATAAAAAGAAGGG AGG. Oligos coding for single guide RNAs (lacking the PAM sequence) were purchased from Integrated DNA Technologies (IDT) and cloned into the lentiGuide-Puro plasmid using the BsmB1 restriction enzyme as previously reported (Sanjana et al, 2014).
Transduction of spCas9 into RA W264.7 cells
Lentivirus was generated from the lentiCas9-Blast plasmid in HEK293T cells and transduced into RAW 264.7 cells as described above. After 2 days, 5 ug/mL Blasticidin was added to the media to select for Cas9 expressing RAW264.7 cells. Cells were cultured in 2 ug/mL Blasticidin for two weeks before freezing in 90% FBS + 10% DMSO for later use.
Transduction of sgRNA plasmids into RA W264.7 cells
Lentivirus was generated from lentiGuide-Puro plasmids encoding the Start-1, Start-2, D3–1, and D3–2 guide RNAs as described above. To excise the genomic region coding for the mucin-like and D1-D2 FNIII domains of CD45, two guide RNAs were transduced into Cas9-expressing RAW 264.7 cells simultaneously, one targeting the Exon 2 region (Start) and one targeting the Exon 8 region (D3). Four cell-lines were transduced using pairs of lentivirus (Start-1+D3–1, Start-2+D3–2, Start-2+D3–1, Start-2+D3–2). After 2 days, media containing 2 ug/mL Puromycin and 5 ug/mL Blasticidin was added to the media to select for cells expressing both Cas9 and at least one sgRNA cassette. Cells were cultured for 2 weeks for recovery. In a subset of the cells where two guide RNAs were transduced, simultaneous cutting by spCas9 at two genomic sites will lead to the removal of a large genomic region (~16,000 bp), which in a further subset of cells will be repaired by non-homologous end-joining.
Selection of CD45 D3-D4 cells
To identify cells expressing CD45 D3-D4 we used the monoclonal antibody anti-CD45 (clone 30-F11), which binds to an epitope in the pan-CD45 cysteine-rich domain D1 (Symons et al, 1999). Cells were collected two weeks after sgRNA transduction and antibiotic selection, labeled with anti-CD45 (clone 30-F11) Alexa Fluor 647, and cells were sorted by anti-CD45 labeling on a Bioscience Influx Sorter (BD) (Figure S4). Two populations of cells were recovered, CD45 30-F11 positive and CD45 30-F11 negative. After growing for one week, CD45 30-F11 negative cells were again labeled and sorted to remove any remaining positive cells from the population. At this stage, the resulting CD45 30-F11 negative population may contain cells expressing the truncated CD45 D3-D4. Two populations of cells, CD45 30-F11 positive CD45-WT and CD45 30-F11 Negative (CD45 D3-D4), were frozen in 90% FBS + 10% DMSO for later use.
RT-PCR to detect CD45 D3-D4 mRNA
To characterize and confirm the CD45 truncation in macrophages, the RNA was extracted from cells and then reverse transcribed to DNA and amplified. RNA extraction from whole cell lysate was performed with the RNeasy Mini kit (Qiagen). Once extracted, the RNA was reverse transcribed and amplified using the OneTaq RT-PCR kit (New England BioLabs). During this step, CD45 RNA was specifically targeted using primers complementary to it beginning near the 5’ end (gctgatctccagatatgaccatggg) and ending near the transmembrane encoding region (gacatcaatagccttgcttgttgttttgtat). This process of RNA extraction and RT-PCR was performed on cells edited to contain only the D3-D4 domains of CD45 (D3-D4) as well as wild-type cells (WT). The amplified DNA from all cells was assayed on an agarose gel to determine length and the CD45 D3-D4 sample was clearly smaller than the WT sample - indicating that this population of cells had a truncation in CD45 mRNA length (Figure S4). The individual bands from each population were excised and the DNA was sequenced to further confirm the CD45 truncation in cells (Figure S4).
Western Blot Analysis to detect CD45 D3-D4 protein
Cells were grown to 80% confluency in a T175 tissue culture flask. The cells were mechanically lysed using a dounce homogenizer and fractionated to isolate the plasma membranes. The membrane fraction was ultimately suspended in HEPES buffer with detergent (25 mM HEPES, 150 mM NaCL, 0.5% NP-40). Protein concentrations were measured via BCA assay to ensure equal amounts of sample were separated with SDS-PAGE. After transferring the protein to a nitrocellulose membrane, the membrane was probed with anti-CD45 antibody (PAB030Mu01, Cloud-Clone Corp.) at a dilution of 1:400. This antibody was chosen because it was raised against the D3-D4 domains of CD45, which are present in both full length CD45 and the truncated variant. After washing, the membrane was probed with rabbit anti-HRP secondary antibody (ab6721, Abcam) at a 1:5000 dilution.
QUANTIFICATION AND STATISTICAL ANALYSIS
Statistical significance was calculated for all quantitative data using the Python programming language and statistical tools in the software package Scipy. The number of cells (or beads) quantified per experiment, the number of experiments per measurement, the statistical significance of the measurement, and the statistical test used to determine the significance are indicated in each figure legend where quantification is reported. In general, significance was defined based on a two-sample Student’s T-test computed on the mean values from independent experimental replicates, where *P < 0.05, **P < 0.01, and ***P < 0.001 were used throughout the figures to denote the degree of significance.
Supplementary Material
(A) Elution profiles for Fibcon proteins using calibrated size-exclusion chromatography. There is a clear correlation between the elution volume of the Fibcon proteins and their increasing size (calculated weights: 12.1, 30.7, 49.3, and 67.9 kDa for F1L, F3L, F5L, and F7L respectively). Note that the molecular weights estimated from the standards calibration are larger than the expected molecular weights, potentially due to the extended structure of the FibNL proteins, which leads to decreased transit time through the column matrix relative to the globular standards. (B) Biotinylation strategy targeting the N-terminal YBBR of Fibcon proteins using SFP synthase. (C) Flow cytometry histograms demonstrating equal amounts of IgG opsonization on minimal target particles with varying antigen height. (D) Flow cytometry analysis of phagocytosis. Results are gated on the macrophage population using a nuclear stain (Hoechst). The number of cells that are positive for bead fluorescence is quantified and shown to increase drastically in the presence of anti-Biotin IgG. (E) Flow cytometry analysis of phagocytosis at varying antigen height can be normalized to corresponding values of IgG enrichment. Values in the left-most panel (same as Figure 2C) were normalized to average anti-Biotin IgG enrichment values (same as Figure 4C) to yield the panel on the right. The result shows a collapse of the Fib5L and Fib7L curves, but a notable difference remains between the curves for Fib1L and Fib 3L. (F) Autocorrelation curve used to quantify antibody surface density by fluorescence correlation spectroscopy and flow cytometry histogram demonstrating an additional measurement of surface density. These measurements yield similar values of approximately 100 antibodies/μm2.
(A) Full length CEACAM5 (CEA-FL) and the N-terminal domain of CEACAM5 alone (CEA-N) were expressed and secreted by HEK293T cells. The proteins were affinity purified and purification was assayed by SDS-PAGE. A sizeable shift in protein weight was seen after treatment with PNGase, indicating that the purified proteins are glycosylated. (B) CEA-FL and CEA-N were transiently expressed in HEK293T cells to confirm that anti-CEA antibody (clone D14HD11) binds to the N-terminal domain, which is present in both proteins. As a control, the B3 domain of CEACAM was transiently expressed as well and showed no binding of the antibody. (C) Flow cytometry histograms demonstrating equal amounts of IgG opsonization on minimal target particles displaying CEA-FL and CEA-N. (D) Confocal images showing that macrophages (RAW264.7) phagocytose minimal cells displaying CEA-N, but not CEA-FL.
(A) Phosphotyrosine immunostaining of interfaces between macrophages and minimal cells shows phosphorylation at sites of contact between macrophages and minimal target particles for Fib1L, but not for Fib7L. (B) A live-cell phosphorylated ITAM (pITAM) sensor was designed by linking mCherry fluorescent protein to the SH2 binding domains of Syk kinase. (C) The pITAM sensor is colocalized with sites of anti-biotin IgG enrichment during cell spreading on a supported lipid bilayer. (D) pITAM sensor intensity drops upon addition of PP2 - an inhibitor of Src-family kinases, which are responsible for ITAM phosphorylation.
(A) Anti-CD45 antibody (clone 30-F11) does not bind to the truncated form of CD45. After infection with lentivirus for production of sgRNA, RAW264.7 cells expressing Cas9 were sorted for the anti-CD45 negative population. (B) Agarose gel electrophoresis of RT-PCR product shows a decrease in CD45 mRNA length in CRISPR edited macrophages when compared to wildtype macrophages. (C) DNA sequencing results for excised bands from B verify truncation. (D) Western blot analysis shows a decrease in CD45 protein size for CD45 CRISPR edited macrophages when compared to wildtype macrophages (WT) and macrophages from the same CRISPR edited culture that were positive for anti-CD45 antibody binding during sorting (WT*).
A surface model of the crystal structure of the complex between human IgG1 and human Fcgr3 (PDB: 1T83) aligned with the structure of a full-length IgG1 antibody (IgG1 b12, PDB: 1HZH), depicting the conformation of FcR-IgG binding. Alignment and rendering were performed in Pymol. To estimate the height of the FcR-IgG complex, we analyzed the crystal structure of the complex between human IgG1 and human Fcgr3 (PDB: 1T83). To estimate the distance between the membrane-proximal residues of Fcgr3 and the membrane-distal residues of a full-length antibody, we first aligned the structure of the IgG1-Fcgr3 complex with the structure of a full-length IgG1 antibody (IgG1 b12, PDB: 1HZH). Next, the point-to-point distances between the base of Fcgr3 and the IgG1 antibody-binding domains was quantified using the ‘measurement wizard’ function in Pymol.
A comprehensive list of clinical monoclonal antibodies (mAbs) that are approved for neoplastic indications in the US or the EU that have the potential to stimulate Fc-dependent effector functions was created. Interestingly, nearly all of the target antigens for clinically approved mAbs are small (< 10 nm) cell-surface proteins. One exception to this observation appears to be Her2, which has a multi-domain structure common among growth-factor receptors. However, the antibody binding epitope of the clinical mAb Trastuzumab (Herceptin), which depends in part on ADCC for its therapeutic action (Baselga, 2001; Scheuer et al., 2009), has been mapped to the membrane-proximal domain IV (Cho et al., 2003), while the clinical mAb Pertuzumab (Perjeta) binds to domain II at ~7 nm above the membrane (PDB 1S78) (Tai et al., 2010) - both consistent with the requirement for close contact to achieve FcR activation. We stress that our analysis is limited by the lack of information on the binding epitopes and binding orientation of individual mAbs, but our results suggest that such structural information will be increasingly necessary for understanding how therapeutic mAbs function in vivo.
To construct the table, a complete list of approved mAbs (through 2018) was abbreviated to include only mAbs indicated for cancer therapy (Modified from https://www.antibodysociety.org/wordpress/wp-content/uploads/2018/03/EU_US-approved-mAbs-March-6_2018–1.pdf), and subsequently filtered to exclude blocking Fabs and antibody-drug conjugates. Columns detailing the antigen Uniprot protein ID, residues corresponding to the antigen ectodomain, and the ectodomain molecular weight were constructed using information from Uniprot. The maximum height was computed from the PDB structure by taking the greatest distance between the membrane-proximal to membrane-distal residues of the protein. For antigens without a complete crystal structure in the PDB for which protein structure has been otherwise determined, a note describing the structure was included when possible (i.e. ‘Small loop’ for CD20).
Fluorescence signal is Alexa Fluor-488 labeled anti-biotin IgG attached to the bilayer through Fib1L antigen, and enrichment over background corresponds to binding to FcγR at the apposed cell footprint and subsequent immobilization. Time course for the video is 2 minutes 25 seconds, and the scale bar is 10 μm.
Alexa Fluor-488 labeled anti-biotin IgG attached to the bilayer through Fib1L antigen (left), corresponding to bound antibody-FcγR complexes, and pITAM sensor within the cell (center) are co-localized at the contact interface. Alexa Fluor-488 (green) and mCherry-pITAM (red) channels are merged to highlight co-localization (right). Time course for the video is 2 minutes 25 seconds, and the scale bar is 10 μm.
Alexa Fluor-488 labeled anti-biotin IgG is attached to the bilayer through Fib1L antigen (left), corresponding to bound antibody-FcγR complexes. Alexa Fluor-488 (green) and Anti-CD45 (red) channels are merged, depicting the dynamics of segregation between antibody-FcγR on the bilayer and CD45 on the macrophage surface. Time course for the video is 50 seconds, and the scale bar is 10 μm.
Alexa Fluor-488 labeled anti-biotin IgG is attached to the bilayer through Fib7L antigen (left), corresponding to bound antibody-FcγR complexes. Alexa Fluor-488 (green) and Anti-CD45 (red) channels are merged, depicting the co-localization (yellow) between antibody-FcγR on the bilayer and CD45 on the macrophage surface. Time course for the video is 50 seconds, and the scale bar is 10 μm.
Highlights.
Antibody-dependent phagocytosis by macrophages depends on antigen size.
Short antigens promote close cell-cell contact and CD45 exclusion.
CD45 exclusion is integrin independent and leads to ITAM phosphorylation.
Antibodies targeting short antigens promote efficient phagocytosis.
Acknowledgements
The authors would like to thank K. Heydari and M. West for help with flow cytometry and Fletcher Lab members for helpful feedback and technical consultation. This work was supported by the Immunotherapeutics and Vaccine Research Initiative (IVRI) at UC Berkeley and by NIH R01 GM114671 (DAF). M.H.B. was funded by an NSF and a Siebel Fellowship. S.S. was funded by an LSRF fellowship. D.A.F. is a Chan Zuckerberg Biohub investigator.
Footnotes
Publisher's Disclaimer: This is a PDF file of an unedited manuscript that has been accepted for publication. As a service to our customers we are providing this early version of the manuscript. The manuscript will undergo copyediting, typesetting, and review of the resulting proof before it is published in its final citable form. Please note that during the production process errors may be discovered which could affect the content, and all legal disclaimers that apply to the journal pertain.
Author contributions
Conceptualization, M.H.B., A.M.J., E.M.S., D.A.F.; Methodology, M.H.B., A.M.J., S.S.; Investigation, M.H.B., A.M.J., S.S.; Resources, M.H.B., A.M.J., E.M.S., M.P.; Formal Analysis, M.H.B., A.M.J., S.S.; Writing, M.H.B., A.M.J., E.M.S, D.A.F.; Visualization, M.H.B, A.M.J., E.M.S.; Funding Acquisition D.A.F., M.H.B., E.M.S., S.S.; Supervision, D.A.F., E.M.S., M.H.B.
Declaration of Interests
The authors declare no competing interests.
REFERENCES
- Williams AF, and Barclay AN (1988). The Immunoglobulin Superfamily—Domains for Cell Surface Recognition. Annu. Rev. Immunol 6, 381–405. [DOI] [PubMed] [Google Scholar]
- Akira S, and Takeda K (2004). Toll-like receptor signalling. Nat. Rev. Immunol 4, 499–511. [DOI] [PubMed] [Google Scholar]
- Anton van der Merwe P, Davis SJ, Shaw AS, and Dustin ML (2000). Cytoskeletal polarization and redistribution of cell-surface molecules during T cell antigen recognition. Semin. Immunol 12, 5–21. [DOI] [PubMed] [Google Scholar]
- Baselga J (2001). Clinical trials of Herceptin® (trastuzumab). Eur. J. Cancer 37, 1824. [PubMed] [Google Scholar]
- Beauchemin N, and Arabzadeh A (2013). Carcinoembryonic antigen-related cell adhesion molecules (CEACAMs) in cancer progression and metastasis. Cancer Metastasis Rev. 32, 643–671. [DOI] [PubMed] [Google Scholar]
- Beekman JM, van der Linden JA, van de Winkel JGJ, and Leusen JHW (2008). FcγRI (CD64) resides constitutively in lipid rafts. Immunol. Lett 116, 149–155. [DOI] [PubMed] [Google Scholar]
- Ben M’Barek K, Molino D, Quignard S, Plamont M-A, Chen Y, Chavrier P, and Fattaccioli J (2015). Phagocytosis of immunoglobulin-coated emulsion droplets. Biomaterials 51, 270–277. [DOI] [PubMed] [Google Scholar]
- Brzostek J, Chai J-G, Gebhardt F, Busch DH, Zhao R, van der Merwe PA, and Gould KG (2010). Ligand dimensions are important in controlling NK-cell responses. Eur. J. Immunol 40, 2050–2059. [DOI] [PMC free article] [PubMed] [Google Scholar]
- Carbone CB, Kern N, Fernandes RA, Hui E, Su X, Garcia KC, and Vale RD (2017). In vitro reconstitution of T cell receptor-mediated segregation of the CD45 phosphatase. Proc. Natl. Acad. Sci 201710358. [DOI] [PMC free article] [PubMed] [Google Scholar]
- Chang VT, Fernandes RA, Ganzinger KA, Lee SF, Siebold C, McColl J, Jönsson P, Palayret M, Harlos K, Coles CH, et al. (2016). Initiation of T cell signaling by CD45 segregation at “close contacts.” Nat. Immunol 17, 574–582. [DOI] [PMC free article] [PubMed] [Google Scholar]
- Chikh GG, Li WM, Schutze-Redelmeier M-P, Meunier J-C, and Bally MB (2002). Attaching histidine-tagged peptides and proteins to lipid-based carriers through use of metal-ion-chelating lipids. Biochim. Biophys. Acta BBA - Biomembr 1567, 204212. [DOI] [PubMed] [Google Scholar]
- Cho H-S, Mason K, Ramyar KX, Stanley AM, Gabelli SB, Denney DW Jr, and Leahy DJ (2003). Structure of the extracellular region of HER2 alone and in complex with the Herceptin Fab. Nature 421, 756–760. [DOI] [PubMed] [Google Scholar]
- Choudhuri K, Wiseman D, Brown MH, Gould K, and van der Merwe PA (2005). T-cell receptor triggering is critically dependent on the dimensions of its peptide-MHC ligand. Nature 436, 578–582. [DOI] [PubMed] [Google Scholar]
- Chu DH, Morita Craig T, and Weiss Arthur (2006). The Syk family of protein tyrosine kinases in T-cell activation and development. Immunol. Rev 165, 167–180. [DOI] [PubMed] [Google Scholar]
- Cleary KLS, Chan HTC, James S, Glennie MJ, and Cragg MS (2017). Antibody Distance from the Cell Membrane Regulates Antibody Effector Mechanisms. J. Immunol. Baltim. Md 1950 198, 3999–4011. [DOI] [PMC free article] [PubMed] [Google Scholar]
- Clynes RA, Towers TL, Presta LG, and Ravetch JV (2000). Inhibitory Fc receptors modulate in vivo cytotoxicity against tumor targets. Nat. Med 6, 443–446. [DOI] [PubMed] [Google Scholar]
- Cordoba S-P, Choudhuri K, Zhang H, Bridge M, Basat AB, Dustin ML, and van der Merwe PA (2013). The large ectodomains of CD45 and CD148 regulate their segregation from and Inhibition of ligated T-cell receptor. Blood. [DOI] [PMC free article] [PubMed] [Google Scholar]
- Crowley MT, Costello PS, Fitzer-Attas CJ, Turner M, Meng F, Lowell C, Tybulewicz VLJ, and DeFranco AL (1997). A Critical Role for Syk in Signal Transduction and Phagocytosis Mediated by Fcγ Receptors on Macrophages. J. Exp. Med 186, 1027–1039. [DOI] [PMC free article] [PubMed] [Google Scholar]
- Davis SJ, and van der Merwe PA (1996). The structure and ligand interactions of CD2: implications for T-cell function. Immunol. Today 17, 177–187. [DOI] [PubMed] [Google Scholar]
- Davis SJ, and van der Merwe PA (2001). The immunological synapse: required for T cell receptor signalling or directing T cell effector function? Curr. Biol. CB 11, R289–291. [DOI] [PubMed] [Google Scholar]
- Davis SJ, and van der Merwe PA (2006). The kinetic-segregation model: TCR triggering and beyond. Nat. Immunol 7, 803–809. [DOI] [PubMed] [Google Scholar]
- Deng W, Gowen BG, Zhang L, Wang L, Lau S, Iannello A, Xu J, Rovis TL, Xiong N, and Raulet DH (2015). Antitumor immunity. A shed NKG2D ligand that promotes natural killer cell activation and tumor rejection. Science 348, 136–139. [DOI] [PMC free article] [PubMed] [Google Scholar]
- DiLillo DJ, Tan GS, Palese P, and Ravetch JV (2014). Broadly neutralizing hemagglutinin stalk-specific antibodies require FcγR interactions for protection against influenza virus in vivo. Nat. Med 20, 143–151. [DOI] [PMC free article] [PubMed] [Google Scholar]
- Doench JG, Fusi N, Sullender M, Hegde M, Vaimberg EW, Donovan KF, Smith I, Tothova Z, Wilen C, Orchard R, et al. (2016). Optimized sgRNA design to maximize activity and minimize off-target effects of CRISPR-Cas9. Nat. Biotechnol 34, 184–191 [DOI] [PMC free article] [PubMed] [Google Scholar]
- Dushek O, Goyette J, and van der Merwe PA (2012). Non-catalytic tyrosine-phosphorylated receptors. Immunol. Rev 250, 258–276. [DOI] [PubMed] [Google Scholar]
- Erwig LP, and Gow NAR (2016). Interactions of fungal pathogens with phagocytes. Nat. Rev. Microbiol 14, 163–176. [DOI] [PubMed] [Google Scholar]
- Fitzer-Attas CJ, Lowry M, Crowley MT, Finn AJ, Meng F, DeFranco AL, and Lowell CA (2000). Fcγ Receptor-Mediated Phagocytosis in Macrophages Lacking the Src Family Tyrosine Kinases Hck, Fgr, and Lyn. J. Exp. Med 191, 669–682. [DOI] [PMC free article] [PubMed] [Google Scholar]
- Freeman SA, Goyette J, Furuya W, Woods EC, Bertozzi CR, Bergmeier W, Hinz B, van der Merwe PA, Das R, and Grinstein S (2016). Integrins Form an Expanding Diffusional Barrier that Coordinates Phagocytosis. Cell 164, 128–140. [DOI] [PMC free article] [PubMed] [Google Scholar]
- Gibson DG, Young L, Chuang R-Y, Venter JC, H. CA Iii, and Smith HO (2009). Enzymatic assembly of DNA molecules up to several hundred kilobases. Nat. Methods 6, 343–345. [DOI] [PubMed] [Google Scholar]
- Goodridge HSR (2011). Activation of the innate immune receptor Dectin-1 upon formation of a “phagocytic synapse.” Nature 472, 471. [DOI] [PMC free article] [PubMed] [Google Scholar]
- Goodridge HS, Underhill DM, and Touret N (2012). Mechanisms of Fc Receptor and Dectin-1 Activation for Phagocytosis. Traffic 13, 1062–1071. [DOI] [PubMed] [Google Scholar]
- Gül N, and van Egmond M (2015). Antibody-Dependent Phagocytosis of Tumor Cells by Macrophages: A Potent Effector Mechanism of Monoclonal Antibody Therapy of Cancer. Cancer Res 75, 5008–5013. [DOI] [PubMed] [Google Scholar]
- Hsu PD, Scott DA, Weinstein JA, Ran FA, Konermann S, Agarwala V, Li Y, Fine EJ, Wu X, Shalem O, et al. (2013). DNA targeting specificity of RNA-guided Cas9 nucleases. Nat Biotechnol 31, 827–32. [DOI] [PMC free article] [PubMed] [Google Scholar]
- Jacobs SA, Diem MD, Luo J, Teplyakov A, Obmolova G, Malia T, Gilliland GL, and O’Neil KT (2012). Design of novel FN3 domains with high stability by a consensus sequence approach. Protein Eng. Des. Sel 25, 107–117. [DOI] [PubMed] [Google Scholar]
- James JR, and Vale RD (2012). Biophysical mechanism of T-cell receptor triggering in a reconstituted system. Nature 487, 64–69. [DOI] [PMC free article] [PubMed] [Google Scholar]
- Jaumouillé V, and Grinstein S (2011). Receptor mobility, the cytoskeleton, and particle binding during phagocytosis. Curr. Opin. Cell Biol 23, 22–29. [DOI] [PubMed] [Google Scholar]
- Jefferis R (2009). Glycosylation as a strategy to improve antibody-based therapeutics. Nat. Rev. Drug Discov 8, 226–234. [DOI] [PubMed] [Google Scholar]
- Katsumata O, Hara-Yokoyama M, Sautès-Fridman C, Nagatsuka Y, Katada T, Hirabayashi Y, Shimizu K, Fujita-Yoshigaki J, Sugiya H, and Furuyama S (2001). Association of FcγRII with Low-Density Detergent-Resistant Membranes Is Important for Cross-Linking-Dependent Initiation of the Tyrosine Phosphorylation Pathway and Superoxide Generation. J. Immunol 167, 5814–5823. [DOI] [PubMed] [Google Scholar]
- Köhler K, Xiong S, Brzostek J, Mehrabi M, Eissmann P, Harrison A, Cordoba S-P, Oddos S, Miloserdov V, Gould K, et al. (2010). Matched Sizes of Activating and Inhibitory Receptor/Ligand Pairs Are Required for Optimal Signal Integration by Human Natural Killer Cells. PLoS ONE 5, e15374. [DOI] [PMC free article] [PubMed] [Google Scholar]
- Korotkova N, Yang Y, Le Trong I, Cota E, Demeler B, Marchant J, Thomas WE, Stenkamp RE, Moseley SL, and Matthews S (2008). Binding of Dr adhesins of Escherichia coli to carcinoembryonic antigen triggers receptor dissociation. Mol. Microbiol 67, 420–434. [DOI] [PMC free article] [PubMed] [Google Scholar]
- Lim J, Wiedemann A, Tzircotis G, Monkley SJ, Critchley DR, and Caron E (2007). An Essential Role for Talin during αMβ2-mediated Phagocytosis. Mol. Biol. Cell 18, 976–985. [DOI] [PMC free article] [PubMed] [Google Scholar]
- Lu J, Ellsworth JL, Hamacher N, Oak SW, and Sun PD (2011). Crystal structure of Fcγ receptor I and its implication in high affinity γ-immunoglobulin binding. J. Biol. Chem 286, 40608–40613. [DOI] [PMC free article] [PubMed] [Google Scholar]
- McNeill L, Salmond RJ, Cooper JC, Carret CK, Cassady-Cain RL, Roche-Molina M, Tandon P, Holmes N, and Alexander DR (2007). The differential regulation of Lck kinase phosphorylation sites by CD45 is critical for T cell receptor signaling responses. Immunity 27, 425–437. [DOI] [PubMed] [Google Scholar]
- Milstein O, Tseng S-Y, Starr T, Llodra J, Nans A, Liu M, Wild MK, van der Merwe PA, Stokes DL, Reisner Y, et al. (2008). Nanoscale Increases in CD2-CD48-mediated Intermembrane Spacing Decrease Adhesion and Reorganize the Immunological Synapse. J. Biol. Chem 283, 34414–34422. [DOI] [PMC free article] [PubMed] [Google Scholar]
- Nelson CE, Hakim CH, Ousterout DG, Thakore PI, Moreb EA, Rivera RMC, Madhavan S, Pan X, Ran FA, Yan WX, et al. (2016). In vivo genome editing improves muscle function in a mouse model of Duchenne muscular dystrophy. Science 351, 403–407. [DOI] [PMC free article] [PubMed] [Google Scholar]
- Nimmerjahn F, and Ravetch JV (2005). Divergent Immunoglobulin G Subclass Activity Through Selective Fc Receptor Binding. Science 310, 1510–1512. [DOI] [PubMed] [Google Scholar]
- Nimmerjahn F, and Ravetch JV (2008). Fcγ receptors as regulators of immune responses. Nat. Rev. Immunol 8, 34–47. [DOI] [PubMed] [Google Scholar]
- Qin JY, Zhang L, Clift KL, Hulur I, Xiang AP, Ren B-Z, and Lahn BT (2010). Systematic Comparison of Constitutive Promoters and the Doxycycline-Inducible Promoter. PLOS ONE 5, e10611. [DOI] [PMC free article] [PubMed] [Google Scholar]
- Raju TS (2008). Terminal sugars of Fc glycans influence antibody effector functions of IgGs. Curr. Opin. Immunol 20, 471–478. [DOI] [PubMed] [Google Scholar]
- Sanjana NE, Shalem O, and Zhang F (2014). Improved vectors and genome-wide libraries for CRISPR screening. Nat. Methods 11, 783–784. [DOI] [PMC free article] [PubMed] [Google Scholar]
- Scheuer W, Friess T, Burtscher H, Bossenmaier B, Endl J, and Hasmann M (2009). Strongly Enhanced Antitumor Activity of Trastuzumab and Pertuzumab Combination Treatment on HER2-Positive Human Xenograft Tumor Models. Cancer Res 69, 9330–9336. [DOI] [PubMed] [Google Scholar]
- Schmid EM, Bakalar MH, Choudhuri K, Weichsel J, Ann HS, Geissler PL, Dustin ML, and Fletcher DA (2016). Size-dependent protein segregation at membrane interfaces. Nat. Phys 12, 704–711. [DOI] [PMC free article] [PubMed] [Google Scholar]
- Sezgin E, Kaiser H-J, Baumgart T, Schwille P, Simons K, and Levental I (2012). Elucidating membrane structure and protein behavior using giant plasma membrane vesicles. Nat. Protoc 7, 1042–1051. [DOI] [PubMed] [Google Scholar]
- Shaw AS, and Dustin ML (1997). Making the T cell receptor go the distance: a topological view of T cell activation. Immunity 6, 361–369. [DOI] [PubMed] [Google Scholar]
- Simpson TR, Li F, Montalvo-Ortiz W, Sepulveda MA, Bergerhoff K, Arce F, Roddie C, Henry JY, Yagita H, Wolchok JD, et al. (2013). Fc-dependent depletion of tumor-infiltrating regulatory T cells co-defines the efficacy of anti-CTLA-4 therapy against melanoma. J. Exp. Med 210, 1695–1710. [DOI] [PMC free article] [PubMed] [Google Scholar]
- Symons A, Willis AC, and Barclay AN (1999). Domain organization of the extracellular region of CD45. Protein Eng 12, 885–892. [DOI] [PubMed] [Google Scholar]
- Tai W, Mahato R, and Cheng K (2010). The role of HER2 in cancer therapy and targeted drug delivery. J. Controlled Release 146, 264–275. [DOI] [PMC free article] [PubMed] [Google Scholar]
- Turner M, Schweighoffer E, Colucci F, Di Santo JP, and Tybulewicz VL (2000). Tyrosine kinase SYK: essential functions for immunoreceptor signalling. Immunol. Today 21, 148–154. [DOI] [PubMed] [Google Scholar]
- Varma R, Campi G, Yokosuka T, Saito T, and Dustin ML (2006). T cell receptor-proximal signals are sustained in peripheral microclusters and terminated in the central supramolecular activation cluster. Immunity 25, 117–127. [DOI] [PMC free article] [PubMed] [Google Scholar]
- Waldmann TA (1991). Monoclonal antibodies in diagnosis and therapy. Science 252, 1657–1662. [DOI] [PubMed] [Google Scholar]
- Weiskopf K, and Weissman IL (2015). Macrophages are critical effectors of antibody therapies for cancer. MAbs 7, 303–310. [DOI] [PMC free article] [PubMed] [Google Scholar]
- Wild MK, Cambiaggi A, Brown MH, Davies EA, Ohno H, Saito T, and van der Merwe PA (1999). Dependence of T Cell Antigen Recognition on the Dimensions of an Accessory Receptor-Ligand Complex. J. Exp. Med 190, 31–42. [DOI] [PMC free article] [PubMed] [Google Scholar]
- Wu Y, Vendome J, Shapiro L, Ben-Shaul A, and Honig B (2011). Transforming binding affinities from three dimensions to two with application to cadherin clustering. Nature 475, 510–513. [DOI] [PMC free article] [PubMed] [Google Scholar]
- Yin J, Straight PD, McLoughlin SM, Zhou Z, Lin AJ, Golan DE, Kelleher NL, Kolter R, and Walsh CT (2005). Genetically encoded short peptide tag for versatile protein labeling by Sfp phosphopantetheinyl transferase. Proc. Natl. Acad. Sci 102, 15815–15820. [DOI] [PMC free article] [PubMed] [Google Scholar]
- Yokosuka T, Kobayashi W, Takamatsu M, Sakata-Sogawa K, Zeng H, Hashimoto-Tane A, Yagita H, Tokunaga M, and Saito T (2010). Spatiotemporal Basis of CTLA-4 Costimulatory Molecule-Mediated Negative Regulation of T Cell Activation. Immunity 33, 326–339. [DOI] [PubMed] [Google Scholar]
- Yokosuka T, Takamatsu M, Kobayashi-Imanishi W, Hashimoto-Tane A, Azuma M, and Saito T (2012). Programmed cell death 1 forms negative costimulatory microclusters that directly inhibit T cell receptor signaling by recruiting phosphatase SHP2. J. Exp. Med 209, 1201–1217. [DOI] [PMC free article] [PubMed] [Google Scholar]
- Zhu JW, Brdicka T, Katsumoto TR, Lin J, and Weiss A (2008). Structurally Distinct Phosphatases CD45 and CD148 Both Regulate B Cell and Macrophage Immunoreceptor Signaling. Immunity 28, 183–196. [DOI] [PMC free article] [PubMed] [Google Scholar]
- Zikherman J, Jenne C, Watson S, Doan K, Raschke W, Goodnow CC, and Weiss A (2010). CD45-Csk Phosphatase-Kinase Titration Uncouples Basal and Inducible T Cell Receptor Signaling during Thymic Development. Immunity 32, 342–354. [DOI] [PMC free article] [PubMed] [Google Scholar]
Associated Data
This section collects any data citations, data availability statements, or supplementary materials included in this article.
Supplementary Materials
(A) Elution profiles for Fibcon proteins using calibrated size-exclusion chromatography. There is a clear correlation between the elution volume of the Fibcon proteins and their increasing size (calculated weights: 12.1, 30.7, 49.3, and 67.9 kDa for F1L, F3L, F5L, and F7L respectively). Note that the molecular weights estimated from the standards calibration are larger than the expected molecular weights, potentially due to the extended structure of the FibNL proteins, which leads to decreased transit time through the column matrix relative to the globular standards. (B) Biotinylation strategy targeting the N-terminal YBBR of Fibcon proteins using SFP synthase. (C) Flow cytometry histograms demonstrating equal amounts of IgG opsonization on minimal target particles with varying antigen height. (D) Flow cytometry analysis of phagocytosis. Results are gated on the macrophage population using a nuclear stain (Hoechst). The number of cells that are positive for bead fluorescence is quantified and shown to increase drastically in the presence of anti-Biotin IgG. (E) Flow cytometry analysis of phagocytosis at varying antigen height can be normalized to corresponding values of IgG enrichment. Values in the left-most panel (same as Figure 2C) were normalized to average anti-Biotin IgG enrichment values (same as Figure 4C) to yield the panel on the right. The result shows a collapse of the Fib5L and Fib7L curves, but a notable difference remains between the curves for Fib1L and Fib 3L. (F) Autocorrelation curve used to quantify antibody surface density by fluorescence correlation spectroscopy and flow cytometry histogram demonstrating an additional measurement of surface density. These measurements yield similar values of approximately 100 antibodies/μm2.
(A) Full length CEACAM5 (CEA-FL) and the N-terminal domain of CEACAM5 alone (CEA-N) were expressed and secreted by HEK293T cells. The proteins were affinity purified and purification was assayed by SDS-PAGE. A sizeable shift in protein weight was seen after treatment with PNGase, indicating that the purified proteins are glycosylated. (B) CEA-FL and CEA-N were transiently expressed in HEK293T cells to confirm that anti-CEA antibody (clone D14HD11) binds to the N-terminal domain, which is present in both proteins. As a control, the B3 domain of CEACAM was transiently expressed as well and showed no binding of the antibody. (C) Flow cytometry histograms demonstrating equal amounts of IgG opsonization on minimal target particles displaying CEA-FL and CEA-N. (D) Confocal images showing that macrophages (RAW264.7) phagocytose minimal cells displaying CEA-N, but not CEA-FL.
(A) Phosphotyrosine immunostaining of interfaces between macrophages and minimal cells shows phosphorylation at sites of contact between macrophages and minimal target particles for Fib1L, but not for Fib7L. (B) A live-cell phosphorylated ITAM (pITAM) sensor was designed by linking mCherry fluorescent protein to the SH2 binding domains of Syk kinase. (C) The pITAM sensor is colocalized with sites of anti-biotin IgG enrichment during cell spreading on a supported lipid bilayer. (D) pITAM sensor intensity drops upon addition of PP2 - an inhibitor of Src-family kinases, which are responsible for ITAM phosphorylation.
(A) Anti-CD45 antibody (clone 30-F11) does not bind to the truncated form of CD45. After infection with lentivirus for production of sgRNA, RAW264.7 cells expressing Cas9 were sorted for the anti-CD45 negative population. (B) Agarose gel electrophoresis of RT-PCR product shows a decrease in CD45 mRNA length in CRISPR edited macrophages when compared to wildtype macrophages. (C) DNA sequencing results for excised bands from B verify truncation. (D) Western blot analysis shows a decrease in CD45 protein size for CD45 CRISPR edited macrophages when compared to wildtype macrophages (WT) and macrophages from the same CRISPR edited culture that were positive for anti-CD45 antibody binding during sorting (WT*).
A surface model of the crystal structure of the complex between human IgG1 and human Fcgr3 (PDB: 1T83) aligned with the structure of a full-length IgG1 antibody (IgG1 b12, PDB: 1HZH), depicting the conformation of FcR-IgG binding. Alignment and rendering were performed in Pymol. To estimate the height of the FcR-IgG complex, we analyzed the crystal structure of the complex between human IgG1 and human Fcgr3 (PDB: 1T83). To estimate the distance between the membrane-proximal residues of Fcgr3 and the membrane-distal residues of a full-length antibody, we first aligned the structure of the IgG1-Fcgr3 complex with the structure of a full-length IgG1 antibody (IgG1 b12, PDB: 1HZH). Next, the point-to-point distances between the base of Fcgr3 and the IgG1 antibody-binding domains was quantified using the ‘measurement wizard’ function in Pymol.
A comprehensive list of clinical monoclonal antibodies (mAbs) that are approved for neoplastic indications in the US or the EU that have the potential to stimulate Fc-dependent effector functions was created. Interestingly, nearly all of the target antigens for clinically approved mAbs are small (< 10 nm) cell-surface proteins. One exception to this observation appears to be Her2, which has a multi-domain structure common among growth-factor receptors. However, the antibody binding epitope of the clinical mAb Trastuzumab (Herceptin), which depends in part on ADCC for its therapeutic action (Baselga, 2001; Scheuer et al., 2009), has been mapped to the membrane-proximal domain IV (Cho et al., 2003), while the clinical mAb Pertuzumab (Perjeta) binds to domain II at ~7 nm above the membrane (PDB 1S78) (Tai et al., 2010) - both consistent with the requirement for close contact to achieve FcR activation. We stress that our analysis is limited by the lack of information on the binding epitopes and binding orientation of individual mAbs, but our results suggest that such structural information will be increasingly necessary for understanding how therapeutic mAbs function in vivo.
To construct the table, a complete list of approved mAbs (through 2018) was abbreviated to include only mAbs indicated for cancer therapy (Modified from https://www.antibodysociety.org/wordpress/wp-content/uploads/2018/03/EU_US-approved-mAbs-March-6_2018–1.pdf), and subsequently filtered to exclude blocking Fabs and antibody-drug conjugates. Columns detailing the antigen Uniprot protein ID, residues corresponding to the antigen ectodomain, and the ectodomain molecular weight were constructed using information from Uniprot. The maximum height was computed from the PDB structure by taking the greatest distance between the membrane-proximal to membrane-distal residues of the protein. For antigens without a complete crystal structure in the PDB for which protein structure has been otherwise determined, a note describing the structure was included when possible (i.e. ‘Small loop’ for CD20).
Fluorescence signal is Alexa Fluor-488 labeled anti-biotin IgG attached to the bilayer through Fib1L antigen, and enrichment over background corresponds to binding to FcγR at the apposed cell footprint and subsequent immobilization. Time course for the video is 2 minutes 25 seconds, and the scale bar is 10 μm.
Alexa Fluor-488 labeled anti-biotin IgG attached to the bilayer through Fib1L antigen (left), corresponding to bound antibody-FcγR complexes, and pITAM sensor within the cell (center) are co-localized at the contact interface. Alexa Fluor-488 (green) and mCherry-pITAM (red) channels are merged to highlight co-localization (right). Time course for the video is 2 minutes 25 seconds, and the scale bar is 10 μm.
Alexa Fluor-488 labeled anti-biotin IgG is attached to the bilayer through Fib1L antigen (left), corresponding to bound antibody-FcγR complexes. Alexa Fluor-488 (green) and Anti-CD45 (red) channels are merged, depicting the dynamics of segregation between antibody-FcγR on the bilayer and CD45 on the macrophage surface. Time course for the video is 50 seconds, and the scale bar is 10 μm.
Alexa Fluor-488 labeled anti-biotin IgG is attached to the bilayer through Fib7L antigen (left), corresponding to bound antibody-FcγR complexes. Alexa Fluor-488 (green) and Anti-CD45 (red) channels are merged, depicting the co-localization (yellow) between antibody-FcγR on the bilayer and CD45 on the macrophage surface. Time course for the video is 50 seconds, and the scale bar is 10 μm.