

Abstract
Background & Aims
Serrated polyps (SPs) and conventional adenomas are precursor lesions for colorectal cancer (CRC) but believed to arise via distinct pathways. We characterized risk factor profiles for SPs and conventional adenomas in a post-hoc analysis of data from 3 large prospective studies.
Methods
We collected data from the Nurses’ Health Study (NHS), the NHS2, and the Health Professionals Follow-up Study (HPFS) on subjects who developed SPs or conventional adenomas. Our analysis comprised 141,143 participants who had undergone lower gastrointestinal endoscopy, provided updated diet and lifestyle data every 2–4 years, and were followed until diagnosis of a first polyp. We assessed 13 risk factors for CRC in patients with SPs or conventional adenomas, and examined the associations according to histopathology features.
Results
We documented 7945 SPs, 9212 conventional adenomas, and 2382 synchronous SPs and conventional adenomas during 18–20 years of follow up. Smoking, body mass index, alcohol intake, family history of CRC, and height were associated with higher risk of SPs and conventional adenomas, whereas higher intake of vitamin D and marine omega-3 fatty acid were associated with lower risk. The associations tended to be stronger for synchronous SPs and conventional adenomas. Smoking, body mass index, and alcohol intake were more strongly associated with SPs than conventional adenomas (P for heterogeneity <.05), whereas physical activity and intake of total folate and calcium were inversely associated with conventional adenomas but not SPs. For SPs and conventional adenomas, the associations tended to be stronger for polyps in the distal colon and rectum, larger than 10 mm, or with advanced histology.
Conclusions
In an analysis of data from 3 large prospective studies, we found that although SPs and conventional adenomas share many risk factors, some factors are more strongly associated with 1 type of lesion than the other. These findings provide support for the etiologic heterogeneity of colorectal neoplasia.
Keywords: BMI, sessile serrated adenoma, interval cancer, surveillance
Graphical abstract
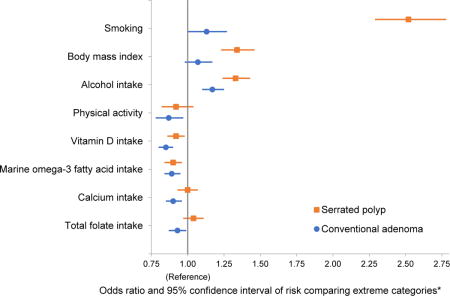
Colorectal cancer risk factors and risk of serrated polyp and conventional adenoma
*Smoking : current smokers with ≥30 pack-years versus never smokers; Body mass index: ≥35 versus <25 kg/m2; Alcohol intake: ≥14 g/d versus never for men, ≥7 g/d versus never for women; Physical activity: ≥60 versus <7.5 metabolic equivalent task-hours/week versus; Dietary factors: highest quartile versus lowest quartile.
Introduction
Colorectal cancer (CRC) has been thought for decades to develop through the conventional adenoma-carcinoma continuum.1 However, increasing evidence supports that serrated polyps (SPs) represent another precursor lesion of CRC and contribute to about one third of CRC cases through an alternative pathway.2, 3 The serrated pathway has been suggested to play an important role in the development of “interval cancers”, which occur despite endoscopic screening and surveillance.4 According to the 2010 WHO classification schema, SPs include hyperplastic polyps (HPs), sessile serrated adenoma/polyps (SSA/Ps) and traditional serrated adenomas (TSAs).5 The serrated continuum is proposed to mainly originate from HPs and transit to SSA/Ps or TSAs prior to progression to dysplasia and carcinoma6, although some evidence suggests the in situ development of SSA/Ps7. In contrast to the conventional pathway arising from chromosomal instability, the serrated pathway is characterized by CpG island methylation phenotype (CIMP), BRAF mutation, and often microsatellite instability (MSI).8 Given the close link between inflammation and MSI, tumors arising from the serrated pathway may be more strongly associated with inflammatory processes that are important for CRC development.9
Lifestyle or environmental factors play an important role in CRC, with a variety of potential lifestyle risk factors identified. 10-12 Some of these factors have been differentially associated with SPs than conventional adenomas.13-16 Among them, compelling data support that smoking is much more strongly associated with risk of polyps that arise from the serrated pathway than conventional adenomas.13-15 However, for other factors, epidemiologic data are sparse and inconsistent. Some but not all studies found that alcohol intake and body mass index (BMI) were stronger risk factors for SPs than conventional adenomas.14-16 Of note, most of the evidence is based on relatively small case-control studies with limited lifestyle data.
Therefore, to extend our knowledge, we performed a comprehensive analysis of the risk factor profiles of SPs and conventional adenomas within three large prospective cohort studies, the Nurses’ Health Study (NHS), the NHS2, and the Health Professionals Follow-up Study (HPFS). We first assessed numerous CRC risk factors in relation to SPs and conventional adenomas separately, and then compared the associations between the two lesions through case-only analyses. We also performed subgroup analyses according to histopathological features of polyps.
Methods
Study population
The NHS included 121700 US female nurses aged 30 to 55 at enrollment in 1976. The NHS2 included 116430 registered US female nurses aged 25 to 42 years at enrollment in 1989. The HPFS enrolled 51529 male health professionals aged 40 to 75 at study entry in 1986. More details about the follow-up of the three cohorts have been described previously.17-19 Briefly, participants were mailed a biennial questionnaire that inquired detailed medical and lifestyle information, including history of endoscopic examinations and diagnosis of CRC and polyp. Diet was assessed by a validated food frequency questionnaire (FFQ) every four years. The average follow-up rate has been greater than 90% in all three cohorts. The study was approved by the institutional review board at the Brigham and Women’s Hospital and Harvard T.H. Chan School of Public Health.
Ascertainment of colorectal polyp cases and subtypes
On each biennial questionnaire, participants were asked if they had undergone a colonoscopy or sigmoidoscopy and if any colorectal polyp had been diagnosed in the past two years. For those who reported yes, we asked for permission to acquire their endoscopic and pathologic records. Investigators blinded to any exposure information reviewed all records and extracted clininopathological data. Because detailed histological information of polyps was not collected until 1992 for the NHS/HPFS and 1991 for the NHS2, we used these years as the baseline of the current study for each of the cohorts. Furthermore, detailed subsite and size information of SP was not collected until 2004 for the NHS/HPFS and 2003 for the NHS2; and thus the subgroup analyses by histopathological features of SPs were based on the follow-up starting from these years. At baseline, we excluded participants who had a history of cancer (except non-melanoma skin cancer), colorectal polyp, inflammatory bowel disease, or participants who had missing data on any of the studied risk factors. We compared the basic characteristics of participants before and after excluding those who had missing data at baseline, and did not observe any substantial difference (Supplementary table 1). A total of 53,858 eligible participants in the NHS, 58,574 in the NHS2, and 28,711 in the HPFS who had undergone at least one lower gastrointestinal endoscopy since baseline were included in the current analysis. Among all endoscopies, flexible sigmoidoscopies accounted for about 25%, with a greater proportion in the earlier years than in the latter years (Supplementary Figure 1).
In this study, SPs included hyperplastic polyps and mix/serrated adenomas, while conventional adenomas included tubular, tubulovillous and villous adenomas, and adenomas with high-grade dysplasia. Mixed/serrated adenoma included both mixed polyps (those with both adenomatous and hyperplastic changes in histology) and polyps with any serrated diagnosis (e.g., serrated adenoma, serrated polyp, and SSA/P). If a participant had both SPs and conventional adenomas in an endoscopy, we recorded each type of the polyps separately, and considered the patient as synchronous SPs and conventional adenomas case in the current study.
Covariate Assessment
In the baseline and biennial follow-up questionnaires, we assessed numerous CRC risk factors, including family history of CRC, cigarette smoking (no/past/current smoker, pack-years of cigarette smoking), height, BMI, physical activity, and regular aspirin use. Participants were defined as having a positive family history of CRC if at least one of their parents and siblings had been diagnosed with CRC. For physical activity, weekly energy expenditure was estimated by multiplying the typical intensity expressed in metabolic equivalent of task (MET) (the ratio of metabolic rate during the activity to metabolic rate at rest)20 by the reported hours spent per week. Details about assessment of aspirin use have been described previously.21-23 Briefly, participants were asked whether they took aspirin regularly and, if so, the frequency and dose of use per week. To capture the increasing use of baby aspirin (81 mg), we asked participants to convert four baby aspirin tablets to one adult standard-dose tablet (325 mg) in the questionnaires administered during 1992–2000 and started asking about baby aspirin use separately since 2000. Consistent with our prior analyses21-23, regular aspirin use was defined as use of at least two standard-equivalent tablets per week, whereas those who did not use aspirin or used less than the specified dose were considered as non-regular users. Food frequency questionnaires were administered every four years to assess dietary risk factors, including alcohol, processed red meat, total fiber, folate, calcium, vitamin D, and marine omega-3 fatty acid (including eicosapentaenoic acid [EPA], docosahexaenoic acid [DHA] and docosapentaenoic acid [DPA]). Supplemental use was included in calculation of total nutrient intake. The validity of the FFQs in assessing food and nutrient intake has been documented previously.24, 25 For missing data of the studied risk factors that occurred in the follow-up questionnaires, we carried forward the most recent available information from prior questionnaires.
Statistical analysis
Our analysis only included participants who had at least one lower endoscopy during the followup. If a participant had more than one endoscopy during the study period, multiple records from the same participant were included in the analysis. To account for possible multiple records per participant and to handle time-varying exposure and covariates efficiently, we used an Andersen-Gill data structure with a new record for each 2-year follow-up period during which a participant underwent an endoscopy. Participants were censored at the diagnosis of any colorectal polyp, at the time of death, or the end of the follow up (June 1, 2012 for the NHS, June 1, 2011 for the NHS2, and January 1, 2010 for the HPFS), whichever occurred first. To capture long-term exposure, we calculated the cumulative average of risk factors from preceding questionnaires up to the current cycle. Multivariable-adjusted logistic regressions for clustered data (PROC GENMOD) were used to account for repeated observations (i.e., multiple endoscopies) and to calculate odds ratios (ORs) and 95% confidence intervals (CIs).
We examined a total of 13 CRC risk factors, for which substantial data supported their potential role in CRC development.10-12,26 Smoking was categorized into never smokers, past smokers with <30 pack-years, past smokers with ≥30 pack-years, current smokers with <30 pack-years, and current smokers with ≥30 pack-years. Test for trend was performed using pack-years of smoking as a continuous variable. BMI was grouped into <25, 25–29.9, 30–34.9, and ≥35 kg/m2 according to the WHO classification. Physical activity was categorized into <7.5, 7.5–14.9, 15–29.9, 30–59.9, and ≥60 MET-hours/week based on the previous studies.27, 28 Alcohol intake was grouped into never, <3.5, 3.5–6.9, and ≥7 g/day in women; and never, <7, 7–13.9, and ≥14 g/day in men, based on the Dietary Guidelines for Americans.29 Dietary intakes of total fiber, folate, calcium, vitamin D, marine omega-3 fatty acid, and processed red meat were categorized into quartiles. For dietary factors, test for trend was conducted using the median of each category as a continuous variable. We also assessed family history of CRC, height, and regular aspirin use. All analyses were based on a multivariable model that adjusted for all the non-dietary risk factors, age (continuous), and race (Caucasian or non-Caucasian) as well as endoscopy-related factors, including time period of endoscopy (in 2-year intervals), number of prior endoscopies (continuous), time in years since the most recent endoscopy (continuous), and reason for endoscopy (routine screening or symptom).
We first evaluated the associations of CRC risk factors with SPs and conventional adenomas separately, and then compared the associations for SPs and conventional adenomas among cases only by calculating the P for heterogeneity. In secondary analyses, we examined the associations according to several histopathological features of polyp, including anatomic location, size, and risk classification (for conventional adenomas only; non-advanced, advanced), and also tested for heterogeneity by these features through case-only analyses. For subsite, polyps in the cecum, ascending colon, hepatic flexure, transverse colon or splenic flexure were classified as proximal; polyps in the descending or sigmoid colon as distal, and those in the rectum or rectosigmoid junction as rectal. SPs were also classified by size (small: <10mm, large: ≥10mm). Advanced conventional adenomas were defined as at least one conventional adenoma of ≥10 mm in diameter or with advanced histology (tubulovillous/villous histological features or high grade or severe dysplasia), or ≥3 conventional adenomas regardless of histology or size.30, 31 For both SPs and conventional adenomas, if more than one polyp was diagnosed in an anatomic region (proximal and distal colon and rectum), the size of the largest polyp and the histology of the most advanced lesion were used.
Given that diminutive distal HPs are believed to have little or no malignant potential, we reexamined the associations for SPs after excluding those that were located in the distal colon or rectum and sized less than 10 mm, and performed a sensitivity analysis for SPs located in the proximal colon with size of ≥10mm only. Moreover, given that “mixed adenoma” is considered an outdated term, we excluded polyps that were initially classified by pathologists as mixed/serrated adenomas from the SP analysis. To test the robustness of our findings to the secular trend of exams, we also performed a sensitivity analysis by restricting to participants who had undergone colonoscopies only.
We first performed all the analyses in each of the three cohorts separately. Because no substantial difference was observed (Supplementary Tables 2–4), we pooled the data together and adjusted for study cohort in the final model. All the analyses were performed using SAS 9.4 (SAS Institute, Cary, NC, USA). All the statistical tests were two-sided and p value <0.05 was considered statistically significant.
Results
During 18–20 years of follow-up of 141143 participants in the three cohorts, we documented 7945 cases with SPs, 9212 cases with conventional adenomas, and 2382 cases with synchronous SPs and conventional adenomas. As shown in Table 1, participants had a mean age of 60.2±10.6 years, BMI of 26.6±5.3 kg/m2, and alcohol consumption of 6.3±9.3 g/day; 80% were females, 95% Caucasians, and 5% current smokers. Compared with participants who did not develop polyp, those with polyps were more likely to have a family history of CRC, smoke, and drink alcohol; had a higher BMI; and consumed more processed red meat and less fiber, folate, calcium, vitamin D, and marine omega-3 fatty acid.
Table 1.
Basic characteristics of study participants in the three cohort studies (NHS, NHS2, HPFS)a
| Overall population | Non-polyps | SPs-only | Conventional adenomas-only | Synchronous SPs and conventional adenomas | |
|---|---|---|---|---|---|
| No. of participants | 141143 | 119676 | 7945 | 9212 | 2382 |
| Age, year | 60.2±10.6 | 60.3±10.7 | 57.8±9.8 | 60.9±10.0 | 61.5±9.8 |
| Sex | |||||
| Male | 28711 (20) | 22728 (19) | 1621 (20) | 2932 (32) | 775 (33) |
| Female | 112432 (80) | 96948 (81) | 6324 (80) | 6280 (68) | 1607 (67) |
| Race | |||||
| Caucasian | 134001 (95) | 113537 (95) | 7645 (96) | 8831 (96) | 2299 (97) |
| non-Caucasian | 7142 (5) | 6139 (5) | 300 (4) | 381 (4) | 83 (3) |
| Family history of colorectal cancer | |||||
| No | 111461 (79) | 94843 (79) | 5945 (75) | 6928 (75) | 1762 (74) |
| Yes | 29682 (21) | 24833 (21) | 2000 (25) | 2284 (25) | 620 (26) |
| Pack-years of smoking | 8.8±15.4 | 8.6±15.2 | 12.5±18.5 | 9.6±16.2 | 14.2±19.7 |
| Never smokers | 76767 (55) | 65510 (55) | 3628 (45) | 4935 (55) | 989 (42) |
| Past smokers | |||||
| <30 pack-years | 46408 (33) | 39326 (33) | 2680 (34) | 2969 (32) | 822 (35) |
| ≥30 pack-years | 10459 (7) | 8700 (7) | 843 (11) | 781 (8) | 271 (11) |
| Current smokers | |||||
| <30 pack-years | 3289 (2) | 2729 (2) | 302 (4) | 213 (2) | 102 (4) |
| ≥30 pack-years | 4220 (3) | 3411 (3) | 492 (6) | 314 (3) | 198 (8) |
| Body mass index, kg/m2 | 26.6±5.3 | 26.6±5.3 | 27.1±5.3 | 26.8±5.3 | 27.7±5.7 |
| <25 | 62286 (44) | 53088 (45) | 3110 (39) | 3888 (43) | 857 (36) |
| 25-29.9 | 49725 (35) | 42066 (35) | 2940 (37) | 3326 (36) | 882 (37) |
| 30-34.9 | 19153 (14) | 16109 (13) | 1256 (16) | 1333 (14) | 397 (17) |
| ≥35 | 9979 (7) | 8413 (7) | 639 (8) | 665 (7) | 246 (10) |
| Physical activity, MET-hours/weekb | 21.8±20.7 | 21.9±20.8 | 20.5±18.1 | 20.7±19.4 | 20.3±18.7 |
| <7.5 | 31786 (22) | 26869 (23) | 1814 (23) | 2186 (24) | 573 (24) |
| 7.5-14.9 | 34580 (25) | 29200 (24) | 2124 (27) | 2379 (26) | 606 (25) |
| 15-29.9 | 41637 (30) | 35364 (30) | 2300 (29) | 2617 (28) | 706 (30) |
| 30-59.9 | 25956 (18) | 22080 (18) | 1374 (17) | 1636 (18) | 400 (17) |
| ≥60 | 7184 (5) | 6163 (5) | 333 (4) | 394 (4) | 97 (4) |
| Alcohol intake, g/day | 6.3±9.3 | 6.3±9.2 | 7.4±10.7 | 6.6±9.8 | 8.0±11.3 |
| Height, cm | 167.5±8.7 | 167.5±8.7 | 167.7±8.7 | 167.6±8.6 | 167.9±9.0 |
| Regular aspirin usec | |||||
| No | 91616 (65) | 77646 (65) | 5187 (66) | 6043 (66) | 1565 (66) |
| Yes | 49527 (35) | 42030 (35) | 2758 (34) | 3169 (34) | 817 (34) |
| Total fiber intake, g/day | 19.6±5.4 | 19.6±5.4 | 19.1±5.1 | 19.3±5.2 | 18.9±4.9 |
| Total folate intake, μg/day | 527±212 | 528±213 | 513±202 | 511±202 | 499±196 |
| Calcium intake, mg/day | 1086±392 | 1088±393 | 1063±373 | 1057±376 | 1039±369 |
| Vitamin D intake, IU/day | 415±214 | 416±215 | 397±202 | 395±202 | 385±194 |
| Marine omega-3 fatty acid intake, g/day | 0.25±0.20 | 0.25±0.20 | 0.24±0.18 | 0.24±0.18 | 0.25±0.18 |
| Processed red meat intake, serving/week | 1.68±1.60 | 1.68±1.60 | 1.77±1.61 | 1.74±1.56 | 1.79±1.62 |
Abbreviations: NHS, the Nurses’ Health Study; NHS2, the Nurses’ Health Study 2; HPFS, the Health Professionals Follow-up Study; SP, serrated polyp; MET, metabolic equivalent task.
The presented data are based on repeatedly collected information for each participant up to polyp diagnosis (for cases) or the end of follow-up period (for controls). All variables are adjusted for age and sex except for age and sex themselves. Cumulative average values across person-endoscopies are presented. Mean ±SD is presented for continuous variables and number of participants (percentage) for categorical variables.
Because pathological diagnosis was missing or undefined for 1928 polyp cases, the sum of the number of non-polyps and polyps of different groups is not equal to the overall number.
Physical activity is represented by the product sum of the MET of each specific recreational activity and hours spent on that activity per week.
A standard tablet contains 325 mg aspirin, and regular users were defined as those who used at least two standard tablets per week.
Table 2 presents the multivariable associations of CRC risk factors with SPs and conventional adenomas, and Tables 3 and 4 show the subgroup results according to polyp features. We briefly summarize below the main findings of these analyses for each of the risk factors.
Table 2.
Multivariable associations of CRC risk factors with risk of SPs and conventional adenomas in the three cohort studies (NHS, NHS2, HPFS)a
| Risk factor | Case-control comparison
|
Case-case comparison (SPs-only compared to conventional adenomas-only) OR (95% CI) | Synchronous SPs and conventional
|
|||||
|---|---|---|---|---|---|---|---|---|
| Non-polyp
|
SPs-only
|
conventional adenomas-only
|
||||||
| No. of person-endoscopies | n | OR (95% CI) | n | OR (95% CI) | n | OR (95% CI) | ||
| Family history of colorectal cancer | ||||||||
| No | 263164 | 5956 | 1(ref) | 7000 | 1(ref) | 1(ref) | 1792 | 1(ref) |
| Yes | 69036 | 1989 | 1.51(1.43-1.59) | 2212 | 1.46(1.39-1.54) | 1.00(0.93-1.08) | 590 | 1.56(1.41-1.71) |
| P | <.001 | <.001 | .96 | <.001 | ||||
| Smoking status | ||||||||
| Never | 181806 | 3715 | 1(ref) | 4889 | 1(ref) | 1(ref) | 964 | 1(ref) |
| Past smokers | ||||||||
| <30 pack-years | 109181 | 2660 | 1.24(1.18-1.31) | 2983 | 1.01(0.96-1.06) | 1.22(1.14-1.31) | 837 | 1.36(1.23-1.49) |
| ≥30 pack-years | 24178 | 717 | 1.70(1.56-1.85) | 833 | 1.12(1.03-1.21) | 1.49(1.33-1.68) | 296 | 1.85(1.60-2.13) |
| Current smokers | ||||||||
| <30 pack-years | 7550 | 354 | 1.87(1.67-2.10) | 193 | 0.92(0.79-1.07) | 1.93(1.60-2.33) | 90 | 2.17(1.74-2.71) |
| ≥30 pack-years | 9485 | 499 | 2.52(2.29-2.78) | 314 | 1.13(1.00-1.27) | 2.16(1.86-2.51) | 195 | 3.49(2.97-4.09) |
| P for trend | <.001 | <.001 | <.001 | <.001 | ||||
| Body mass index, kg/m2 | ||||||||
| <25 | 147480 | 3084 | 1(ref) | 3823 | 1(ref) | 1(ref) | 832 | 1(ref) |
| 25-29.9 | 116599 | 2876 | 1.20(1.14-1.26) | 3470 | 1.08(1.03-1.13) | 1.11(1.03-1.19) | 933 | 1.32(1.20-1.45) |
| 30-34.9 | 44749 | 1290 | 1.37(1.28-1.46) | 1302 | 1.13(1.06-1.21) | 1.21(1.10-1.33) | 394 | 1.59(1.40-1.79) |
| ≥35 | 23372 | 695 | 1.34(1.23-1.46) | 617 | 1.07(0.98-1.17) | 1.25(1.10-1.41) | 223 | 1.90(1.63-2.21) |
| P for trend | <.001 | <.001 | <.001 | <.001 | ||||
| Physical activity, MET-hours/week | ||||||||
| <7.5 | 74745 | 1826 | 1(ref) | 2059 | 1(ref) | 1(ref) | 532 | 1(ref) |
| 7.5-14.9 | 81188 | 2127 | 1.15(1.08-1.23) | 2307 | 1.05(0.99-1.12) | 1.11(1.02-1.21) | 589 | 1.08(0.96-1.22) |
| 15-29.9 | 98136 | 2279 | 1.06(0.99-1.13) | 2633 | 0.97(0.92-1.03) | 1.12(1.02-1.22) | 718 | 1.10(0.98-1.23) |
| 30-59.9 | 61101 | 1375 | 1.06(0.98-1.14) | 1765 | 0.99(0.93-1.06) | 1.10(0.99-1.21) | 431 | 1.02(0.89-1.16) |
| ≥60 | 17030 | 338 | 0.92(0.82-1.04) | 448 | 0.87(0.78-0.97) | 1.11(0.95-1.31) | 112 | 0.95(0.77-1.17) |
| P for trend | .07 | .005 | .24 | .41 | ||||
| Alcohol intake, g/day | ||||||||
| Never | 66463 | 1417 | 1(ref) | 1709 | 1(ref) | 1(ref) | 354 | 1(ref) |
| <7 for men, <3.5 for women | 131654 | 3103 | 1.17(1.09-1.24) | 3613 | 1.08(1.02-1.15) | 1.08(0.99-1.18) | 853 | 1.20(1.06-1.36) |
| 7-13.9 for men, 3.5-6.9 for women | 53207 | 1299 | 1.25(1.15-1.35) | 1477 | 1.07(1.00-1.15) | 1.16(1.04-1.29) | 412 | 1.43(1.24-1.66) |
| ≥14 for men, ≥7 for women | 80876 | 2126 | 1.33(1.24-1.43) | 2413 | 1.17(1.10-1.25) | 1.14(1.04-1.26) | 763 | 1.67(1.47-1.91) |
| P for trend | <.001 | <.001 | .02 | <.001 | ||||
| Height, per 10cm | 332200 | 7945 | 1.04(1.01-1.08) | 9212 | 1.03(0.99-1.06) | 1.01(0.96-1.06) | 2382 | 1.13(1.06-1.20) |
| P for trend | .01 | .10 | .70 | <.001 | ||||
| Regular aspirin use | ||||||||
| No | 215497 | 5438 | 1(ref) | 5912 | 1(ref) | 1(ref) | 1497 | 1(ref) |
| Yes | 116703 | 2507 | 0.96(0.91-1.01) | 3300 | 0.96(0.92-1.00) | 1.00(0.93-1.07) | 885 | 0.94(0.86-1.03) |
| P | .10 | .08 | .96 | .18 | ||||
| Total fiber intake | ||||||||
| Quartile 1 | 82802 | 2221 | 1(ref) | 2279 | 1(ref) | 1(ref) | 623 | 1(ref) |
| Quartile 2 | 83047 | 2063 | 1.03(0.97-1.09) | 2217 | 0.99(0.93-1.05) | 1.04(0.95-1.14) | 606 | 1.07(0.95-1.19) |
| Quartile 3 | 82936 | 1952 | 1.02(0.96-1.09) | 2346 | 1.03(0.97-1.09) | 1.01(0.92-1.10) | 623 | 1.10(0.98-1.24) |
| Quartile 4 | 83415 | 1709 | 0.97(0.90-1.04) | 2370 | 0.98(0.91-1.04) | 0.99(0.90-1.10) | 530 | 0.92(0.81-1.05) |
| P for trend | .34 | .61 | .72 | .23 | ||||
| Total folate intake | ||||||||
| Quartile 1 | 82759 | 2091 | 1(ref) | 2388 | 1(ref) | 1(ref) | 649 | 1(ref) |
| Quartile 2 | 82649 | 2121 | 1.14(1.07-1.21) | 2460 | 1.07(1.01-1.14) | 1.06(0.97-1.15) | 640 | 1.03(0.92-1.16) |
| Quartile 3 | 83260 | 1916 | 1.08(1.01-1.15) | 2249 | 1.01(0.95-1.07) | 1.06(0.97-1.16) | 559 | 0.94(0.84-1.06) |
| Quartile 4 | 83532 | 1817 | 1.04(0.97-1.11) | 2115 | 0.93(0.87-0.99) | 1.12(1.02-1.23) | 534 | 0.90(0.80-1.02) |
| P for trend | .79 | .002 | .03 | .03 | ||||
| Total calcium intake | ||||||||
| Quartile 1 | 82432 | 2034 | 1(ref) | 2603 | 1(ref) | 1(ref) | 719 | 1(ref) |
| Quartile 2 | 82846 | 2057 | 1.07(1.01-1.14) | 2458 | 1.02(0.96-1.08) | 1.05(0.96-1.14) | 617 | 0.95(0.85-1.06) |
| Quartile 3 | 83078 | 2060 | 1.11(1.04-1.19) | 2218 | 0.98(0.92-1.04) | 1.12(1.03-1.23) | 579 | 0.96(0.86-1.08) |
| Quartile 4 | 83844 | 1794 | 1.00(0.93-1.07) | 1933 | 0.90(0.85-0.96) | 1.11(1.01-1.22) | 467 | 0.85(0.75-0.96) |
| P for trend | .98 | <.001 | .01 | .02 | ||||
| Total vitamin D intake | ||||||||
| Quartile 1 | 82435 | 2215 | 1(ref) | 2560 | 1(ref) | 1(ref) | 657 | 1(ref) |
| Quartile 2 | 82921 | 2051 | 1.00(0.94-1.06) | 2331 | 0.94(0.89-0.99) | 1.06(0.97-1.15) | 655 | 1.04(0.93-1.16) |
| Quartile 3 | 83174 | 1949 | 1.00(0.94-1.07) | 2249 | 0.93(0.88-0.99) | 1.07(0.98-1.17) | 560 | 0.93(0.82-1.04) |
| Quartile 4 | 83670 | 1730 | 0.92(0.86-0.98) | 2072 | 0.85(0.80-0.90) | 1.09(1.00-1.19) | 510 | 0.85(0.76-0.96) |
| P for trend | .02 | <.001 | .06 | .002 | ||||
| Marine omega-3 fatty acid intake | ||||||||
| Quartile 1 | 82527 | 2213 | 1(ref) | 2352 | 1(ref) | 1(ref) | 560 | 1(ref) |
| Quartile 2 | 83076 | 2088 | 1.00(0.94-1.06) | 2386 | 1.01(0.95-1.07) | 1.00(0.92-1.08) | 597 | 1.02(0.91-1.15) |
| Quartile 3 | 83160 | 1975 | 0.99(0.93-1.05) | 2272 | 0.95(0.89-1.01) | 1.03(0.95-1.13) | 611 | 1.02(0.91-1.15) |
| Quartile 4 | 83437 | 1669 | 0.90(0.84-0.96) | 2202 | 0.89(0.84-0.95) | 1.02(0.93-1.12) | 614 | 1.02(0.90-1.15) |
| P for trend | .004 | <.001 | .54 | .82 | ||||
| Processed red meat intake | ||||||||
| Quartile 1 | 85044 | 1815 | 1(ref) | 2225 | 1(ref) | 1(ref) | 516 | 1(ref) |
| Quartile 2 | 81533 | 1964 | 1.08(1.01-1.16) | 2135 | 0.99(0.93-1.06) | 1.09(1.00-1.19) | 588 | 1.10(0.98-1.24) |
| Quartile 3 | 83076 | 2011 | 1.05(0.98-1.12) | 2340 | 1.04(0.98-1.11) | 1.01(0.92-1.10) | 593 | 1.02(0.91-1.15) |
| Quartile 4 | 82547 | 2155 | 1.06(0.99-1.13) | 2512 | 1.04(0.98-1.10) | 1.02(0.94-1.12) | 685 | 1.03(0.91-1.15) |
| P for trend | .28 | .13 | .86 | .85 | ||||
Abbreviations: CRC, colorectal cancer; SP, serrated polyp; NHS, the Nurses’ Health Study; NHS2, the Nurses’ Health Study 2; HPFS, the Health Professionals Follow-up Study; OR, odd ratio; CI, confidence interval; MET, metabolic equivalent task.
Multivariable logistic regression model was used with adjustment for cohort (NHS, NHS2, HPFS), time period of endoscopy (in 2-year intervals), number of prior endoscopies (continuous), time in years since the most recent endoscopy (continuous), reason for endoscopy (routine screening or symptom), race (Caucasian or non-Caucasian), age (continuous, per 10 years), family history of colorectal cancer (yes or no), pack-years of smoking (continuous), body mass index (continuous), physical activity (median in each category), alcohol intake (median in each category), height (continuous, per 10 cm), regular aspirin use (yes or no). For dietary factors, test for trend was conducted using the median of each quartile as a continuous variable.
Table 3.
Multivariable associations of CRC risk factors with risk of SPs according to polyp features in the three cohort studies (NHS, NHS2, HPFS)a
| Risk factor | Anatomic subsite
|
Size
|
SPs in the proximal colon or ≥10mm |
||||||||||
|---|---|---|---|---|---|---|---|---|---|---|---|---|---|
| Proximal colon
|
Distal colon
|
Rectum
|
<10mm
|
≥10mm
|
|||||||||
| n | OR (95% CI) | n | OR (95% CI) | n | OR (95% CI) | n | OR (95% CI) | n | OR (95% CI) | n | OR (95% CI) | ||
| Family history of colorectal cancer | |||||||||||||
| No | 1716 | 1(ref) | 1976 | 1(ref) | 1688 | 1(ref) | 3995 | 1(ref) | 465 | 1(ref) | 1877 | 1(ref) | |
| Yes | 373 | 1.14(1.02-1.29) | 524 | 1.41(1.27-1.56) | 418 | 1.33(1.19-1.48) | 976 | 1.27(1.18-1.36) | 127 | 1.52(1.24-1.86) | 415 | 1.17(1.05-1.31) | |
| P | .02 | <.001 | <.001 | <.001 | <.001 | .004 | |||||||
| P for heterogeneity | .001 | .05 | .13 | ||||||||||
| Smoking status | |||||||||||||
| Never | 1140 | 1(ref) | 1172 | 1(ref) | 955 | 1(ref) | 2498 | 1(ref) | 275 | 1(ref) | 1212 | 1(ref) | |
| Past smokers | |||||||||||||
| <30 pack-years | 681 | 1.10(1.00-1.22) | 856 | 1.32(1.21-1.45) | 739 | 1.39(1.26-1.53) | 1672 | 1.21(1.14-1.29) | 206 | 1.34(1.12-1.62) | 760 | 1.16(1.05-1.27) | |
| ≥30 pack-years | 120 | 1.21(0.99-1.48) | 187 | 1.75(1.48-2.07) | 165 | 1.86(1.56-2.22) | 345 | 1.54(1.37-1.74) | 50 | 1.87(1.35-2.59) | 144 | 1.34(1.12-1.62) | |
| Current smokers | |||||||||||||
| <30 pack-years | 71 | 1.36(1.06-1.74) | 125 | 2.29(1.89-2.78) | 104 | 2.37(1.92-2.92) | 208 | 1.81(1.56-2.10) | 24 | 1.93(1.26-2.93) | 79 | 1.43(1.13-1.80) | |
| ≥30 pack-years | 77 | 1.59(1.26-2.02) | 160 | 3.12(2.62-3.71) | 143 | 3.41(2.84-4.09) | 248 | 2.29(1.99-2.63) | 37 | 3.01(2.13-4.27) | 97 | 1.87(1.52-2.32) | |
| P for trend | .001 | <.001 | <.001 | <.001 | <.001 | <.001 | |||||||
| P for heterogeneity | <.001 | <.001 | .11 | ||||||||||
| Body mass index, kg/m2 | |||||||||||||
| <25 | 838 | 1(ref) | 858 | 1(ref) | 733 | 1(ref) | 1829 | 1(ref) | 231 | 1(ref) | 900 | 1(ref) | |
| 25-29.9 | 725 | 1.09(0.98-1.21) | 891 | 1.29(1.17-1.42) | 787 | 1.32(1.19-1.46) | 1801 | 1.23(1.15-1.32) | 191 | 1.04(0.85-1.27) | 801 | 1.11(1.01-1.23) | |
| 30-34.9 | 356 | 1.27(1.12-1.44) | 455 | 1.54(1.37-1.74) | 352 | 1.39(1.22-1.58) | 822 | 1.32(1.21-1.44) | 122 | 1.60(1.28-2.01) | 398 | 1.31(1.16-1.48) | |
| ≥35 | 170 | 1.05(0.89-1.24) | 296 | 1.76(1.53-2.02) | 234 | 1.64(1.41-1.91) | 519 | 1.44(1.30-1.60) | 48 | 1.14(0.83-1.57) | 193 | 1.11(0.94-1.30) | |
| P for trend | .005 | <.001 | <.001 | <.001 | .006 | <.001 | |||||||
| P for heterogeneity | <.001 | <.001 | .66 | ||||||||||
| Physical activity, MET-hours/week | |||||||||||||
| <7.5 | 424 | 1(ref) | 543 | 1(ref) | 454 | 1(ref) | 1032 | 1(ref) | 131 | 1(ref) | 472 | 1(ref) | |
| 7.5-14.9 | 544 | 1.13(0.99-1.29) | 678 | 1.17(1.04-1.31) | 582 | 1.19(1.05-1.35) | 1366 | 1.20(1.11-1.31) | 133 | 0.93(0.73-1.19) | 591 | 1.12(0.99-1.26) | |
| 15-29.9 | 623 | 1.07(0.94-1.21) | 763 | 1.12(1.00-1.26) | 621 | 1.07(0.95-1.21) | 1489 | 1.11(1.02-1.20) | 178 | 1.05(0.84-1.32) | 689 | 1.08(0.96-1.22) | |
| 30-59.9 | 410 | 1.16(1.00-1.33) | 408 | 1.02(0.89-1.16) | 348 | 1.00(0.87-1.16) | 864 | 1.08(0.98-1.19) | 123 | 1.22(0.94-1.57) | 444 | 1.15(1.00-1.32) | |
| ≥60 | 88 | 0.90(0.71-1.14) | 108 | 1.00(0.81-1.24) | 101 | 1.08(0.87-1.35) | 220 | 1.02(0.88-1.19) | 27 | 1.00(0.65-1.52) | 96 | 0.91(0.73-1.14) | |
| P for trend | .82 | .40 | .60 | .58 | .23 | .89 | |||||||
| P for heterogeneity | .49 | .86 | .10 | ||||||||||
| Alcohol intake, g/day | |||||||||||||
| Never | 349 | 1(ref) | 417 | 1(ref) | 345 | 1(ref) | 831 | 1(ref) | 97 | 1(ref) | 381 | 1(ref) | |
| <7 for men, <3.5 for women | 844 | 1.20(1.06-1.36) | 974 | 1.17(1.04-1.31) | 811 | 1.15(1.01-1.31) | 1967 | 1.17(1.08-1.27) | 214 | 1.08(0.85-1.38) | 923 | 1.20(1.06-1.35) | |
| 7-13.9 for men, 3.5-6.9 for women | 355 | 1.29(1.11-1.51) | 419 | 1.33(1.16-1.53) | 333 | 1.24(1.06-1.44) | 804 | 1.25(1.13-1.39) | 116 | 1.51(1.14-1.98) | 396 | 1.32(1.15-1.53) | |
| ≥14 for men, ≥7 for women | 541 | 1.39(1.20-1.60) | 690 | 1.51(1.32-1.71) | 617 | 1.56(1.36-1.79) | 1369 | 1.47(1.34-1.62) | 165 | 1.44(1.11-1.87) | 592 | 1.38(1.21-1.58) | |
| P for trend | <.001 | <.001 | <.001 | <.001 | .002 | <.001 | |||||||
| P for heterogeneity | .11 | .02 | 0.93 | ||||||||||
| Height, per 10cm | 2089 | 1.17(1.10-1.25) | 2500 | 1.11(1.04-1.18) | 2106 | 1.04(0.97-1.11) | 4971 | 1.06(1.02-1.11) | 592 | 1.24(1.09-1.41) | 2292 | 1.18(1.11-1.26) | |
| P for trend | <.001 | .001 | .29 | .007 | .001 | <.001 | |||||||
| P for heterogeneity | .51 | .04 | .08 | ||||||||||
| Regular aspirin use | |||||||||||||
| No | 1533 | 1(ref) | 1804 | 1(ref) | 1513 | 1(ref) | 3563 | 1(ref) | 444 | 1(ref) | 1678 | 1(ref) | |
| Yes | 556 | 0.89(0.80-0.98) | 696 | 0.90(0.81-0.99) | 593 | 0.89(0.80-0.98) | 1408 | 0.94(0.88-1.01) | 148 | 0.72(0.59-0.87) | 614 | 0.87(0.79-0.97) | |
| P | .02 | .02 | .02 | .09 | .001 | .008 | |||||||
| P for heterogeneity | .93 | .28 | .004 | ||||||||||
| Total fiber intake | |||||||||||||
| Quartile 1 | 499 | 1(ref) | 712 | 1(ref) | 638 | 1(ref) | 1378 | 1(ref) | 161 | 1(ref) | 576 | 1(ref) | |
| Quartile 2 | 502 | 1.07(0.94-1.21) | 640 | 1.04(0.93-1.16) | 512 | 0.92(0.82-1.04) | 1250 | 1.01(0.93-1.10) | 147 | 1.03(0.82-1.28) | 548 | 1.02(0.91-1.15) | |
| Quartile 3 | 568 | 1.23(1.09-1.40) | 631 | 1.07(0.96-1.20) | 530 | 1.00(0.89-1.14) | 1257 | 1.06(0.98-1.15) | 153 | 1.09(0.87-1.37) | 615 | 1.17(1.04-1.32) | |
| Quartile 4 | 520 | 1.17(1.02-1.34) | 517 | 0.95(0.84-1.08) | 426 | 0.86(0.75-0.99) | 1086 | 0.98(0.90-1.08) | 131 | 0.97(0.76-1.25) | 553 | 1.10(0.96-1.24) | |
| P for trend | .008 | .52 | .08 | .93 | .92 | .07 | |||||||
| P for heterogeneity | .01 | .003 | .95 | ||||||||||
| Total folate intake | |||||||||||||
| Quartile 1 | 530 | 1(ref) | 716 | 1(ref) | 639 | 1(ref) | 1372 | 1(ref) | 163 | 1(ref) | 596 | 1(ref) | |
| Quartile 2 | 557 | 1.18(1.05-1.34) | 665 | 1.11(0.99-1.23) | 524 | 0.97(0.86-1.09) | 1292 | 1.09(1.01-1.18) | 162 | 1.15(0.92-1.44) | 617 | 1.18(1.05-1.32) | |
| Quartile 3 | 507 | 1.12(0.99-1.27) | 592 | 1.06(0.94-1.18) | 487 | 0.96(0.85-1.09) | 1189 | 1.06(0.98-1.15) | 140 | 1.05(0.84-1.33) | 549 | 1.09(0.97-1.23) | |
| Quartile 4 | 495 | 1.09(0.96-1.24) | 527 | 0.98(0.87-1.10) | 456 | 0.93(0.82-1.06) | 1118 | 1.03(0.95-1.12) | 127 | 0.98(0.77-1.24) | 530 | 1.06(0.94-1.20) | |
| P for trend | .33 | .52 | .30 | .60 | .68 | .60 | |||||||
| P for heterogeneity | .09 | .06 | .89 | ||||||||||
| Total calcium intake | |||||||||||||
| Quartile 1 | 520 | 1(ref) | 733 | 1(ref) | 583 | 1(ref) | 1306 | 1(ref) | 171 | 1(ref) | 593 | 1(ref) | |
| Quartile 2 | 549 | 1.13(1.00-1.28) | 644 | 0.98(0.88-1.10) | 554 | 1.08(0.95-1.21) | 1314 | 1.10(1.01-1.19) | 147 | 0.95(0.76-1.18) | 604 | 1.10(0.98-1.23) | |
| Quartile 3 | 545 | 1.18(1.04-1.33) | 594 | 0.98(0.87-1.10) | 528 | 1.12(0.99-1.26) | 1257 | 1.12(1.03-1.22) | 144 | 0.99(0.79-1.24) | 589 | 1.13(1.01-1.27) | |
| Quartile 4 | 475 | 1.06(0.93-1.21) | 529 | 0.94(0.83-1.05) | 441 | 1.01(0.89-1.16) | 1094 | 1.03(0.95-1.13) | 130 | 0.95(0.75-1.20) | 506 | 1.01(0.89-1.15) | |
| P for trend | .38 | .28 | .75 | .46 | .75 | .85 | |||||||
| P for heterogeneity | .14 | .80 | .93 | ||||||||||
| Total vitamin D intake | |||||||||||||
| Quartile 1 | 580 | 1(ref) | 771 | 1(ref) | 632 | 1(ref) | 1433 | 1(ref) | 185 | 1(ref) | 650 | 1(ref) | |
| Quartile 2 | 533 | 0.99(0.88-1.12) | 644 | 0.94(0.84-1.04) | 562 | 0.99(0.89-1.12) | 1292 | 0.99(0.92-1.07) | 158 | 0.94(0.76-1.17) | 588 | 0.98(0.88-1.10) | |
| Quartile 3 | 522 | 1.03(0.92-1.17) | 582 | 0.92(0.83-1.03) | 486 | 0.94(0.83-1.06) | 1208 | 1.00(0.92-1.08) | 129 | 0.82(0.66-1.03) | 564 | 1.01(0.90-1.13) | |
| Quartile 4 | 454 | 0.93(0.82-1.06) | 503 | 0.85(0.76-0.96) | 426 | 0.88(0.78-1.00) | 1038 | 0.91(0.84-0.99) | 120 | 0.81(0.64-1.02) | 490 | 0.91(0.81-1.03) | |
| P for trend | .38 | .008 | .03 | .04 | .04 | .18 | |||||||
| P for heterogeneity | .23 | .46 | .61 | ||||||||||
| Marine omega-3 fatty acid intake | |||||||||||||
| Quartile 1 | 548 | 1(ref) | 654 | 1(ref) | 568 | 1(ref) | 1332 | 1(ref) | 139 | 1(ref) | 590 | 1(ref) | |
| Quartile 2 | 522 | 1.01(0.89-1.14) | 691 | 1.10(0.98-1.22) | 570 | 1.03(0.91-1.16) | 1323 | 1.03(0.95-1.11) | 163 | 1.20(0.95-1.51) | 578 | 1.03(0.92-1.16) | |
| Quartile 3 | 543 | 1.12(0.99-1.26) | 638 | 1.08(0.96-1.21) | 513 | 0.97(0.86-1.10) | 1250 | 1.03(0.95-1.12) | 164 | 1.27(1.01-1.61) | 600 | 1.14(1.01-1.29) | |
| Quartile 4 | 476 | 1.07(0.93-1.22) | 517 | 0.97(0.86-1.10) | 455 | 0.94(0.82-1.07) | 1066 | 0.97(0.89-1.06) | 126 | 1.06(0.82-1.37) | 524 | 1.09(0.96-1.24) | |
| P for trend | .23 | .37 | .25 | .43 | .82 | .13 | |||||||
| P for heterogeneity | .32 | .08 | .32 | ||||||||||
| Processed red meat intake | |||||||||||||
| Quartile 1 | 506 | 1(ref) | 540 | 1(ref) | 448 | 1(ref) | 1132 | 1(ref) | 133 | 1(ref) | 540 | 1(ref) | |
| Quartile 2 | 557 | 1.11(0.98-1.26) | 635 | 1.13(1.00-1.27) | 496 | 1.06(0.93-1.21) | 1254 | 1.08(1.00-1.18) | 153 | 1.13(0.89-1.43) | 602 | 1.12(0.99-1.26) | |
| Quartile 3 | 513 | 1.02(0.90-1.16) | 632 | 1.08(0.96-1.22) | 551 | 1.13(0.99-1.28) | 1252 | 1.05(0.97-1.14) | 158 | 1.14(0.90-1.44) | 577 | 1.06(0.94-1.20) | |
| Quartile 4 | 513 | 0.97(0.85-1.10) | 693 | 1.07(0.95-1.21) | 611 | 1.14(1.00-1.29) | 1333 | 1.05(0.96-1.14) | 148 | 0.97(0.76-1.23) | 573 | 0.99(0.88-1.12) | |
| P for trend | .26 | .56 | .05 | .60 | .53 | .42 | |||||||
| P for heterogeneity | .40 | .02 | .41 | ||||||||||
Abbreviations: CRC, colorectal cancer; SP, serrated polyp; NHS, the Nurses’ Health Study; NHS2, the Nurses’ Health Study 2; HPFS, the Health Professionals Follow-up Study; OR, odd ratio; CI, confidence interval; MET, metabolic equivalent task.
Multivariable logistic regression model was used with adjustment for cohort (NHS, NHS2, HPFS), time period of endoscopy (in 2-year intervals), number of prior endoscopies (continuous), time in years since the most recent endoscopy (continuous), reason for endoscopy (routine screening or symptom), race (Caucasian or non-Caucasian), age (continuous, per 10 years), family history of colorectal cancer (yes or no), pack-years of smoking (continuous), body mass index (continuous), physical activity (median in each category), alcohol intake (median in each category), height (continuous, per 10 cm), regular aspirin use (yes or no). For dietary factors, test for trend was conducted using the median of each quartile as a continuous variable. P for heterogeneity was calculated through case-only analysis by comparing polyps with different features.
Table 4.
Multivariable associations of CRC risk factors with risk of conventional adenomas according to polyp features in the three cohort studies (NHS, NHS2, HPFS)a
| Risk factor | Anatomic subsite
|
Feature
|
||||||||
|---|---|---|---|---|---|---|---|---|---|---|
| Proximal colon
|
Distal colon
|
Rectum
|
Non-advanced
|
Advanced
|
||||||
| n | OR (95% CI) | n | OR (95% CI) | n | OR (95% CI) | n | OR 95% CI) | n | OR (95% CI) | |
| Family history of colorectal cancer | ||||||||||
| No | 4459 | 1(ref) | 4201 | 1(ref) | 1495 | 1(ref) | 5640 | 1(ref) | 3152 | 1(ref) |
| Yes | 1445 | 1.51(1.42-1.60) | 1367 | 1.52(1.42-1.62) | 444 | 1.43(1.29-1.60) | 1752 | 1.42(1.35-1.50) | 1050 | 1.57(1.46-1.69) |
| P | <.001 | <.001 | <.001 | <.001 | <.001 | |||||
| P for heterogeneity | .28 | .16 | .09 | |||||||
| Smoking status | ||||||||||
| Never | 3048 | 1(ref) | 2692 | 1(ref) | 925 | 1(ref) | 3817 | 1(ref) | 2036 | 1(ref) |
| Past smokers | ||||||||||
| <30 pack-years | 1948 | 1.03(0.97-1.09) | 1858 | 1.12(1.06-1.19) | 633 | 1.13(1.02-1.25) | 2478 | 1.08(1.03-1.14) | 1342 | 1.04(0.97-1.12) |
| ≥30 pack-years | 551 | 1.12(1.02-1.24) | 580 | 1.34(1.22-1.48) | 231 | 1.62(1.39-1.89) | 620 | 1.17(1.07-1.28) | 509 | 1.35(1.21-1.49) |
| Current smokers | ||||||||||
| <30 pack-years | 119 | 0.98(0.81-1.18) | 153 | 1.28(1.08-1.51) | 53 | 1.26(0.95-1.68) | 176 | 1.06(0.91-1.23) | 107 | 1.27(1.04-1.55) |
| ≥30 pack-years | 238 | 1.45(1.26-1.66) | 285 | 1.74(1.53-1.98) | 97 | 1.79(1.44-2.21) | 301 | 1.48(1.31-1.68) | 208 | 1.57(1.36-1.82) |
| P for trend | <.001 | <.001 | <.001 | <.001 | <.001 | |||||
| P for heterogeneity | <.001 | <.001 | .007 | |||||||
| Body mass index, kg/m2 | ||||||||||
| <25 | 2272 | 1(ref) | 2237 | 1(ref) | 795 | 1(ref) | 2963 | 1(ref) | 1692 | 1(ref) |
| 25-29.9 | 2289 | 1.17(1.10-1.24) | 2102 | 1.12(1.05-1.19) | 744 | 1.12(1.01-1.24) | 2783 | 1.12(1.07-1.19) | 1620 | 1.12(1.05-1.20) |
| 30-34.9 | 899 | 1.30(1.20-1.41) | 807 | 1.22(1.12-1.32) | 272 | 1.16(1.01-1.33) | 1105 | 1.22(1.14-1.31) | 591 | 1.20(1.09-1.32) |
| ≥35 | 444 | 1.32(1.19-1.47) | 422 | 1.30(1.17-1.45) | 128 | 1.11(0.92-1.35) | 541 | 1.17(1.06-1.29) | 299 | 1.30(1.14-1.48) |
| P for trend | <.001 | <.001 | .01 | <.001 | <.001 | |||||
| P for heterogeneity | .66 | .01 | .90 | |||||||
| Physical activity, MET-hours/week | ||||||||||
| <7.5 | 1282 | 1(ref) | 1304 | 1(ref) | 432 | 1(ref) | 1607 | 1(ref) | 984 | 1(ref) |
| 7.5-14.9 | 1470 | 1.05(0.98-1.14) | 1384 | 1.03(0.96-1.12) | 479 | 1.07(0.94-1.22) | 1844 | 1.06(0.99-1.14) | 1052 | 1.05(0.96-1.15) |
| 15-29.9 | 1725 | 0.99(0.92-1.06) | 1606 | 0.99(0.91-1.06) | 520 | 0.95(0.84-1.09) | 2149 | 1.00(0.94-1.07) | 1202 | 0.99(0.91-1.08) |
| 30-59.9 | 1134 | 0.97(0.89-1.05) | 1031 | 0.97(0.89-1.06) | 398 | 1.11(0.97-1.28) | 1421 | 1.01(0.94-1.09) | 775 | 0.97(0.88-1.07) |
| ≥60 | 293 | 0.87(0.76-0.99) | 243 | 0.80(0.69-0.92) | 110 | 1.08(0.87-1.33) | 371 | 0.91(0.81-1.03) | 189 | 0.84(0.71-0.98) |
| P for trend | .007 | .001 | .30 | .08 | .01 | |||||
| P for heterogeneity | .47 | .02 | .10 | |||||||
| Alcohol intake, g/day | ||||||||||
| Never | 1026 | 1(ref) | 977 | 1(ref) | 356 | 1(ref) | 1321 | 1(ref) | 742 | 1(ref) |
| <7 for men, <3.5 for women | 2286 | 1.10(1.02-1.19) | 2139 | 1.14(1.05-1.23) | 724 | 1.04(0.91-1.18) | 2863 | 1.09(1.02-1.16) | 1603 | 1.12(1.02-1.22) |
| 7-13.9 for men, 3.5-6.9 for women | 975 | 1.13(1.03-1.24) | 902 | 1.17(1.07-1.29) | 309 | 1.06(0.90-1.24) | 1226 | 1.14(1.05-1.23) | 663 | 1.12(1.01-1.25) |
| ≥14 for men, ≥7 for women | 1617 | 1.26(1.16-1.36) | 1550 | 1.31(1.20-1.42) | 550 | 1.22(1.06-1.40) | 1982 | 1.23(1.15-1.33) | 1194 | 1.29(1.17-1.41) |
| P for trend | <.001 | <.001 | .002 | <.001 | <.001 | |||||
| P for heterogeneity | .22 | .81 | .51 | |||||||
| Height, per 10cm | 5904 | 1.06(1.02-1.11) | 5568 | 1.07(1.02-1.11) | 1939 | 1.03(0.96-1.10) | 7392 | 1.04(1.00-1.08) | 4202 | 1.06(1.01-1.11) |
| P for trend | .004 | .002 | .40 | .03 | .02 | |||||
| P for heterogeneity | .48 | .19 | .78 | |||||||
| Regular aspirin use | ||||||||||
| No | 3699 | 1(ref) | 3580 | 1(ref) | 1245 | 1(ref) | 4763 | 1(ref) | 2646 | 1(ref) |
| Yes | 2205 | 0.98(0.92-1.03) | 1988 | 0.92(0.87-0.98) | 694 | 0.94(0.85-1.04) | 2629 | 1.01(0.96-1.06) | 1556 | 0.88(0.82-0.94) |
| P | .42 | .005 | .20 | .82 | <.001 | |||||
| P for heterogeneity | .23 | .40 | .004 | |||||||
| Total fiber intake | ||||||||||
| Quartile 1 | 1358 | 1(ref) | 1515 | 1(ref) | 503 | 1(ref) | 1758 | 1(ref) | 1144 | 1(ref) |
| Quartile 2 | 1448 | 1.05(0.97-1.13) | 1344 | 0.96(0.89-1.03) | 454 | 0.96(0.84-1.09) | 1802 | 1.03(0.97-1.10) | 1021 | 0.97(0.89-1.05) |
| Quartile 3 | 1521 | 1.06(0.98-1.14) | 1403 | 1.00(0.92-1.08) | 510 | 1.06(0.93-1.21) | 1931 | 1.09(1.02-1.16) | 1038 | 0.97(0.89-1.06) |
| Quartile 4 | 1577 | 1.01(0.93-1.10) | 1306 | 0.88(0.81-0.96) | 472 | 0.92(0.80-1.06) | 1901 | 1.03(0.96-1.11) | 999 | 0.86(0.78-0.95) |
| P for trend | .92 | .01 | .36 | .33 | .003 | |||||
| P for heterogeneity | .07 | .51 | .02 | |||||||
| Total folate intake | ||||||||||
| Quartile 1 | 1416 | 1(ref) | 1601 | 1(ref) | 544 | 1(ref) | 1789 | 1(ref) | 1248 | 1(ref) |
| Quartile 2 | 1572 | 1.07(0.99-1.15) | 1491 | 1.04(0.96-1.11) | 511 | 1.02(0.90-1.15) | 1970 | 1.10(1.03-1.17) | 1130 | 1.01(0.93-1.10) |
| Quartile 3 | 1484 | 1.00(0.93-1.08) | 1296 | 0.96(0.89-1.04) | 458 | 0.96(0.84-1.09) | 1847 | 1.04(0.97-1.11) | 961 | 0.93(0.85-1.02) |
| Quartile 4 | 1432 | 0.93(0.86-1.01) | 1180 | 0.88(0.81-0.95) | 426 | 0.87(0.76-1.00) | 1786 | 0.97(0.91-1.04) | 863 | 0.84(0.77-0.92) |
| P for trend | .01 | <.001 | .03 | .09 | <.001 | |||||
| P for heterogeneity | .19 | .54 | .04 | |||||||
| Total calcium intake | ||||||||||
| Quartile 1 | 1636 | 1(ref) | 1701 | 1(ref) | 576 | 1(ref) | 1969 | 1(ref) | 1353 | 1(ref) |
| Quartile 2 | 1565 | 1.00(0.93-1.08) | 1497 | 0.99(0.93-1.07) | 517 | 1.00(0.89-1.13) | 1906 | 1.01(0.95-1.08) | 1169 | 0.99(0.92-1.08) |
| Quartile 3 | 1441 | 0.98(0.91-1.05) | 1307 | 0.95(0.88-1.03) | 460 | 0.97(0.85-1.10) | 1853 | 1.03(0.96-1.10) | 944 | 0.89(0.82-0.97) |
| Quartile 4 | 1262 | 0.90(0.83-0.97) | 1063 | 0.84(0.78-0.92) | 386 | 0.87(0.76-1.00) | 1664 | 0.96(0.89-1.03) | 736 | 0.78(0.71-0.85) |
| P for trend | .005 | <.001 | .04 | .22 | <.001 | |||||
| P for heterogeneity | .11 | .81 | <.001 | |||||||
| Total vitamin D intake | ||||||||||
| Quartile 1 | 1502 | 1(ref) | 1674 | 1(ref) | 586 | 1(ref) | 1911 | 1(ref) | 1306 | 1(ref) |
| Quartile 2 | 1527 | 1.01(0.94-1.08) | 1415 | 0.91(0.84-0.97) | 492 | 0.89(0.79-1.00) | 1903 | 1.01(0.94-1.07) | 1083 | 0.89(0.82-0.97) |
| Quartile 3 | 1489 | 0.99(0.92-1.06) | 1304 | 0.89(0.82-0.96) | 437 | 0.83(0.73-0.94) | 1872 | 1.01(0.94-1.07) | 937 | 0.82(0.75-0.89) |
| Quartile 4 | 1386 | 0.90(0.83-0.97) | 1175 | 0.79(0.74-0.86) | 424 | 0.79(0.70-0.90) | 1706 | 0.91(0.85-0.97) | 876 | 0.75(0.69-0.82) |
| P for trend | .002 | <.001 | <.001 | .005 | <.001 | |||||
| P for heterogeneity | .02 | .12 | .001 | |||||||
| Marine omega-3 fatty acid intake | ||||||||||
| Quartile 1 | 1430 | 1(ref) | 1410 | 1(ref) | 521 | 1(ref) | 1834 | 1(ref) | 1078 | 1(ref) |
| Quartile 2 | 1464 | 0.99(0.92-1.07) | 1486 | 1.04(0.97-1.13) | 502 | 0.96(0.85-1.09) | 1871 | 1.03(0.96-1.10) | 1112 | 0.99(0.91-1.08) |
| Quartile 3 | 1514 | 0.99(0.92-1.06) | 1355 | 0.94(0.87-1.02) | 455 | 0.86(0.75-0.97) | 1859 | 1.01(0.94-1.07) | 1024 | 0.89(0.81-0.97) |
| Quartile 4 | 1496 | 0.92(0.85-0.99) | 1317 | 0.90(0.83-0.97) | 461 | 0.84(0.74-0.96) | 1828 | 0.97(0.91-1.04) | 988 | 0.82(0.75-0.90) |
| P for trend | .04 | .001 | .004 | .33 | <.001 | |||||
| P for heterogeneity | .23 | .05 | .001 | |||||||
| Processed red meat intake | ||||||||||
| Quartile 1 | 1429 | 1(ref) | 1226 | 1(ref) | 466 | 1(ref) | 1818 | 1(ref) | 923 | 1(ref) |
| Quartile 2 | 1394 | 0.99(0.92-1.06) | 1278 | 1.06(0.98-1.15) | 453 | 1.00(0.88-1.14) | 1772 | 0.99(0.93-1.06) | 951 | 1.05(0.96-1.15) |
| Quartile 3 | 1526 | 1.03(0.96-1.11) | 1403 | 1.10(1.02-1.19) | 474 | 0.99(0.87-1.13) | 1894 | 1.02(0.95-1.09) | 1039 | 1.08(0.98-1.18) |
| Quartile 4 | 1555 | 0.96(0.89-1.04) | 1661 | 1.16(1.07-1.25) | 546 | 1.02(0.90-1.16) | 1908 | 0.97(0.90-1.03) | 1289 | 1.16(1.06-1.26) |
| P for trend | .33 | <.001 | .72 | .29 | .001 | |||||
| P for heterogeneity | .001 | .37 | .007 | |||||||
Abbreviations: CRC, colorectal cancer; NHS, the Nurses’ Health Study; NHS2, the Nurses’ Health Study 2; HPFS, the Health Professionals Follow-up Study; OR, odd ratio; CI, confidence interval; MET, metabolic equivalent task.
Multivariable logistic regression model was used with adjustment for cohort (NHS, NHS2, HPFS), time period of endoscopy (in 2-year intervals), number of prior endoscopies (continuous), time in years since the most recent endoscopy (continuous), reason for endoscopy (routine screening or symptom), race (Caucasian or non-Caucasian), age (continuous, per 10 years), family history of colorectal cancer (yes or no), pack-years of smoking (continuous), body mass index (continuous), physical activity (median in each category), alcohol intake (median in each category), height (continuous, per 10 cm), regular aspirin use (yes or no). For dietary factors, test for trend was conducted using the median of each quartile as a continuous variable. P for heterogeneity was calculated through case-only analysis by comparing polyps with different features.
Family history of CRC
Positive history of CRC in a first-degree relative was associated with higher risk of SPs (OR, 1.51; 95% CI, 1.43–1.59) and conventional adenomas (OR, 1.46; 95% CI, 1.39–1.54), with no difference between the two lesions (P for heterogeneity=.96). For SPs, we also noted a difference by anatomic subsite: the association was stronger for distal colon (OR, 1.41; 95% CI, 1.27–1.56; P for heterogeneity=.001) and rectal polyps (OR, 1.33; 95% CI, 1.19–1.48; P for heterogeneity=.05) than proximal colon polyps (OR, 1.14; 95% CI, 1.02–1.29).
Smoking
Compared to never smokers, current smokers with more than 30 pack-years had an almost 2.5-fold increased risk of developing SPs (OR, 2.52; 95% CI, 2.29–2.78) and 13% increased risk of developing conventional adenomas (OR 1.13; 95% CI, 1.00–1.27), yielding an OR of 2.16 (95% CI, 1.86–2.51) comparing SPs to conventional adenomas (reference) in the case-only analysis (P for heterogeneity<.001). The association was even stronger for participants with synchronous SPs and conventional adenomas (OR, 3.49; 95% CI, 2.97–4.09). When stratified by subsite, the associations appeared to be stronger for distal colon (OR, 3.12 for SPs; 1.74 for conventional adenomas) and rectal polyps (OR, 3.41 for SPs; 1.79 for conventional adenomas) than proximal polyps (OR, 1.59 for SPs; 1.45 for conventional adenomas) (P for heterogeneity<.001). For conventional adenomas, the association was stronger for advanced conventional adenomas (OR, 1.57; 95% CI, 1.36–1.82) compared to non-advanced conventional adenomas (OR, 1.48; 95% CI, 1.31–1.68; P for heterogeneity=.007).
BMI
BMI was positively associated with risk of SPs and conventional adenomas, and the association was stronger for SPs than conventional adenomas (P for heterogeneity<.001). The ORs comparing BMI ≥35 kg/m2 to <25 kg/m2 were 1.34 for SPs (95% CI, 1.23–1.46) and 1.07 for conventional adenomas (95% CI, 0.98–1.17), with a stronger association for cases with synchronous SPs and conventional adenomas (OR, 1.90; 95% CI, 1.63–2.21). By subsite, the association was stronger for SPs located in the distal colon (OR, 1.76; 95% CI, 1.53–2.02; P for heterogeneity<.001) and rectum (OR, 1.64; 95% CI, 1.41–1.91; P for heterogeneity<.001) than those in the proximal colon (OR, 1.05; 95% CI, 0.89–1.24).
Physical activity
Compared to individuals who exercised for less than 7.5 MET-hours/week, those who exercised for at least 60 MET-hours/week had a lower risk of conventional adenomas (OR, 0.87; 95% CI, 0.78–0.97; P for trend=.005), whereas no association was found for SPs (OR, 0.92; 95% CI, 0.82–1.04). For conventional adenomas, a stronger association was observed for those located in the distal colon (OR, 0.80; 95% CI, 0.69–0.92) and with advanced histology (OR, 0.84; 95% CI, 0.71–0.98).
Alcohol intake
Compared to never drinkers, heavy alcohol drinkers (≥14 g/d for men, ≥7 g/d for women) had higher risk of SPs (OR, 1.33; 95% CI, 1.24–1.43; P for trend<.001) and conventional adenomas (OR, 1.17; 95% CI, 1.10–1.25; P for trend<.001), with an OR of 1.14 (95% CI, 1.04–1.26, P for heterogeneity=.02) for comparing SPs to conventional adenomas in the case-only analysis. For synchronous SPs and conventional adenomas, the association was stronger (OR, 1.67; 95% CI, 1.47–1.91; P for trend<.001). By subsite, the association was stronger for SPs located in the distal colon (OR, 1.51; 95% CI, 1.32–1.71) and rectum (OR, 1.56; 95% CI, 1.36–1.79) than those in the proximal colon (OR, 1.39; 95% CI, 1.20–1.60).
Height
Height was weakly associated with higher risk of SPs (OR per 10cm increase, 1.04; 95% CI, 1.01–1.08), conventional adenomas (OR, 1.03; 95% CI, 0.99–1.06), and synchronous SPs and conventional adenomas (OR, 1.13; 95% CI, 1.06–1.20; P for trend<.001). For SPs and conventional adenomas, the associations were stronger for polyps located in the proximal colon (OR, 1.17 and 1.06, respectively) and distal colon (OR, 1.11 and 1.07, respectively) than those in the rectum (OR, 1.04 and 1.03, respectively). The association was particularly strong for SPs of ≥10mm (OR, 1.24; 95% CI, 1.09–1.41; P for trend=.001).
Aspirin
While regular aspirin use was not associated with overall SPs (OR, 0.96; 95% CI, 0.91–1.01) or conventional adenomas (OR, 0.96; 95% CI, 0.92–1.00), an inverse association was observed for SPs of ≥10mm (OR, 0.72; 95% CI, 0.59–0.87) and advanced conventional adenomas (OR, 0.88; 95% CI, 0.82–0.94).
Diet
All the ORs described in this section were based on comparison of extreme quartiles. In general, we found that nutritional factors tended to be associated with conventional adenomas relative to SPs, and the associations were stronger for advanced conventional adenomas than non-advanced conventional adenomas. For total fiber intake, although no association was found with either SPs or conventional adenomas, an inverse association was found for advanced conventional adenomas (OR, 0.86; 95% CI, 0.78–0.95; P for heterogeneity=.02). Total folate and calcium intake was inversely associated with risk of conventional adenomas, with the OR of 0.93 (95% CI, 0.87–0.99) and 0.90 (95% CI, 0.85–0.96), respectively, whereas no association was found for SPs (P for heterogeneity=.03 and .01, respectively). Vitamin D intake was inversely associated with SPs (OR, 0.92; 95% CI, 0.86–0.98) and conventional adenomas (OR, 0.85; 95% CI, 0.80–0.90). When analyzed by subsite, the associations with vitamin D were stronger for polyps in the distal colon (OR, 0.85 for SPs and 0.79 for conventional adenomas) than proximal colon (OR, 0.93 for SPs and 0.90 for conventional adenomas). Marine omega-3 fatty acid was associated with lower risk of SPs (OR, 0.90; 95% CI, 0.84–0.96) and conventional adenomas (OR, 0.89; 95% CI, 0.84–0.95), and this inverse association did not vary by polyp subsite or size (P for heterogeneity>.05). We did not find any association between processed red meat intake and SPs or conventional adenomas, although a positive association was observed for distal colon conventional adenomas (OR, 1.16; 95% CI, 1.07–1.25) and advanced conventional adenomas (OR, 1.16; 95% CI, 1.06–1.26).
Sensitivity analysis
Because diminutive distal HPs may have limited malignant potential, we examined the risk factors for SPs after excluding those that were located in the distal colon or rectum and sized less than 10 mm. As shown in Table 3, the results were largely similar to those based on all SPs, with a statistically significant positive association observed for family history of CRC, smoking, BMI, alcohol intake, and height. We also noted a statistically significant inverse association for regular aspirin use (OR, 0.87; 95% CI, 0.79–0.97). When further restricted to large (≥10mm) proximal SPs, the results were similar, although the case number was limited (n=389, Supplementary Table 5). Moreover, the results were essentially unchanged when we excluded “mix/serrated adenoma” from the SP analysis (Supplementary Table 6) and restricted the analysis to participants who had undergone colonoscopies only (Supplementary Table 7).
Discussion
The current study represents a comprehensive analysis that encompasses a total of 13 CRC risk factors for SPs and conventional adenomas in three large prospective cohort studies. We found that, although SPs and conventional adenomas shared many CRC risk factors, some factors were more strongly associated with one lesion than the other. Furthermore, a much stronger association was found for most of the lifestyle factors in relation to synchronous SPs and conventional adenomas. Overall, our results support the etiologic heterogeneity of colorectal neoplasia. Moreover, given that SPs have been suggested as an important contributor for “interval cancers”, our findings have potential clinical implications for CRC prevention.
We found that smoking and alcohol intake were strongly associated with SPs and conventional adenomas, and the associations were stronger for SPs than for conventional adenomas. Consistent with our results, previous studies have consistently linked smoking to increased risk of colorectal polyps.14, 15 In particular, smoking has been strongly associated with higher risk of SSA/P, a subtype of the SP family and a recently recognized precursor lesion for CRC6, 13, especially for proximal CRC32. Because SSA/P was generally not appreciated in clinical practice until 2003–2005, we were unable to rely on pathology reports to provide sufficient information to ascertain and distinguish SSA/P from other SPs. However, consistent with the existing data that SSA/P is more likely to present with a large size (average over 8.5mm) and advanced features33, we found that smoking was more strongly associated with large SPs than small SPs. On the other hand, our findings for a stronger association of smoking with SPs in the distal colon and rectum than in the proximal colon contrast with our expectations, because SSA/Ps tend to arise from the proximal colon30, 33, 34. It is possible that smoking is involved in initiation of SPs and other factors that occur primarily in the proximal colon, such as certain bacteria (e.g., Fusobacterium nucleatum)35 and dysregulation of the antitumor immune response,36 may stimulate the progression of SPs to SSA/Ps in that region, whereas SPs arising in the distal colon or rectum tend not to progress. Furthermore, the overwhelming number of HPs over SSA/Ps among the proximal SPs might have diluted any strong association between smoking and SSA/Ps. Indeed, in line with our findings, other studies did not observe a consistent association between smoking and proximal SPs.37 The underlying mechanisms for the strong association between smoking and increased risk of serrated tumors remain unclear. Smoking may promote aberrant DNA promoter methylation that leads to MSI-high, CIMP-positive tumors with somatic BRAF mutations arising from the serrated pathway.38, 39
For alcohol intake, findings regarding its relationship with SPs remain mixed.13-16, 40 Some studies16 but not others13-15, 40 found a weak to moderate association between high alcohol intake and increased risk of hyperplastic polyps. Similar inconsistency has also been reported for SSA/Ps.13, 41 A recent meta-analysis reported a statistically significant 33% increased risk of SPs comparing the highest to the lowest alcohol drinkers.41 We noted a stronger association between high alcohol intake and increased risk of SPs, compared with conventional adenomas. Given the potential role of alcohol in DNA hypermethylation42, development of SPs may represent an intermediate step in alcohol-induced colorectal carcinogenesis.
BMI has been positively associated with risk of colorectal adenomas in many43, 44, but not all16, studies. In the current study, we observed a strong association between high BMI and increased risk of both conventional adenomas and SPs. Interestingly, in contrast to most previous studies13, 16, 45, we found that the association was stronger for SPs than conventional adenomas. However, prior studies have several limitations, including insufficient control for confounding45, retrospective case-control13 or cross-sectional16 study design with potential recall bias16 and selection bias13. Obesity is known to be associated with increased levels of bioavailable insulin-like growth factor 1 (IGF-1), which is implicated in colorectal adenoma formation.46, 47 Moreover, obesity may promote colorectal carcinogenesis through chronic subclinical inflammatory conditions.48 Notably, inflammatory conditions seemed to be of greater importance in neoplastic progression for SPs than for conventional adenomas.49 In addition, growing data have implicated the gut microbiota in colorectal carcinogenesis.50 Fusobacterium nucleatum has been most consistently associated with increased risk of colorectal neoplasia. Interestingly, Fusobacterium nucleatum has been shown to be more abundant in obese people51 and also to be more strongly associated with the serrated pathway than with the conventional pathway,35, 52 suggesting that obesity may alter regional inflammatory status and abundance of specific microbes to promote the development of SPs.
Regular use of aspirin has been linked to a 4–27% reduction in the risk of adenoma recurrence in several randomized clinical trials.53-55 In a pooled analysis of three chemoprevention trials, aspirin use was associated with a 40% reduced risk for SPs in the right colon.40 We found a modest association between regular use of aspirin with lower risk of large SPs and advanced conventional adenomas, supporting a chemo-preventive benefit for colorectal carcinogenesis. Aspirin may exert its anticancer effects through several interconnected mechanisms, including reduction of synthesis and catabolism of pro-inflammatory prostaglandin; inhibition of WNT/β-catenin signal; inactivation of platelets; and modulation of the host immune response.56
Diet plays an important role in the development of colorectal neoplasia.12 In this study, we found that dietary factors were generally more strongly associated with conventional adenomas than SPs, and the associations appeared to be much stronger for advanced than non-advanced conventional adenomas. Given that most CRCs that develop through the conventional pathway originate from advanced conventional adenomas and that non-advanced conventional adenomas have very limited malignant potential, our findings support the etiologic relevance of diet in CRC. For example, although total fiber intake was not associated with overall conventional adenomas or SPs, it was associated with lower risk advanced conventional adenomas, in line with the meta-analysis findings that fiber was associated with a lower risk of CRC.57 Similarly, we confirmed previous findings that intake of total calcium, vitamin D, and folate was inversely associated with risk of conventional adenomas58-60. In contrast, we did not find any association between calcium and folate intake and risk of SPs. This is consistent with previous studies that reported a null or weak association between these nutrients and SSA/Ps,13 but contradict the recent meta-analysis that found a beneficial association of high calcium and folate intake with risk of SPs.41 However, the latter finding needs to be interpreted cautiously because of potential selection bias in the included studies13, 40 and substantial between-study heterogeneity. In vitro and experimental studies suggest that calcium and vitamin D may protect against KRAS mutation and aberrant WNT/β-catenin pathway, both of which are critical in the initiation of conventional adenomas.61-63 Nonetheless, WNT/β-catenin pathway has also been implicated in progression, rather than initiation, of SPs.64, 65 Limited evidence indicates that folate may decrease risk of KRAS-mutated CRC in men.66 Taken together, these data suggest that dietary factors may have a particularly important influence on the conventional pathway underlying colorectal carcinogenesis.
Our study has some strengths, including the prospective design, large sample size, long-term follow-up, comprehensive profiling of CRC risk factors, and detailed and repeated data collection, as well as confirmation of polyp diagnosis with detailed recording of histopathologic information based on pathology reports. Moreover, diagnostic documentation for both SPs and conventional adenomas allows us to compare their risk factor profiles, thus providing critical insight into the etiologic heterogeneity of CRC. Several limitations of our study need to be noted as well. First, because of the evolving nature and lack of consensus regarding the diagnostic criteria of specific subtypes of SPs, we were unable to distinguish HPs from SSA/Ps and TSAs. As mentioned above, the classification of polyps in this current study was based on a review of pathology records without central pathological review by an expert pathologist, which may have contributed to misdiagnosis or misclassification of some lesions. However, polyp size has been established as a strong predictor for the likelihood of a polyp progressing into advanced neoplasia. Through detailed stratified analysis by size, we noted that the associations of lifestyle factors tend to be more strongly associated with large SPs, supporting the etiologic relevance of these factors to carcinogenesis. Second, lifestyle and dietary factors assessed by FFQ are subject to measurement error. However, given the prospective design, any error in exposure assessment would have likely attenuated the observed association. Third, as our cohort participants are largely Caucasians, we were unable to compare the risk factors for SPs according to race, which needs to be investigated in further studies. Fourth, given the observational design, residual confounding cannot be ruled out. However, all the reported estimates were derived from multivariable models that adjusted for the risk factors simultaneously and the relative homogeneity of health professionals helps minimize the likelihood of uncontrolled confounding. Finally, multiple comparisons were performed in our analyses, and therefore our results should be interpreted with caution.
In summary, we found smoking, BMI, and alcohol intake were positively associated with both SPs and conventional adenomas, more strongly for SPs than for conventional adenomas, whereas physical activity and some dietary factors, such as folate and calcium, were more inversely associated with conventional adenomas, particularly advanced conventional adenomas, than SPs. Vitamin D and marine omega-3 fatty acid intake was associated with lower risk of SPs and conventional adenomas, with no difference between the two lesions. The observed associations tended to be stronger for synchronous SPs and conventional adenomas. These data support the etiologic heterogeneity of SPs and conventional adenomas, and highlight that some potential lifestyle modifications (smoking cessation, maintenance of a healthy body weight, and moderation of alcohol consumption) may be more important to emphasize as complements to endoscopic screening to reduce the incidence of “interval cancers”. Further studies are needed to confirm our findings and elucidate underlying mechanisms.
Supplementary Material
Acknowledgments
We would like to thank the participants and staff of the Nurses’ Health Study, the Nurses’ Health Study 2 and the Health Professionals Follow-up Study for their valuable contributions as well as the following state cancer registries for their help: AL, AZ, AR, CA, CO, CT, DE, FL, GA, ID, IL, IN, IA, KY, LA, ME, MD, MA, MI, NE, NH, NJ, NY, NC, ND, OH, OK, OR, PA, RI, SC, TN, TX, VA, WA, WY. The authors assume full responsibility for analyses and interpretation of these data.
Funding: This work was supported by the American Cancer Society Mentored Research Scholar Grant (MRSG-17-220-01 - NEC to M.S.); by the U.S. National Institutes of Health (NIH) grants [P01 CA87969 to M.J. Stampfer; UM1 CA186107 to M.J. Stampfer; P01 CA55075, to W.C. Willett; UM1 CA167552 to W.C. Willett; P50 CA127003 to C.S. Fuchs; K24 DK098311, R01 CA137178, R01 CA202704, R01 CA176726, to A.T.C.; R01 CA151993, R35 CA197735 to S.O.; K99 CA215314 to M.S.]; and by grants from the American Institute for Cancer Research (K.W.), the Project P Fund for Colorectal Cancer Research, The Friends of the Dana-Farber Cancer Institute, Bennett Family Fund, and the Entertainment Industry Foundation through National Colorectal Cancer Research Alliance. Dr. Chan is a Stuart and Suzanne Steele MGH Research Scholar. The funders had no role in design and conduct of the study; collection, management, analysis, and interpretation of the data; and preparation, review, or approval of the manuscript.
Abbreviations
- BMI
body mass index
- CI
confidence interval
- CIMP
CpG island methylation phenotype
- CRC
colorectal cancer
- FFQ
food frequency questionnaire
- HP
hyperplastic polyp
- HPFS
the Health Professionals Follow-up Study
- IGF-1
insulin-like growth factor 1
- MET
metabolic equivalent of task
- MSI
microsatellite instability
- NHS
the Nurses’ Health Study
- NHS2
the Nurses’ Health Study 2
- OR
odds ratio
- SSA/P
sessile serrated adenomas/polyp
- SP
serrated polyp
- TSA
traditional serrated adenoma
Footnotes
Publisher's Disclaimer: This is a PDF file of an unedited manuscript that has been accepted for publication. As a service to our customers we are providing this early version of the manuscript. The manuscript will undergo copyediting, typesetting, and review of the resulting proof before it is published in its final citable form. Please note that during the production process errors may be discovered which could affect the content, and all legal disclaimers that apply to the journal pertain.
Conflicts of interest: Andrew T. Chan previously served as a consultant for Bayer Healthcare and Pfizer Inc. for work unrelated to the topic of this manuscript. This study was not funded by Bayer Healthcare or Pfizer Inc. No other conflict of interest exists.
Author contributions: Drs. Chan and Song have full access to all of the data in the study, and take responsibility for the integrity of the data and the accuracy of the data analysis.
Study concept and design: A.T.C, M.S.
Acquisition of data: X.H., K.W., A.T.C, M.S.
Analysis and interpretation of data: X.H., E.L.G., A.T.C., M.S.
Drafting of the manuscript: X.H., M.S.
Critical revision of the manuscript for important intellectual content: K.W., S.O., E.L.G., A.T.C., M.S.
Statistical analysis: X.H., M.S.
Obtained funding: S.O., E.L.G., A.T.C., M.S.
Administrative, technical, or material support: K.W., E.L.G., A.T.C, M.S.
Study supervision: A.T.C., M.S.
Author names in bold designate shared co-first authorship.
References
- 1.Fearon ER, Vogelstein B. A genetic model for colorectal tumorigenesis. Cell. 1990;61:759–67. doi: 10.1016/0092-8674(90)90186-i. [DOI] [PubMed] [Google Scholar]
- 2.Hawkins N, Norrie M, Cheong K, et al. CpG island methylation in sporadic colorectal cancers and its relationship to microsatellite instability. Gastroenterology. 2002;122:1376–87. doi: 10.1053/gast.2002.32997. [DOI] [PubMed] [Google Scholar]
- 3.Spring KJ, Zhao ZZ, Karamatic R, et al. High prevalence of sessile serrated adenomas with BRAF mutations: a prospective study of patients undergoing colonoscopy. Gastroenterology. 2006;131:1400–7. doi: 10.1053/j.gastro.2006.08.038. [DOI] [PubMed] [Google Scholar]
- 4.Bettington M, Walker N, Rosty C, et al. Critical appraisal of the diagnosis of the sessile serrated adenoma. Am J Surg Pathol. 2014;38:158–66. doi: 10.1097/PAS.0000000000000103. [DOI] [PubMed] [Google Scholar]
- 5.Snover DC, Ahnen DJ, Burt RW, et al. Serrated polyps of the colon and rectum and serrated polyposis. In: Bosman FT, Carneiro F, Hruban RH, et al., editors. WHO Classification of Tumours of the Digestive System. 4th. Lyon: IARC Press; 2010. [Google Scholar]
- 6.Leggett B, Whitehall V. Role of the serrated pathway in colorectal cancer pathogenesis. Gastroenterology. 2010;138:2088–100. doi: 10.1053/j.gastro.2009.12.066. [DOI] [PubMed] [Google Scholar]
- 7.Holme O, Bretthauer M, Eide TJ, et al. Long-term risk of colorectal cancer in individuals with serrated polyps. Gut. 2015;64:929–36. doi: 10.1136/gutjnl-2014-307793. [DOI] [PubMed] [Google Scholar]
- 8.JE IJ, Vermeulen L, Meijer GA, et al. Serrated neoplasia-role in colorectal carcinogenesis and clinical implications. Nat Rev Gastroenterol Hepatol. 2015;12:401–9. doi: 10.1038/nrgastro.2015.73. [DOI] [PubMed] [Google Scholar]
- 9.Colotta F, Allavena P, Sica A, et al. Cancer-related inflammation, the seventh hallmark of cancer: links to genetic instability. Carcinogenesis. 2009;30:1073–81. doi: 10.1093/carcin/bgp127. [DOI] [PubMed] [Google Scholar]
- 10.Johnson CM, Wei C, Ensor JE, et al. Meta-analyses of colorectal cancer risk factors. Cancer Causes Control. 2013;24:1207–22. doi: 10.1007/s10552-013-0201-5. [DOI] [PMC free article] [PubMed] [Google Scholar]
- 11.Chan AT, Giovannucci EL. Primary prevention of colorectal cancer. Gastroenterology. 2010;138:2029–2043 e10. doi: 10.1053/j.gastro.2010.01.057. [DOI] [PMC free article] [PubMed] [Google Scholar]
- 12.Song M, Garrett WS, Chan AT. Nutrients, foods, and colorectal cancer prevention. Gastroenterology. 2015;148:1244–60 e16. doi: 10.1053/j.gastro.2014.12.035. [DOI] [PMC free article] [PubMed] [Google Scholar]
- 13.Davenport JR, Su T, Zhao Z, et al. Modifiable lifestyle factors associated with risk of sessile serrated polyps, conventional adenomas and hyperplastic polyps. Gut. 2018;67:456–465. doi: 10.1136/gutjnl-2016-312893. [DOI] [PMC free article] [PubMed] [Google Scholar]
- 14.Shrubsole MJ, Wu H, Ness RM, et al. Alcohol drinking, cigarette smoking, and risk of colorectal adenomatous and hyperplastic polyps. Am J Epidemiol. 2008;167:1050–8. doi: 10.1093/aje/kwm400. [DOI] [PubMed] [Google Scholar]
- 15.Burnett-Hartman AN, Passarelli MN, Adams SV, et al. Differences in epidemiologic risk factors for colorectal adenomas and serrated polyps by lesion severity and anatomical site. Am J Epidemiol. 2013;177:625–37. doi: 10.1093/aje/kws282. [DOI] [PMC free article] [PubMed] [Google Scholar]
- 16.Lieberman DA, Prindiville S, Weiss DG, et al. Risk factors for advanced colonic neoplasia and hyperplastic polyps in asymptomatic individuals. JAMA. 2003;290:2959–67. doi: 10.1001/jama.290.22.2959. [DOI] [PubMed] [Google Scholar]
- 17.Giovannucci E, Ascherio A, Rimm EB, et al. Physical activity, obesity, and risk for colon cancer and adenoma in men. Ann Intern Med. 1995;122:327–34. doi: 10.7326/0003-4819-122-5-199503010-00002. [DOI] [PubMed] [Google Scholar]
- 18.Grodstein F, Martinez ME, Platz EA, et al. Postmenopausal hormone use and risk for colorectal cancer and adenoma. Ann Intern Med. 1998;128:705–12. doi: 10.7326/0003-4819-128-9-199805010-00001. [DOI] [PubMed] [Google Scholar]
- 19.Nimptsch K, Malik VS, Fung TT, et al. Dietary patterns during high school and risk of colorectal adenoma in a cohort of middle-aged women. Int J Cancer. 2014;134:2458–67. doi: 10.1002/ijc.28578. [DOI] [PMC free article] [PubMed] [Google Scholar]
- 20.Ainsworth BE, Haskell WL, Leon AS, et al. Compendium of physical activities: classification of energy costs of human physical activities. Med Sci Sports Exerc. 1993;25:71–80. doi: 10.1249/00005768-199301000-00011. [DOI] [PubMed] [Google Scholar]
- 21.Chan AT, Giovannucci EL, Schernhammer ES, et al. A prospective study of aspirin use and the risk for colorectal adenoma. Ann Intern Med. 2004;140:157–66. doi: 10.7326/0003-4819-140-3-200402030-00006. [DOI] [PubMed] [Google Scholar]
- 22.Chan AT, Giovannucci EL, Meyerhardt JA, et al. Long-term use of aspirin and nonsteroidal anti-inflammatory drugs and risk of colorectal cancer. JAMA. 2005;294:914–23. doi: 10.1001/jama.294.8.914. [DOI] [PMC free article] [PubMed] [Google Scholar]
- 23.Chan AT, Ogino S, Fuchs CS. Aspirin and the risk of colorectal cancer in relation to the expression of COX-2. N Engl J Med. 2007;356:2131–42. doi: 10.1056/NEJMoa067208. [DOI] [PubMed] [Google Scholar]
- 24.Yuan C, Spiegelman D, Rimm EB, et al. Validity of a Dietary Questionnaire Assessed by Comparison With Multiple Weighed Dietary Records or 24-Hour Recalls. Am J Epidemiol. 2017;185:570–584. doi: 10.1093/aje/kww104. [DOI] [PMC free article] [PubMed] [Google Scholar]
- 25.Yuan C, Spiegelman D, Rimm EB, et al. Relative Validity of Nutrient Intakes Assessed by Questionnaire, 24-Hour Recalls, and Diet Records Compared With Urinary Recovery and Plasma Concentration Biomarkers: Findings for Women. Am J Epidemiol. 2017 doi: 10.1093/aje/kwx328. [DOI] [PMC free article] [PubMed] [Google Scholar]
- 26.World Cancer Research Fund/American Institute for Cancer Research. Continuous Update Project Report Food, Nutrition, Physical Activity, and the Prevention of Colorectal Cancer. 2017 Available at http://www.wcrf.org/sites/default/files/CUPColorectal_Report_2017_Digital.pdf.
- 27.Arem H, Moore SC, Patel A, et al. Leisure time physical activity and mortality: a detailed pooled analysis of the dose-response relationship. JAMA Intern Med. 2015;175:959–67. doi: 10.1001/jamainternmed.2015.0533. [DOI] [PMC free article] [PubMed] [Google Scholar]
- 28.Ekelund U, Steene-Johannessen J, Brown WJ, et al. Does physical activity attenuate, or even eliminate, the detrimental association of sitting time with mortality? A harmonised meta-analysis of data from more than 1 million men and women. Lancet. 2016;388:1302–10. doi: 10.1016/S0140-6736(16)30370-1. [DOI] [PubMed] [Google Scholar]
- 29.U.S. Department of Agriculture and U.S. Department of Health and Human Services. Dietary Guidelines for Americans 2010. 7th. Washington, DC: US Government Printing Office; 2010. [DOI] [PMC free article] [PubMed] [Google Scholar]
- 30.Lieberman DA, Rex DK, Winawer SJ, et al. Guidelines for colonoscopy surveillance after screening and polypectomy: a consensus update by the US Multi-Society Task Force on Colorectal Cancer. Gastroenterology. 2012;143:844–857. doi: 10.1053/j.gastro.2012.06.001. [DOI] [PubMed] [Google Scholar]
- 31.Song M, Mehta RS, Wu K, et al. Plasma Inflammatory Markers and Risk of Advanced Colorectal Adenoma in Women. Cancer Prev Res (Phila) 2016;9:27–34. doi: 10.1158/1940-6207.CAPR-15-0307. [DOI] [PMC free article] [PubMed] [Google Scholar]
- 32.Erichsen R, Baron JA, Hamilton-Dutoit SJ, et al. Increased Risk of Colorectal Cancer Development Among Patients With Serrated Polyps. Gastroenterology. 2016;150:895–902 e5. doi: 10.1053/j.gastro.2015.11.046. [DOI] [PubMed] [Google Scholar]
- 33.Goldstein NS. Small colonic microsatellite unstable adenocarcinomas and high-grade epithelial dysplasias in sessile serrated adenoma polypectomy specimens: a study of eight cases. Am J Clin Pathol. 2006;125:132–45. [PubMed] [Google Scholar]
- 34.Anderson JC, Lisovsky M, Greene MA, et al. Factors Associated With Classification of Hyperplastic Polyps as Sessile Serrated Adenomas/Polyps on Morphologic Review. J Clin Gastroenterol. 2017 doi: 10.1097/MCG.0000000000000840. [DOI] [PubMed] [Google Scholar]
- 35.Yu J, Chen Y, Fu X, et al. Invasive Fusobacterium nucleatum may play a role in the carcinogenesis of proximal colon cancer through the serrated neoplasia pathway. Int J Cancer. 2016;139:1318–26. doi: 10.1002/ijc.30168. [DOI] [PubMed] [Google Scholar]
- 36.Llosa NJ, Cruise M, Tam A, et al. The vigorous immune microenvironment of microsatellite instable colon cancer is balanced by multiple counter-inhibitory checkpoints. Cancer Discov. 2015;5:43–51. doi: 10.1158/2159-8290.CD-14-0863. [DOI] [PMC free article] [PubMed] [Google Scholar]
- 37.Onega T, Goodrich M, Dietrich A, et al. The influence of smoking, gender, and family history on colorectal adenomas. J Cancer Epidemiol. 2010;2010:509347. doi: 10.1155/2010/509347. [DOI] [PMC free article] [PubMed] [Google Scholar]
- 38.Samowitz WS, Albertsen H, Sweeney C, et al. Association of smoking, CpG island methylator phenotype, and V600E BRAF mutations in colon cancer. J Natl Cancer Inst. 2006;98:1731–8. doi: 10.1093/jnci/djj468. [DOI] [PubMed] [Google Scholar]
- 39.Drew DA, Nishihara R, Lochhead P, et al. A Prospective Study of Smoking and Risk of Synchronous Colorectal Cancers. Am J Gastroenterol. 2017;112:493–501. doi: 10.1038/ajg.2016.589. [DOI] [PMC free article] [PubMed] [Google Scholar]
- 40.Wallace K, Grau MV, Ahnen D, et al. The association of lifestyle and dietary factors with the risk for serrated polyps of the colorectum. Cancer Epidemiol Biomarkers Prev. 2009;18:2310–7. doi: 10.1158/1055-9965.EPI-09-0211. [DOI] [PMC free article] [PubMed] [Google Scholar]
- 41.Bailie L, Loughrey MB, Coleman HG. Lifestyle Risk Factors for Serrated Colorectal Polyps: A Systematic Review and Meta-analysis. Gastroenterology. 2017;152:92–104. doi: 10.1053/j.gastro.2016.09.003. [DOI] [PubMed] [Google Scholar]
- 42.Varela-Rey M, Woodhoo A, Martinez-Chantar ML, et al. Alcohol, DNA methylation, and cancer. Alcohol Res. 2013;35:25–35. doi: 10.35946/arcr.v35.1.04. [DOI] [PMC free article] [PubMed] [Google Scholar]
- 43.Giovannucci E, Colditz GA, Stampfer MJ, et al. Physical activity, obesity, and risk of colorectal adenoma in women (United States) Cancer Causes Control. 1996;7:253–63. doi: 10.1007/BF00051301. [DOI] [PubMed] [Google Scholar]
- 44.Kitahara CM, Berndt SI, de Gonzalez AB, et al. Prospective investigation of body mass index, colorectal adenoma, and colorectal cancer in the prostate, lung, colorectal, and ovarian cancer screening trial. J Clin Oncol. 2013;31:2450–9. doi: 10.1200/JCO.2012.48.4691. [DOI] [PMC free article] [PubMed] [Google Scholar]
- 45.Omata F, Brown WR, Tokuda Y, et al. Modifiable risk factors for colorectal neoplasms and hyperplastic polyps. Intern Med. 2009;48:123–8. doi: 10.2169/internalmedicine.48.1562. [DOI] [PubMed] [Google Scholar]
- 46.Schoen RE, Weissfeld JL, Kuller LH, et al. Insulin-like growth factor-I and insulin are associated with the presence and advancement of adenomatous polyps. Gastroenterology. 2005;129:464–75. doi: 10.1016/j.gastro.2005.05.051. [DOI] [PubMed] [Google Scholar]
- 47.Simons CC, van den Brandt PA, Stehouwer CD, et al. Body size, physical activity, early-life energy restriction, and associations with methylated insulin-like growth factor-binding protein genes in colorectal cancer. Cancer Epidemiol Biomarkers Prev. 2014;23:1852–62. doi: 10.1158/1055-9965.EPI-13-1285. [DOI] [PubMed] [Google Scholar]
- 48.John BJ, Abulafi AM, Poullis A, et al. Chronic subclinical bowel inflammation may explain increased risk of colorectal cancer in obese people. Gut. 2007;56:1034–5. doi: 10.1136/gut.2007.125955. [DOI] [PMC free article] [PubMed] [Google Scholar]
- 49.Szylberg L, Janiczek M, Popiel A, et al. Expression of COX-2, IL-1beta, TNF-alpha and IL-4 in epithelium of serrated adenoma, adenoma and hyperplastic polyp. Arch Med Sci. 2016;12:172–8. doi: 10.5114/aoms.2016.57594. [DOI] [PMC free article] [PubMed] [Google Scholar]
- 50.Chen J, Pitmon E, Wang K. Microbiome, inflammation and colorectal cancer. Semin Immunol. 2017;32:43–53. doi: 10.1016/j.smim.2017.09.006. [DOI] [PubMed] [Google Scholar]
- 51.Maciel SS, Feres M, Goncalves TE, et al. Does obesity influence the subgingival microbiota composition in periodontal health and disease? J Clin Periodontol. 2016;43:1003–1012. doi: 10.1111/jcpe.12634. [DOI] [PubMed] [Google Scholar]
- 52.Ito M, Kanno S, Nosho K, et al. Association of Fusobacterium nucleatum with clinical and molecular features in colorectal serrated pathway. Int J Cancer. 2015;137:1258–68. doi: 10.1002/ijc.29488. [DOI] [PubMed] [Google Scholar]
- 53.Baron JA, Cole BF, Sandler RS, et al. A randomized trial of aspirin to prevent colorectal adenomas. N Engl J Med. 2003;348:891–9. doi: 10.1056/NEJMoa021735. [DOI] [PubMed] [Google Scholar]
- 54.Benamouzig R, Deyra J, Martin A, et al. Daily soluble aspirin and prevention of colorectal adenoma recurrence: one-year results of the APACC trial. Gastroenterology. 2003;125:328–36. doi: 10.1016/s0016-5085(03)00887-4. [DOI] [PubMed] [Google Scholar]
- 55.Logan RF, Grainge MJ, Shepherd VC, et al. Aspirin and folic acid for the prevention of recurrent colorectal adenomas. Gastroenterology. 2008;134:29–38. doi: 10.1053/j.gastro.2007.10.014. [DOI] [PubMed] [Google Scholar]
- 56.Drew DA, Cao Y, Chan AT. Aspirin and colorectal cancer: the promise of precision chemoprevention. Nat Rev Cancer. 2016;16:173–86. doi: 10.1038/nrc.2016.4. [DOI] [PMC free article] [PubMed] [Google Scholar]
- 57.Aune D, Chan DS, Lau R, et al. Dietary fibre, whole grains, and risk of colorectal cancer: systematic review and dose-response meta-analysis of prospective studies. BMJ. 2011;343:d6617. doi: 10.1136/bmj.d6617. [DOI] [PMC free article] [PubMed] [Google Scholar]
- 58.Wei MY, Garland CF, Gorham ED, et al. Vitamin D and prevention of colorectal adenoma: a meta-analysis. Cancer Epidemiol Biomarkers Prev. 2008;17:2958–69. doi: 10.1158/1055-9965.EPI-08-0402. [DOI] [PubMed] [Google Scholar]
- 59.Weingarten MA, Zalmanovici A, Yaphe J. Dietary calcium supplementation for preventing colorectal cancer and adenomatous polyps. Cochrane Database Syst Rev. 2008:CD003548. doi: 10.1002/14651858.CD003548.pub4. [DOI] [PMC free article] [PubMed] [Google Scholar]
- 60.Park YM, Youn J, Cho CH, et al. Circulating folate levels and colorectal adenoma: a case-control study and a meta-analysis. Nutr Res Pract. 2017;11:419–429. doi: 10.4162/nrp.2017.11.5.419. [DOI] [PMC free article] [PubMed] [Google Scholar]
- 61.Ahearn TU, Shaukat A, Flanders WD, et al. A randomized clinical trial of the effects of supplemental calcium and vitamin D3 on the APC/beta-catenin pathway in the normal mucosa of colorectal adenoma patients. Cancer Prev Res (Phila) 2012;5:1247–56. doi: 10.1158/1940-6207.CAPR-12-0292. [DOI] [PMC free article] [PubMed] [Google Scholar]
- 62.Pendas-Franco N, Garcia JM, Pena C, et al. DICKKOPF-4 is induced by TCF/beta-catenin and upregulated in human colon cancer, promotes tumour cell invasion and angiogenesis and is repressed by 1alpha,25-dihydroxyvitamin D3. Oncogene. 2008;27:4467–77. doi: 10.1038/onc.2008.88. [DOI] [PubMed] [Google Scholar]
- 63.Llor X, Jacoby RF, Teng BB, et al. K-ras mutations in 1,2-dimethylhydrazine-induced colonic tumors: effects of supplemental dietary calcium and vitamin D deficiency. Cancer Res. 1991;51:4305–9. [PubMed] [Google Scholar]
- 64.Wu JM, Montgomery EA, Iacobuzio-Donahue CA. Frequent beta-catenin nuclear labeling in sessile serrated polyps of the colorectum with neoplastic potential. Am J Clin Pathol. 2008;129:416–23. doi: 10.1309/603UQKM7C2KELGJU. [DOI] [PubMed] [Google Scholar]
- 65.Yachida S, Mudali S, Martin SA, et al. Beta-catenin nuclear labeling is a common feature of sessile serrated adenomas and correlates with early neoplastic progression after BRAF activation. Am J Surg Pathol. 2009;33:1823–32. doi: 10.1097/PAS.0b013e3181b6da19. [DOI] [PMC free article] [PubMed] [Google Scholar]
- 66.Brink M, Weijenberg MP, de Goeij AF, et al. Dietary folate intake and k-ras mutations in sporadic colon and rectal cancer in The Netherlands Cohort Study. Int J Cancer. 2005;114:824–30. doi: 10.1002/ijc.20775. [DOI] [PubMed] [Google Scholar]
Associated Data
This section collects any data citations, data availability statements, or supplementary materials included in this article.