

Abstract
Acute stroke commonly affects cardiac autonomic responses resulting in reduced heart rate variability (HRV). Multiscale entropy (MSE) is a novel non-linear method to quantify the complexity of HRV. This study investigated the influence of intracerebral hemorrhage (ICH) locations and intraventricular hemorrhage (IVH) on the complexity of HRV. We recruited 93 supratentorial ICH patients (male 59%, mean age 61 years), and the locations of ICH included basal ganglia (n = 40), thalamus (n = 35), and lobar (n = 18) group. Continuous one-hour electrocardiography signals were obtained from patients after admission, and the complexity index was defined as the area under the MSE curve. The complexity index was lower in lobar ICH (21.6 ± 7.9) than basal ganglia (27.9 ± 6.4) and thalamus (28.5 ± 7.2) groups. The complexity index was inversely correlated with initial stroke severity (r = −0.26), size of hematoma (r = −0.35) and ICH score (r = −0.26), especially among patients with intraventricular hemorrhage (r = −0.60, −0.60, and −0.41 respectively). A higher complexity can predict a good functional outcome (adjusted odds ratio 1.09, 95% confidence intervals 1.00–1.19) at post-stroke 3 months. In summary, more severe stroke and larger hematoma volume resulted in lower complexity of HRV. Lobar hemorrhage and IVH had great impacts on the cardiac autonomic function.
Introduction
The link between the brain and the heart is well recognized. For example, acute stroke commonly affects cardiac autonomic responses1. The proposed mechanisms for brain-heart interaction after stroke included activation of the hypothalamic–pituitary–adrenal axis, sympathetic and parasympathetic regulation, catecholamine surge, immune responses and inflammation2. Heart rate variability (HRV), an indicator of the heart’s ability to adjust instantaneously according to circulatory changes, can serve as an important parameter for the assessment of autonomic functions3. Studies have shown that a reduced HRV is commonly seen in patients after acute stroke, and can predict post-stroke mortality or poor outcome4–7. Since the central control of autonomic nervous system resides not only at the spinal cord or brainstem level, also among the widespread cortical and subcortical network including bilateral insular cortex, cingulate gyrus, amygdala and hypothalamus, whether the locations of acute stroke would have impact on the HRV is worth to be investigated5,8. Many studies explored the associations between infarct locations and the change of HRV or cardiac arrhythmia4,5,9–12, while less is known about the locations of intracerebral hemorrhage (ICH) and corresponding autonomic change13–15.
Conventional linear HRV analyses, such as frequency and time domain analyses, are usually applied on the studies of stroke related autonomic dysfunction4,6,10. Given that the modulation of HRV is thought to be originated from non-linear processes with non-stationary nature, properly use of the analyses based on chaos theory may be more reliable to describe the complex human biological signals16–19. Recently, multiscale entropy (MSE) has been developed as a non-linear method to quantify HRV18,19, and we have shown that early assessment of HRV by MSE can predict outcomes and potential stroke-in-evolution in patients with acute ischemic stroke20,21. Here, we hypothesized that different locations of the supratentorial ICH and the presence of intraventricular hemorrhage (IVH) could have contrasting impacts on the HRV. Both linear and non-linear methods would be applied to quantify the change of HRV.
Methods
Standard protocol approvals, registrations, and patient consents
The present study was approved by the Institutional Review Board of National Taiwan University Hospital to prospectively collect information on acute stroke patients, including stroke severity, risk factors, stroke mechanism, and outcome. All participants gave their written informed consent by themselves or from the next of kin of patients with impaired consciousness, and the methods were carried out in accordance with the approved guidelines.
Study design, Setting, and Patients
Patients with acute non-traumatic supratentorial ICH who had been admitted within 24 hours to the stroke intensive care unit were recruited prospectively. Age- and sex-matched control participants free of acute cardiovascular or cerebrovascular events within 12 months were recruited from health check-up in cardiovascular outpatient clinic. Among patients with supratentorial ICH, their demographic data (age and gender), medical history, use of antiplatelet or anticoagulant agents, vascular risk factors, including hypertension, diabetes mellitus, dyslipidemia, atrial fibrillation, prior stroke, and history of smoking were recorded. Vital signs including blood pressure, heart rate, ECG, respiratory rate, and oxygen saturation were documented. The initial stroke severity was assessed by the National Institute of Health Stroke Scale (NIHSS) upon admission to the stroke ICU. Patients with modified Rankin scale (mRS) >2 prior to the index event, symptomatic heart failure, inability to obtain ECG signals within 48 hours of admission, or poor quality or artifacts of ECG signals were not included for analysis. We also excluded patients with atrial fibrillation since our previous study showed that the non-linear MSE analysis had poor predictive ability among this patient group21.
The diagnosis of ICH was confirmed by computed tomography (CT) of the head. The primary locations of ICH were classified into basal ganglia, thalamic, or lobar areas. The presence of intraventricular hemorrhage (IVH) was also documented. The volume of ICH was calculated based on the first CT scan using the (a × b × c)/2 method, where a and b represented the largest perpendicular diameters of the ICH zone, and c was the number of CT slices with hemorrhage multiplied by the slice thickness22. The severity of ICH was graded according to the well-known ICH score, ranged from 0 to 6 with higher score indicating higher 30-day mortality23. Since we only included the supratentorial ICH, the maximum of the ICH score of our patients was 5. A good function outcome was defined as mRS ≤2 at 3 months after stroke.
ECG Data Acquisition and Analysis
Details of the method used for ECG data recording and analysis have been previously published8. Briefly, we collected ECG analogue data directly from the bedside monitor (Philips Intellivue MP70, Koninklijke Philips N.V., Amsterdam, Netherlands) for each patient. We collected the ECG data as soon as possible upon patient’s admission to the stroke care unit. To prevent the possible bias of data selection, only the first hour of the data was taken for analysis in all study subjects. One-hour ECG data were digitized with a sampling rate of 512 Hz and stored in a computer. For control participants, ECG signal was recorded via a Holter monitor (MyECG E3-80, Mircostar Company, Taipei, Taiwan). The stored ECG data then went through a pre-processing step to extract the R-R interval time series before analysis. To analysis the ECG data, we extracted the R-R interval of each patient in one hour first. Generally, there are more than 3600 intervals within 1 hour (about 4000~6000 intervals). We chose the first 3600 data for our analysis as 1 hour data. For 5 min processing, we segmented the 3600 points into 300 times 5 points without overlapping24. In addition, to ensure the stationarity of ECG signals utilized for further linear and nonlinear analyses, we performed the stationarity test by a previously described methods25. The results showed that the percentage of stationary segments is 70.35% (see Supplemental Fig. S1 for the detailed protocol).
The two main linear analyses of HRV included: (1) time-domain analyses including deviation of normal to normal R wave (SDNN) and root-mean-square of successive beat-to-beat differences (RMSSD); (2) frequency-domain HRV analysis including high frequency power (0.15–0.4 Hz), low-frequency power (0.04–0.15 Hz), and the ratio of low-frequency to high-frequency (LF-HF) power.
Non-linear MSE analysis was applied to the acquired 1-hour ECG data and it comprised two steps: (1) coarse-graining the signals into different time scales, (2) sample entropy calculation for each coarse-grained time series to quantify the degree of irregularity12 Then the entropy is calculated as a function of scale to provide a measure of information richness embedded in different time scales. We coarse-grained the original time series up to a scale factor of 20, which is a typical choice in most studies18,21. The parameters for sample entropy calculation were as below: embedding dimension was 2 (2 match over 3 match), tolerance was standard deviation times 0.2, time lag was 1 point, and the frame length was one hour which included at least 4000 R-R intervals. A detrending process was performed to attenuate the influence caused by non-stationary artifacts17. We calculated three different parameters derived from the MSE profile: the summations of quantitative values of scale 1–5 (Area1–5), scale 6–20 (Area6–20), and all scales (Area1–20, named the ‘complexity index’), which represented the short-term, long-term, and overall complexity, respectively26.
Statistical Analysis
Among the three groups of ICH patients (basal ganglia, thalamic, and lobar), their demographic and clinical characteristics, medical history, volume of ICH, ICH scores, functional outcome, as well as the linear and non-linear parameters of HRV were compared using χ2 test, one-way ANOVA or Kruskal-Wallis test with relevant variables as indicated. Analysis of covariance (ANCOVA) was introduced to compare the significant differences of HRV between three groups after adjustment of age and sex. Similar analysis was performed to compare patients with or without IVH. The MSE curves of control and ICH patients were plotted and complexity index values were presented as the mean ± standard deviation.
To evaluate potential correlation between HRV parameters and certain important clinical variables, partial correlation between the value of each HRV parameter and initial NIHSS score, ICH volume and ICH score were tested by Spearman rank-order correlation after adjusted by age and sex. Whenever significant correlation between HRV parameters and above-mentioned clinical variables were found, further exploration by the location of ICH was performed.
We performed multivariable logistic regression models that were adjusted for age, sex, initial NIHSS score, and the presence of IVH to test for an association between good functional outcome and parameters of HRV (values of linear and non-linear parameters were entered as continuous variables). A P value of <0.05 was considered to indicate statistical significance. The SAS version 9.4 (SAS Institute Inc., Cary, NC, USA) was used for all analyses.
Results
Participants and Descriptive Data
There were 331 consecutive acute stroke patients admitted to the stroke intensive care unit received at least 1-hour ECG monitoring and HRV analyses between February 2012 and June 2014. We excluded 193 patients with ischemic stroke, 12 patients with diagnosis of non-stroke, and 5 patients with atrial fibrillation rhythm. Among the rest of 121 patients with ICH, 22 were further excluded because of their infratentorial origin of ICH, and 6 of multiple primary locations of ICH. A total of 93 patients with supratentorial ICH (male, 59.1%; age, 61.1 ± 15.3 years old) were finally included in the analysis, and were classified into basal ganglia (n = 40, 43.0%), thalamus (n = 35, 37.6%), and lobar area group (n = 18, 19.4%). Patients with lobar area ICH were significantly older and had larger ICH volume than those with basal ganglion and thalamic ICH, while patients with thalamic ICH more frequently had IVH (Table 1). The NIHSS score at admission and the ICH score, however, were similar between the three groups. Intraventricular extension of ICH was presented in 28 patients (30.1%), especially in the thalamus group (n = 22 of 35, 62.9%). Patients with IVH had higher initial NIHSS and ICH score, and were less likely to have a good functional outcome (Supplemental Table 1). In addition, 50 age- and sex-matched controls (male, 60%; age, 60.2 ± 10.8 years old) were recruited and received 1-hour ECG monitoring for HRV analyses.
Table 1.
Characteristics of Patients with Supratentorial Intracerebral Hemorrhage by Lesion Locations.
| All | Basal ganglia | Thalamus | Lobar | P valuea | |
|---|---|---|---|---|---|
| Number | 93 | 40 | 35 | 18 | |
| Age, years | 61.1 ± 15.3 | 56.8 ± 16.1 | 60.7 ± 14.0 | 71.2 ± 11.1 | <0.01 |
| Male | 55 (59.1) | 25 (62.5) | 20 (57.1) | 10 (55.6) | 0.84 |
| Hypertension | 85 (91.4) | 37 (92.5) | 33 (94.3) | 15 (83.3) | 0.38 |
| Diabetes mellitus | 24 (25.8) | 10 (25.0) | 12 (34.3) | 2 (11.1) | 0.18 |
| SBP at admission | 176.7 ± 35.6 | 181.7 ± 35.8 | 175.3 ± 33.7 | 168.9 ± 38.7 | 0.43 |
| NIHSS at admission | 13.5 ± 8.1 | 13.5 ± 7.4 | 14.1 ± 9.1 | 12.5 ± 7.8 | 0.96 |
| ICH volume | 13.8 (5.2–33.1) | 15.1 (6.0–30.5) | 8.9 (3.3–19.3) | 29.6 (15.9–51.4) | <0.01 |
| ICH score | 1.1 ± 1.3 | 0.9 ± 1.0 | 1.3 ± 1.2 | 1.2 ± 1.1 | 0.32 |
| Presence of IVH | 28 (30.1) | 3 (7.5) | 22 (62.9) | 3 (16.7) | <0.01 |
| Good functional outcome | 40 (43.0) | 22 (55.0) | 12 (34.3) | 6 (33.3) | 0.13 |
| Parameters of HRV | |||||
| Complexity index (Area1–20) | 26.9 ± 7.4 | 27.9 ± 6.4 | 28.5 ± 7.2 | 21.6 ± 7.9 | 0.01 |
| Scale1–5 (Area1–5) | 5.9 ± 1.7 | 6.2 ± 1.6 | 6.3 ± 1.6 | 4.7 ± 1.8 | 0.01 |
| Scale6–20 (Area6–20) | 21.0 ± 6.0 | 21.8 ± 5.2 | 22.2 ± 5.9 | 16.9 ± 6.4 | 0.01 |
| Sample entropy | 1.14 ± 0.38 | 1.16 ± 0.33 | 1.22 ± 0.33 | 0.96 ± 0.50 | 0.05 |
| SDNN | 60.2 ± 37.2 | 62.0 ± 36.9 | 57.5 ± 40.5 | 61.5 ± 32.4 | 0.61 |
| RMSSD | 49.7 ± 51.3 | 47.1 ± 47.7 | 42.3 ± 55.2 | 69.7 ± 48.8 | 0.04 |
| High frequency | 417.8 ± 514.2 | 425.0 ± 434.0 | 426.8 ± 666.4 | 384.3 ± 330.3 | 0.67 |
| Low frequency | 480.2 ± 1078.7 | 500.9 ± 1099.0 | 435.6 ± 1262.0 | 520.7 ± 577.9 | 0.16 |
| Low frequency to high frequency ratio | 2.00 ± 1.19 | 2.02 ± 1.13 | 2.27 ± 1.22 | 1.44 ± 1.14 | 0.05 |
Data are expressed as mean ± standard deviation or n (%), except ICH volume is median (interquartile range).
HRV, heart rate variability; ICH, intracerebral hemorrhage; IVH, intraventricular hemorrhage; NIHSS, National Institutes of Health Stroke Scale; RMSSD, root-mean-square of successive beat-to-beat differences; SBP, systolic blood pressure; SDNN, standard deviation of normal to normal R wave.
aCompared between basal ganglia, thalamus and lobar group by one-way ANOVA or Kruskal-Wallis test.
Main Results
Figure 1 shows the plotted MSE curves in control and three groups of patients. The overall complexity index was significantly lower in patients with ICH than control group (26.9 ± 7.4 vs 33.6 ± 3.7, P < 0.001), and the curves were conspicuously lower in the lobar group. The linear parameters of HRV were mostly comparable between the three groups except RMSSD (P = 0.04) and LF-HF ratio (P = 0.05, Table 1). On the other hand, the values of complexity index derived from MSE were significantly lower in the lobar (21.6 ± 7.9) than the basal ganglia (27.9 ± 6.4) or thalamus groups (28.5 ± 7.2, overall P = 0.002). The results were consistent for the values of Area1–5 and Area6–20 (overall P = 0.002 and 0.004, respectively), while sample entropy (scale 1) showed borderline difference (P = 0.053) between three groups. After adjusted for age and sex, only the complexity index (Area1–20) remained statistical significance among three groups (P = 0.03), and other parameters did not. There was no significant difference between HRV parameters regarding to the presence of IVH or not (Supplemental Table S1).
Figure 1.
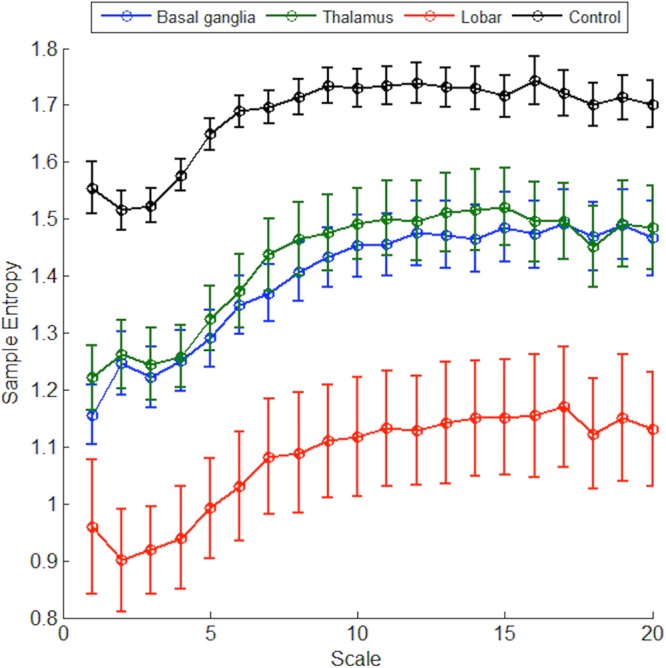
Plotted multiscale entropy (MSE) curves in patients with intracerebral hemorrhage (ICH) and controls The trends of MSE curves were apparently different from those obtained from supratentorial ICH patients (n = 93) and controls (n = 50), and lobar ICH had even lower complexity index than basal ganglia and thalamus ICH.
After adjustment of age and sex, only the complexity index was negatively correlated with the NIHSS score at admission (r = −0.26, P = 0.01), ICH volume (r = −0.35, P = 0.0006) and ICH score (r = −0.26, P = 0.01; Table 2), while no significant correlation existed between the linear parameters of HRV and above clinical variables. In the lobar group, larger ICH volume and higher ICH score were significantly correlated with lower complexity index (r = −0.68, P = 0.004 and r = −0.59, P = 0.02, respectively). The significantly negative correlation between complexity index and NIHSS score at admission was only found in the thalamus group (r = −0.37, P = 0.03).
Table 2.
Correlations Between Linear and Non-linear Parameters of Heart Rate Variability and Clinical Variables.
| Correlation coefficient r ( P value) a | NIHSS score | ICH volume | ICH score |
|---|---|---|---|
| Complexity index | −0.26 (0.01) | −0.35 (0.0006) | −0.26 (0.01) |
| Basal ganglia | −0.26 (0.11) | −0.20 (0.24) | −0.37 (0.02) |
| Thalamus | −0.37 (0.03) | −0.34 (0.05) | −0.27 (0.12) |
| Lobar | −0.29 (0.28) | −0.68 (0.004) | −0.59 (0.02) |
| SDNN | −0.08 (0.43) | −0.09 (0.40) | −0.03 (0.78) |
| RMSSD | −0.13 (0.22) | −0.01 (0.95) | −0.03 (0.78) |
| High frequency | −0.13 (0.22) | −0.04 (0.71) | −0.03 (0.77) |
| Low frequency | −0.19 (0.07) | −0.08 (0.45) | −0.03 (0.73) |
| LF-HF ratio | −0.01 (0.93) | −0.03 (0.77) | −0.02 (0.86) |
ICH, intracerebral hemorrhage; LF-HF, low-frequency to high-frequency; NIHSS, National Institutes of Health Stroke Scale; RMSSD, root-mean-square of successive beat-to-beat differences; SDNN, standard deviation of normal to normal R wave.
aPartial correlation was adjusted for age and sex.
Numbers in bold indicated significant findings.
When stratified by the involvement of IVH or not, the complexity index was strongly correlated with initial NIHSS score (r = −0.60, P = 0.001), ICH volume (r = −0.60, P = 0.001) and ICH score (r = −0.41, P = 0.04) among patients with IVH, while the negative associations were less prominent in those without (r = −0.09, P = 0.48; r = −0.26, P = 0.04; r = −0.26, P = 0.04, respectively; Supplemental Table S2).
In the multivariable logistic regression model after adjustment for age, sex, NIHSS score at admission and the presence of IVH, higher complexity index was a predictor of a good functional outcome (OR = 1.09, 95% confidence intervals = 1.00–1.19, P = 0.039; Table 3). We did not further explore this association in different groups because of their relatively small sample sizes.
Table 3.
Adjusted Linear and Non-linear Parameters of Heart Rate Variability in predicting functional status 3 months after stroke.
| Good outcome | Poor outcome | Adjusted OR (95% CI)a | |
|---|---|---|---|
| Complexity index | 29.8 ± 5.6 | 24.8 ± 8.0 | 1.09 (1.00–1.19) |
| SDNN | 63.9 ± 36.7 | 57.4 ± 37.6 | 1.01 (0.99–1.03) |
| RMSSD | 46.4 ± 48.3 | 52.1 ± 53.8 | 1.00 (0.99–1.02) |
| High frequency | 436.8 ± 1174.5 | 492.5 ± 1011.9 | 1.00 (1.00–1.00) |
| Low frequency | 490.7 ± 644.2 | 362.8 ± 386.5 | 1.00 (1.00–1.00) |
| LF-HF ratio | 2.09 ± 1.15 | 1.94 ± 1.23 | 1.06 (0.66–1.69) |
CI, confidence intervals; LF-HF, low-frequency to high-frequency; OR, odds ratio; RMSSD, root-mean-square of successive beat-to-beat differences; SDNN, standard deviation of normal to normal R wave.
aLogistic regression was adjusted for age, sex, NIHSS score at admission and presence of intraventricular hemorrhage.
Numbers in bold indicated significant findings.
Discussion
This study explored potential effect of the locations and severity of supratentorial ICH on various parameters of HRV. Patients with lobar ICH had the lowest complexity of HRV derived from non-linear method of MSE. The complexity index was negatively correlated with ICH volume and clinical severity (the NIHSS score at admission and ICH score), especially in the lobar ICH or those with intraventricular extension of hemorrhage. Our study clearly demonstrated that the non-linear method of MSE is superior to conventional linear analysis of HRV on reflecting the clinical severity and functional outcome of ICH.
Among linear parameters of HRV, only the time series of RMSSD and frequency domain of LF-HF ratio showed significant change in lobar group. Traditionally, RMSSD indicated vagal modulation of short-term, rapid changes of heart rate variability27, whilst LF-HF ratio implied the balance between sympathetic (LF) and parasympathetic (HF) balance on the cardiac autonomic function4. In the present study, lobar group had a higher crude RMSSD value and lower LF-HF ratio, possibly suggesting a stronger vagal and less sympathetic drive in these patients. However, the significant findings diminished after introducing covariates (age and sex), and these parameters were not associated with clinical severity and outcome either. The authors therefore focused mainly on nonlinear parameters of HRV in this study.
The reasons why patients with lobar ICH had lowest complexity of HRV might be multifactorial. Larger hematoma size and older age per se could result in lower complexity19. In addition, it could be caused by damage to the central control of autonomic nervous system, which was thought to be locating in insular cortex, cingulate gyrus, amygdala and hypothalamus5,8. Of these locations, insular cortex was the most comprehensively studied area, and there were controversies regarding whether left or right side was ‘dominant’ for sympathetic or parasympathetic responses10,12,28–31. These conflict results, however, should be interpreted carefully since the cardiovascular autonomic center might not be exactly located within the insula but also involved extra-insular areas and their interconnecting fibers11, and the findings might also be somehow deviating based on lesioning or stimulating studies32,33. Hence, we simplified this issue and sorted lobar-origin ICH in a group. Given the small sample size within lobar group, we did not further differentiate those involving insular or lateralization. At least the authors observed that more severe destruction of lobar area by larger hematoma size resulted in more depressed of the HRV, which also reflected on the worse clinical outcome.
The common non-lobar, supratentorial locations of ICH involved basal ganglia and thalamus34. We found no significant differences existed between the parameters of HRV, stroke severity and functional outcome among these two groups, which echoed previous studies34. One important difference between these two groups, however, was that more intraventricular extension of bleeding occurred in the thalamus group. In our study, although unfavorable outcome was more prevalent in patients with IVH, the complexity index or other parameters of HRV were not different between those with and without IVH. The lack of further discrimination of locations of IVH possibly contributed to this result. Nonetheless, the negative correlations between the complexity index and clinical indicators were more salient in patients with IVH. One study had demonstrated that hematoma extension to the third and fourth ventricles may cause an impaired baroreflex sensitivity15. Since there is a rich network structure controlling autonomic function surrounding the third and fourth ventricles, including hypothalamic paraventricular nucleus, circumventricular organs in the anterior wall of the third ventricle, periaqueductal gray matter, brain stem and medullar nuclei8, intraventricular extension of hematoma might cause pressure disturbance on these periventricular controlling centers and result in autonomic dysfunction.
The study found that higher complexity index can predict a favorable outcome among patients with ICH, which was consistent with our previous work21. In addition, more severe stroke, assessed by NIHSS and ICH score, also correlated with lower complexity index. One recent study demonstrated that SDNN, deceleration and acceleration capacity of heart rate were negatively correlated with the NIHSS score in patients with acute hemispheric ischemic stroke, though the values of correlation coefficient were rather low35. In our study on the ICH population counterpart, only the non-linear parameters negatively correlated with the severity of stroke, while linear parameters were not. Our results were more solid given that the r values were age- and sex-adjusted, which suggested that stroke severity could unambiguously influence the cardiac autonomic function. We also showed that the larger volume of the ICH, the more depressed of the complexity. Larger ICH usually corresponded to more tissue damage and higher clinical severity, hence more disturbance on the cardiac autonomic function could be expected. These correlations were especially evident in the lobar group and in those with IVH, implying the critical role of autonomic control around the cortical as well as periventricular areas.
This study had several limitations. First, our sample size was relatively small and derived from a single hospital. We only included supratentorial ICH in order to conveniently calculate the volume of ICH. Given this relatively few number of patients, we did not further explore the impact of lateralization and insular involvement on the HRV. We also could not rule out the possibility that the change of HRV was simply the sole effect of ICH in the absence of any involvement of autonomic areas in the brain. In addition, we chose control participants free of cardiovascular disease from outpatient clinic instead of patients admitted to ICU without ICH, which might amplify our results on the differences of HRV. However, our study aim focused on whether stroke location might affect the HRV, and patients with supratentorial ICH formed a unique population since the exact locations and size of brain insults can be easily calculated from simple neuroimaging study.
Secondly, despite that MSE has become a prevailing technique to quantify the complexity of physiological signals, it has several inherent methodological limitations, including artificially reduction of entropy due to the coarse graining procedure, inaccurate entropy estimation at large time scale, elimination of fast temporal scales and its introduction of spurious MSE oscillations, or even undefined entropy value. In order to overcome these drawbacks, several refined methods had been proposed36,37 and might be applied in our further clinical studies.
Thirdly, we excluded patients with AF rhythm because our previous study had shown that the value of the complexity index was less reliable in subjects with AF21. Interestingly, we recently confirmed the usefulness of photoplethysmogram signals from routine pulse oximetry in identifying AF rhythms38. Another study showed that systolic arterial blood pressure variability can also be powerful in predicting outcome in critical care39. Incorporating multi-parameter monitoring in the future can broaden the usefulness of autonomic function in critical settings. Last, we did not have the detailed image data with regard to cerebral microbleeds since the different locations of microbleeds might reflect distinct underlying pathophysiology, such that lobar origin are generally attributed to cerebral amyloid angiopathy while deep origin to hypertensive vasculopathy40.
Conclusions
Our study demonstrated that non-linear complexity of HRV was related to stroke severity, size of hemorrhage and function outcome in patients with supratentorial ICH, especially with coexistence of IVH. Patients with lobar ICH had lowest complexity of HRV. These findings reinforced the concepts that acute stroke, especially those involving lobar areas, had great impact on the brain-heart axis and cardiac autonomic modulation, and a lower complexity index of MSE may played a novel predictor for outcome.
Electronic supplementary material
Acknowledgements
This work was supported by: National Taiwan University Hospital, research grants NTUH PC851 and Academia Sinica Taiwan Biobank, Stroke Biosignature Project BM104010092.
Author Contributions
This study was initially conceived and designed by C.H.C. and S.C.T. Data were acquired by C.H.C., S.C.T., D.Y.L., J.S.S., A.Y.W. and J.S.J. The statistical analyses were done by C.H.C. and D.Y.L. The manuscript was initially drafted by C.H.C. and S.C.T. and critically revised by all authors. All authors read and approved the final manuscript.
Competing Interests
The authors declare no competing interests.
Footnotes
Electronic supplementary material
Supplementary information accompanies this paper at 10.1038/s41598-018-29961-y.
Publisher's note: Springer Nature remains neutral with regard to jurisdictional claims in published maps and institutional affiliations.
References
- 1.Tahsili-Fahadan P, Geocadin RG. Heart-Brain Axis: Effects of Neurologic Injury on Cardiovascular Function. Circulation research. 2017;120:559–572. doi: 10.1161/CIRCRESAHA.116.308446. [DOI] [PubMed] [Google Scholar]
- 2.Chen Z, et al. Brain-Heart Interaction: Cardiac Complications After Stroke. Circulation research. 2017;121:451–468. doi: 10.1161/CIRCRESAHA.117.311170. [DOI] [PMC free article] [PubMed] [Google Scholar]
- 3.Hilz MJ, Dutsch M. Quantitative studies of autonomic function. Muscle & nerve. 2006;33:6–20. doi: 10.1002/mus.20365. [DOI] [PubMed] [Google Scholar]
- 4.Graff B, et al. Heart rate variability and functional outcome in ischemic stroke: a multiparameter approach. J Hypertens. 2013;31:1629–1636. doi: 10.1097/HJH.0b013e328361e48b. [DOI] [PubMed] [Google Scholar]
- 5.De Raedt S, De Vos A, De Keyser J. Autonomic dysfunction in acute ischemic stroke: an underexplored therapeutic area? J Neurol Sci. 2015;348:24–34. doi: 10.1016/j.jns.2014.12.007. [DOI] [PubMed] [Google Scholar]
- 6.Makikallio AM, et al. Heart rate dynamics predict poststroke mortality. Neurology. 2004;62:1822–1826. doi: 10.1212/01.WNL.0000125190.10967.D5. [DOI] [PubMed] [Google Scholar]
- 7.Nayani S, Sreedharan SE, Namboodiri N, Sarma PS, Sylaja PN. Autonomic dysfunction in first ever ischemic stroke: Prevalence, predictors and short term neurovascular outcome. Clin Neurol Neurosurg. 2016;150:54–58. doi: 10.1016/j.clineuro.2016.08.022. [DOI] [PubMed] [Google Scholar]
- 8.Benarroch EE. The central autonomic network: functional organization, dysfunction, and perspective. Mayo Clinic proceedings. 1993;68:988–1001. doi: 10.1016/S0025-6196(12)62272-1. [DOI] [PubMed] [Google Scholar]
- 9.Barron SA, Rogovski Z, Hemli J. Autonomic consequences of cerebral hemisphere infarction. Stroke. 1994;25:113–116. doi: 10.1161/01.STR.25.1.113. [DOI] [PubMed] [Google Scholar]
- 10.Colivicchi F, Bassi A, Santini M, Caltagirone C. Cardiac autonomic derangement and arrhythmias in right-sided stroke with insular involvement. Stroke. 2004;35:2094–2098. doi: 10.1161/01.STR.0000138452.81003.4c. [DOI] [PubMed] [Google Scholar]
- 11.Dutsch M, Burger M, Dorfler C, Schwab S, Hilz MJ. Cardiovascular autonomic function in poststroke patients. Neurology. 2007;69:2249–2255. doi: 10.1212/01.wnl.0000286946.06639.a7. [DOI] [PubMed] [Google Scholar]
- 12.Ozdemir O, Hachinski V. Brain lateralization and sudden death: its role in the neurogenic heart syndrome. J Neurol Sci. 2008;268:6–11. doi: 10.1016/j.jns.2007.11.009. [DOI] [PubMed] [Google Scholar]
- 13.Sykora M, et al. Impaired baroreflex sensitivity predicts outcome of acute intracerebral hemorrhage. Crit Care Med. 2008;36:3074–3079. doi: 10.1097/CCM.0b013e31818b306d. [DOI] [PubMed] [Google Scholar]
- 14.Sykora M, Diedler J, Turcani P, Rupp A, Steiner T. Subacute perihematomal edema in intracerebral hemorrhage is associated with impaired blood pressure regulation. J Neurol Sci. 2009;284:108–112. doi: 10.1016/j.jns.2009.04.028. [DOI] [PubMed] [Google Scholar]
- 15.Sykora M, et al. Autonomic effects of intraventricular extension in intracerebral hemorrhage. Neurocrit Care. 2012;16:102–108. doi: 10.1007/s12028-011-9637-1. [DOI] [PubMed] [Google Scholar]
- 16.Peng CK, Havlin S, Stanley HE, Goldberger AL. Quantification of scaling exponents and crossover phenomena in nonstationary heartbeat time series. Chaos (Woodbury, N.Y.) 1995;5:82–87. doi: 10.1063/1.166141. [DOI] [PubMed] [Google Scholar]
- 17.Lombardi F. Chaos theory, heart rate variability, and arrhythmic mortality. Circulation. 2000;101:8–10. doi: 10.1161/01.CIR.101.1.8. [DOI] [PubMed] [Google Scholar]
- 18.Costa M, Goldberger AL, Peng CK. Multiscale entropy analysis of complex physiologic time series. Physical review letters. 2002;89:068102. doi: 10.1103/PhysRevLett.89.068102. [DOI] [PubMed] [Google Scholar]
- 19.Costa M, Goldberger AL, Peng CK. Multiscale entropy analysis of biological signals. Physical review. E, Statistical, nonlinear, and soft matter physics. 2005;71:021906. doi: 10.1103/PhysRevE.71.021906. [DOI] [PubMed] [Google Scholar]
- 20.Chen CH, et al. Complexity of Heart Rate Variability Can Predict Stroke-In-Evolution in Acute Ischemic Stroke Patients. Sci Rep. 2015;5:17552. doi: 10.1038/srep17552. [DOI] [PMC free article] [PubMed] [Google Scholar]
- 21.Tang SC, et al. Complexity of heart rate variability predicts outcome in intensive care unit admitted patients with acute stroke. J Neurol Neurosurg Psychiatry. 2015;86:95–100. doi: 10.1136/jnnp-2014-308389. [DOI] [PubMed] [Google Scholar]
- 22.Kothari RU, et al. The ABCs of measuring intracerebral hemorrhage volumes. Stroke. 1996;27:1304–1305. doi: 10.1161/01.STR.27.8.1304. [DOI] [PubMed] [Google Scholar]
- 23.Hemphill JC, et al. The ICH score: a simple, reliable grading scale for intracerebral hemorrhage. Stroke. 2001;32:891–897. doi: 10.1161/01.STR.32.4.891. [DOI] [PubMed] [Google Scholar]
- 24.Heart rate variability: standards of measurement, physiological interpretation and clinical use. Task Force of the European Society of Cardiology and the North American Society of Pacing and Electrophysiology. Circulation93, 1043–1065 (1996). [PubMed]
- 25.Porta, A., Addio, G. D., Guzzetti, S., Lucini, D. & Pagani, M. In Computers in Cardiology, 645–648 (2004).
- 26.Ho YL, Lin C, Lin YH, Lo MT. The prognostic value of non-linear analysis of heart rate variability in patients with congestive heart failure–a pilot study of multiscale entropy. PLoS One. 2011;6:e18699. doi: 10.1371/journal.pone.0018699. [DOI] [PMC free article] [PubMed] [Google Scholar]
- 27.DeGiorgio CM, et al. RMSSD, a measure of vagus-mediated heart rate variability, is associated with risk factors for SUDEP: the SUDEP-7 Inventory. Epilepsy Behav. 2010;19:78–81. doi: 10.1016/j.yebeh.2010.06.011. [DOI] [PMC free article] [PubMed] [Google Scholar]
- 28.Oppenheimer SM, Kedem G, Martin WM. Left-insular cortex lesions perturb cardiac autonomic tone in humans. Clinical autonomic research: official journal of the Clinical Autonomic Research Society. 1996;6:131–140. doi: 10.1007/BF02281899. [DOI] [PubMed] [Google Scholar]
- 29.Yoon BW, Morillo CA, Cechetto DF, Hachinski V. Cerebral hemispheric lateralization in cardiac autonomic control. Archives of neurology. 1997;54:741–744. doi: 10.1001/archneur.1997.00550180055012. [DOI] [PubMed] [Google Scholar]
- 30.Hilz MJ, et al. Hemispheric influence on autonomic modulation and baroreflex sensitivity. Ann Neurol. 2001;49:575–584. doi: 10.1002/ana.1006. [DOI] [PubMed] [Google Scholar]
- 31.Laowattana, S. et al. Left insular stroke is associated with adverse cardiac outcome. Neurology66, 477–483 discussion 463, 10.1212/01.wnl.0000202684.29640.60 (2006). [DOI] [PubMed]
- 32.Oppenheimer SM, Gelb A, Girvin JP, Hachinski VC. Cardiovascular effects of human insular cortex stimulation. Neurology. 1992;42:1727–1732. doi: 10.1212/WNL.42.9.1727. [DOI] [PubMed] [Google Scholar]
- 33.Tokgozoglu SL, et al. Effects of Stroke Localization on Cardiac Autonomic Balance and Sudden Death. Stroke. 1999;30:1307–1311. doi: 10.1161/01.STR.30.7.1307. [DOI] [PubMed] [Google Scholar]
- 34.Sreekrishnan A, et al. Intracerebral Hemorrhage Location and Functional Outcomes of Patients: A Systematic Literature Review and Meta-Analysis. Neurocrit Care. 2016;25:384–391. doi: 10.1007/s12028-016-0276-4. [DOI] [PubMed] [Google Scholar]
- 35.Xu YH, Wang XD, Yang JJ, Zhou L, Pan YC. Changes of deceleration and acceleration capacity of heart rate in patients with acute hemispheric ischemic stroke. Clin Interv Aging. 2016;11:293–298. doi: 10.2147/CIA.S99542. [DOI] [PMC free article] [PubMed] [Google Scholar]
- 36.Valencia JF, et al. Refined multiscale entropy: application to 24-h Holter recordings of heart period variability in healthy and aortic stenosis subjects. IEEE Trans Biomed Eng. 2009;56:2202–2213. doi: 10.1109/TBME.2009.2021986. [DOI] [PubMed] [Google Scholar]
- 37.Humeau-Heurtier A. Multivariate refined composite multiscale entropy analysis. Physics Letters A. 2016;380:1426–1431. doi: 10.1016/j.physleta.2016.02.029. [DOI] [Google Scholar]
- 38.Tang SC, et al. Identification of Atrial Fibrillation by Quantitative Analyses of Fingertip Photoplethysmogram. Sci Rep. 2017;7:45644. doi: 10.1038/srep45644. [DOI] [PMC free article] [PubMed] [Google Scholar]
- 39.Porta A, et al. Association between autonomic control indexes and mortality in subjects admitted to intensive care unit. Sci Rep. 2018;8:3486. doi: 10.1038/s41598-018-21888-8. [DOI] [PMC free article] [PubMed] [Google Scholar]
- 40.Greenberg SM, et al. Cerebral microbleeds: a guide to detection and interpretation. The Lancet. Neurology. 2009;8:165–174. doi: 10.1016/S1474-4422(09)70013-4. [DOI] [PMC free article] [PubMed] [Google Scholar]
Associated Data
This section collects any data citations, data availability statements, or supplementary materials included in this article.