Abstract
Key points
The mechanisms underlying long‐term (30 days) intermittent hypoxia (LT‐IH)‐evoked DNA methylation of anti‐oxidant enzyme (AOE) gene repression in the carotid body (CB) reflex pathway were examined.
LT‐IH‐treated rats showed increased reactive oxygen species (ROS) levels in the CB reflex pathway.
Administration of a ROS scavenger or CB ablation blocked LT‐IH‐evoked DNA methylation and AOE gene repression in the central and efferent limbs of the CB reflex.
LT‐IH increased DNA methyltransferase (Dnmt) activity through upregulation of Dnmt1 and 3b proteins by ROS‐dependent inactivation of glycogen synthase kinase 3β (GSK3β) by Akt.
A pan‐Akt inhibitor prevented LT‐IH‐induced GSK3β inactivation, elevated Dnmt protein expression and activity, AOE gene methylation, sympathetic activation and hypertension.
Abstract
Long‐term exposure to intermittent hypoxia (LT‐IH; 30 days), simulating blood O2 profiles during sleep apnoea, has been shown to repress anti‐oxidant enzyme (AOE) gene expression by DNA methylation in the carotid body (CB) reflex pathway, resulting in persistent elevation of plasma catecholamine levels and blood pressure. The present study examined the mechanisms by which LT‐IH induces DNA methylation. Adult rats exposed to LT‐IH showed elevated reactive oxygen species (ROS) in the CB, nucleus tractus solitarius (nTS) and rostroventrolateral medulla (RVLM) and adrenal medulla (AM), which represent the central and efferent limbs of the CB reflex, respectively. ROS scavenger treatment during the first ten days of IH exposure prevented ROS accumulation, blocked DNA methylation, and normalized AOE gene expression, suggesting that ROS generated during the early stages of IH activate DNA methylation. CB ablation prevented the ROS accumulation, normalized AOE gene expression in the nTS, RVLM, and AM and blocked DNA methylation, suggesting that LT‐IH‐induced DNA methylation in the central and efferent limbs of the CB reflex is indirect and requires CB neural activity. LT‐IH increased DNA methyl transferase (Dnmt) activity through upregulation of Dnmt1 and 3b protein expression due to ROS‐dependent inactivation of glycogen synthase kinase 3β (GSK3β) by protein kinase B (Akt). Treating rats with the pan‐Akt inhibitor GSK690693 blocked the induction of Dnmt activity, Dnmt protein expression, and DNA methylation, leading to normalization of AOE gene expression as well as plasma catecholamine levels and blood pressure.
Keywords: sleep apnea, intermittent hypoxia, anti‐oxidant enzymes, DNA methyltransferases, GSK3β, blood pressure
Key points
The mechanisms underlying long‐term (30 days) intermittent hypoxia (LT‐IH)‐evoked DNA methylation of anti‐oxidant enzyme (AOE) gene repression in the carotid body (CB) reflex pathway were examined.
LT‐IH‐treated rats showed increased reactive oxygen species (ROS) levels in the CB reflex pathway.
Administration of a ROS scavenger or CB ablation blocked LT‐IH‐evoked DNA methylation and AOE gene repression in the central and efferent limbs of the CB reflex.
LT‐IH increased DNA methyltransferase (Dnmt) activity through upregulation of Dnmt1 and 3b proteins by ROS‐dependent inactivation of glycogen synthase kinase 3β (GSK3β) by Akt.
A pan‐Akt inhibitor prevented LT‐IH‐induced GSK3β inactivation, elevated Dnmt protein expression and activity, AOE gene methylation, sympathetic activation and hypertension.
Introduction
Sleep apnoea (SA) is a highly prevalent respiratory disorder, affecting an estimated 10–15% of adults in the US (Peppard et al. 2013). SA is characterized by brief (10–40 s), repetitive cessation of breathing during sleep which is either due to obstruction of the upper airway (obstructive sleep apnoea, OSA) or due to defective respiratory rhythm generation by the central nervous system (central SA). Patients with SA exhibit heightened sympathetic nerve activity, often leading to hypertension (Lavie et al. 2000; Nieto et al. 2000; Peppard et al. 2000; Dempsey et al. 2010). Exposing rodents to intermittent hypoxia (IH), simulating the O2 profiles encountered during SA, also increases sympathetic nerve activity, plasma catecholamines and blood pressure (BP) (Fletcher, 1995; Peng et al. 2014; Iturriaga et al. 2016). It was proposed that IH activates the carotid body (CB), which is the major sensory organ for monitoring O2 levels in the arterial blood and thereby causes reflex activation of the sympathetic nervous system in SA patients (Cistulli & Sullivan, 1994). Consistent with this possibility, the CB reflex is augmented in SA patients as evidenced by exaggerated sympathetic nerve and ventilatory responses to acute hypoxia (Hedner et al. 1992; Narkiewicz et al. 1999; Kara et al. 2003). In IH exposed rodents, disrupting the CB reflex either by sectioning the carotid sinus nerves (Fletcher et al. 1992; Lesske et al. 1997) or by selective ablation of the CB or by denervating the adrenal gland, a major sympathetic end organ (Peng et al. 2014), prevents hypertension. Together these findings suggest that a heightened CB reflex is the major mechanism mediating sympathetic activation and hypertension in SA patients and in IH‐exposed rodents.
IH has been shown to increase levels of reactive oxygen species (ROS) in the CB reflex pathway including the CB (Peng et al. 2003b, 2014), nucleus tractus solitarius (nTS) and rostral ventrolateral medulla (RVLM) (Zhan et al. 2005; Peng et al. 2014), and adrenal medulla (AM) (Kumar et al. 2006; Peng et al. 2014). The IH‐evoked increase in ROS is in part due to up‐regulation of pro‐oxidant enzymes (e.g. NADPH oxidases or Nox; Zhan et al. 2005; Peng et al. 2009); as well as down‐regulation of anti‐oxidant enzymes (AOEs; e.g. superoxide dismutase or Sod; Nanduri et al. 2009). Increased ROS generation in the CB is due to direct effects of IH (i.e. repeated cycles of hypoxia and reoxygenation), whereas the effects of IH in the nTS, RVLM and AM are indirect and require increased CB neural activity (Peng et al. 2014). Rodents treated with a ROS scavenger exhibit a remarkable absence of increased ROS levels, hypertension and sympathetic activation in response to IH (Peng et al. 2003a, 2006; Iturriaga et al. 2016). These studies suggest that ROS signalling is a major cellular mechanism underlying IH‐evoked CB reflex‐dependent hypertension.
Reversal of sympathetic activation and hypertension caused by heightened CB reflex depends on the duration of IH exposure (Nanduri et al. 2017). The increased sympathetic tone, hypertension and ROS levels caused by short‐term‐IH (10 days; ST‐IH) are reversed by recovery in room air for 10 days, whereas those caused by long‐term‐IH (30 days; LT‐IH) persist even after a 30 day recovery in room air (Nanduri et al. 2017). The long‐lasting effects of LT‐IH are reminiscent of continuous positive airway pressure (CPAP) treatment‐resistant hypertension reported in a subset of OSA patients (Mulgrew et al. 2010; Dudenbostel & Calhoun, 2012). The persistent effects of LT‐IH are associated with a long‐lasting increase in ROS levels in the CB reflex pathway, which is in part due to repression of several AOE genes (Nanduri et al. 2017). AOE gene repression in the CB of rodents exposed to LT‐IH is mediated by DNA methylation, which is an epigenetic mechanism that regulates gene expression by altering accessibility of the DNA to transcription factors without changes in the coding sequence of DNA per se (Feinberg, 2007; Sharma et al. 2010). Treating rats with decitabine, a DNA hypomethylating agent, either during LT‐IH or during the 30 day recovery period, normalized ROS levels in the CB reflex pathway and restored BP as well as sympathetic activity (Nanduri et al. 2017). While these studies suggest that epigenetic regulation of AOE genes by DNA methylation is an important molecular mechanism underlying the long‐lasting effects of LT‐IH, how LT‐IH activates DNA methylation is not known.
Emerging evidence suggests that ROS activates DNA methylation (Campos et al. 2007; Wu & Ni, 2015). We tested the hypothesis that ROS mediates LT‐IH‐evoked DNA methylation of AOE genes in the CB reflex pathway. This possibility was tested in adult rats exposed to LT‐IH. Our results demonstrate that ROS increases DNA methylation through stabilization of DNA methyltransferase (Dnmt) proteins, which catalyse DNA methylation. The ROS‐mediated stabilization of Dnmts requires protein kinase B (Akt)‐dependent inactivation of glycogen synthase kinase (GSK)‐3β. Our results further demonstrate a previously uncharacterized role for CB neural activity in activating DNA methylation in the central and efferent limbs of the CB reflex.
Methods
Ethical approval
Experimental protocols (no. 71810) were approved by the Institutional Animal Care and Use Committee of the University of Chicago and studies were performed in accordance with National Institutes of Health (NIH) guidelines. Studies were conducted on adult, male Sprague‐Dawley rats (200–300 gm) obtained from commercial vendor (Charles‐River, USA). All studies were performed with ethical principles outlined by The Journal of Physiology and ensure this work complies with the journal's animal ethics checklist. The details of anaesthesia are described under appropriate sections described below. Rats were killed with an overdose of anaesthesia (urethane 3 g kg−1; i.p.) after termination of the experiment.
Exposure to LT‐IH
Adult male Sprague‐Dawley rats were exposed to IH on a daily basis between 09.00 h and 17.00 h for 30 days as described previously (Peng et al. 2003b; Nanduri et al. 2017). The IH protocol consisted of 15 s of 5% O2 followed by 5 min room air, 9 episodes h−1, and 8 h day−1. Control experiments were performed on age‐matched rats exposed to alternating cycles of room air instead of hypoxia. Experiments were conducted on freely mobile rats fed ad libitum. All measurements were made within 2 days after completion of the 30 day IH exposure. Manganese (III) tetrakis (1‐methyl‐4‐pyridyl)porphyrin pentachloride (MnTmPyP; 5 mg kg−1 day−1) and GSK690693 (10 mg kg−1 day−1) were administered i.p. every day during the first 10 days of IH exposure.
Carotid body ablation (CBA)
Rats were anaesthetized with a mixture of ketamine and xylazine mixture (70 mg kg−1 and 9 mg kg−1 i.p.). The carotid artery bifurcation was exposed, and CBs were cryocoagulated with liquid nitrogen as described previously (Verna et al. 1975; Peng et al. 2014). Sham‐operated rats served as controls. Four weeks were allowed for recovery from surgery. Subsequently breathing was monitored by plethysmography and the effect of CBA was confirmed by the absence of breathing stimulation in response to hypoxia (12% O2). Thereafter, rats were exposed to either 30 day IH or normoxia.
Measurement of BP and plasma noradrenaline (norepinephrine)
BP was measured in conscious rats between 09.00 h and 11.00 h by tail‐cuff method using a non‐invasive BP system (IITC Life Science Inc., Woodland Hills, CA, USA) as described (Peng et al. 2006; Nanduri et al. 2017). Arterial blood samples were collected in vials containing heparin (30 IU ml−1) from rats anaesthetized with urethane (1.2 g kg−1 i.p.). Plasma was separated and noradrenaline (NA) was extracted with cis‐diol‐specific affinity gel, acetylated and quantitated by competitive ELISA kit (Labor‐Diagnostika, Nord Gmbh & Co. KG, Nordhorn, Germany).
Isolation of tissues
Carotid bodies, adrenal glands and brainstem were removed from urethane‐anaesthetized rats, frozen in liquid nitrogen and stored at –80°C for further analysis. The AM was dissected under ice‐cold conditions to remove the cortical region. Coronal brainstem sections (300 μm thick) were cut with a cryostat at –20°C, and rostral ventrolateral medulla (RVLM), nucleus tractus solitarius (nTS) and control brainstem regions were excised with a chilled micro‐punch needle.
Reverse transcription (RT) and quantitative real‐time PCR (qPCR) assay
Anti‐oxidant enzyme (AOE) gene expression in the AM, nTS, and RVLM was analysed by RT‐qPCR assay using SYBR GreenER (Life Technologies, Grand Island, NY, USA) as previously described (Nanduri et al. 2012). Briefly, RNA was extracted from one CB, one AM and 2 micropunches of nTS, RVLM and control region using Direct‐zol RNA MicroPrep (Zymoresearch no. R2060) and reverse‐transcribed using SuperScript III (Thermo Fisher). Relative mRNA quantification, expressed as fold change (F) was calculated using the formula F = 2−ΔΔCT where ΔC T is the difference between the threshold cycles of the given target cDNA and 18S rRNA, and Δ(ΔC T) is the difference between the ΔC T values under normoxia and IH. PCR specificity was confirmed by omitting the template and by performing a standard melting curve analysis. The nucleotide sequences of primers used for qPCR are given in Table 1.
Table 1.
Sequence of primers
| Gene | Sequence | Gene Bank no. |
|---|---|---|
| 18S |
|
NR_046237.1 |
| Sod‐1 |
|
NM_017050.1 |
| Sod‐2 |
|
NM_017051.2 |
| Catalase |
|
NM_012520.2 |
| Txnrd2 |
|
NM_022584.2 |
| Prdx4 |
|
NM_053512.2 |
| Gpx2 |
|
NM_183403.2 |
| Dnmt1 |
|
NM_053354.3 |
| Dnmt3a |
|
NM_001003958.1 |
| Dnmt3b |
|
NM_001003959.1 |
DNA methylation assay
Genomic DNA was purified from 4 CBs and one AM in genomic lysis buffer provided in the Quick‐gDNA Miniprep kit (Zymoresearch no. D3006). Typical yields from tissue from 4 CBs and one AM were 0.5 μg and 2 μg, respectively. DNA purity was analysed by measuring the ratio of A 260/A 280 by the nanodrop approach. Samples with ratio value >1.8 were used for all subsequent analysis. DNA methylation of the AOE genes was analysed using Epitect Methyl II custom PCR array (Qiagen Inc., Valencia, CA, USA) as described (Nanduri et al. 2012). Briefly methylation‐sensitive and insensitive restriction enzymes were used to selectively digest unmethylated or methylated genomic DNA (0.25 μg) isolated from the CB and AM, respectively. The relative amount of DNA remaining after each digestion was quantified by real‐time qPCR using primers that flanked CpG islands near the target promoter region. Gene methylation status, expressed as percentage of cytosine residues methylated, was analysed by the software provided by Qiagen along with the kit. The values represent the fraction of input genomic DNA containing two or more methylated CpG sites in the targeted region of a gene.
Immunoblot assay
Nuclear extracts were prepared from AM using nuclear extraction kit (Active Motif no. 40010) Briefly, one AM was homogenized in 200 μl of hypotonic buffer provided in the kit and centrifuged at 850 g for 10 min at 4°C. The pellet was re‐suspended in 200 μl of hypotonic buffer and small sample is checked under the microscope to verify that cells have been efficiently lysed and that nulcei have been released. The suspension is centrifuged at 14,000 g for 30 s. The nuclear pellet was re‐suspended in 40 μl of complete lysis buffer provided. Protein yield estimated using BioRad protein assay kit (no. 500001) from a single AM was 20–25 μg. Nuclear extract (10 μg) was fractionated by 6% polyacrylamide‐SDS gel electrophoresis and immunoblot assays were performed with antibodies against Dnmt1 (Novus Biologicals; 1:2000 dilution), Dnmt3a and Dnmt3b (Cell Signaling Technology; 1:2000 dilution) using TATA binding protein (TBP) (Abcam; 1:2000 dilution) as loading control.
Akt kinase assay
Akt kinase activity was measured by an in vitro kinase assay kit (Cell Signaling: no. 9840) using glutathione‐S‐transferase‐GSK3β fusion protein as substrate. Briefly, two AM were lysed in 200 μl of lysis buffer provided. 600 μg of cell lysate was incubated with 30 μl of immobilized (bead conjugate) rabbit anti phospho‐AKT (ser473) antibody. The immunoprecipitated pellet was incubated with GSK3β fusion protein in kinase buffer for 30 min at 30°C. The reaction is terminated by adding 25 μl of SDS‐ sample buffer and boiled for 5 min. Samples are loaded on gradient (4–15%) SDS‐PAGE gels. Phosphorylation of GSK3β was measured by immunoblot assay using anti‐phospho‐GSK3β antibody (Cell Signaling).
Measurement of malondialdehyde (MDA) levels and enzyme activities
Two AM were homogenized and centrifuged at 500 g for 5 min at 4°C. Mitochondrial and cytosolic fractions were isolated from the AM by Ficoll gradient method and differential centrifugation (Lai & Clark, 1979; Khan et al. 2011). Aconitase enzyme activity was measured in 25 μg of the mitochondrial and cytosolic fractions by monitoring the increase in absorbance at 340 nm associated with the formation of NADPH during the conversion of isocitrate to α‐ketoglutarate. The rate of NADPH production is proportional to aconitase activity and expressed as nanomoles of isocitrate formed per minute per milligram of protein (Khan et al. 2011). For measurement of MDA levels 4CBs, 2 punches of NTS and 4 punches of RVLM and control regions were homogenized in 60 μl of 20 mm phosphate buffer (pH 7.4). MDA levels were analysed in 5 μg of the lysate as previously described (Peng et al. 2006) and were presented as nanomoles of MDA formed per milligram of protein. Dnmt activity was analysed in the nuclear extracts (4 μg) using a commercially available kit (EpiQuik DNMT activity/Inhibition Assay Ultra Kit (Epigentek: n0. P‐3009).
Data analysis
Data were expressed as means ± SEM. Statistical analysis was performed by analysis of variance (ANOVA). The Wilcoxon‐Mann‐Whitney test was used for analysis of normalized data. P values <0.05 were considered significant.
Results
ROS scavenger blocks DNA methylation and AOE gene repression induced by LT‐IH
We determined whether ROS contribute to DNA methylation of AOE genes in the CB reflex pathway. To this end, rats were exposed to LT‐IH and during the first ten days of IH exposure, they were treated with vehicle or MnTmPyP, a membrane‐permeable ROS scavenger (Gardner et al. 1996) Fig. 1 A, top panel). DNA methylation and mRNA expression of AOE genes along with ROS levels were analysed in the CB, nTS, RVLM and AM, which represent the afferent, central and efferent limbs of the CB reflex. The following AOE genes were analysed: superoxide dismutase 1 and 2 (Sod1, Sod2), catalase (Cat), thioredoxin reductase 2 (Txnrd2), peroxiredoxin 4 (Prdx4), and glutathione peroxidase 2 (Gpx2).
Figure 1. ROS scavenger prevents LT‐IH‐induced ROS, AOE gene methylation and repression in the CB.
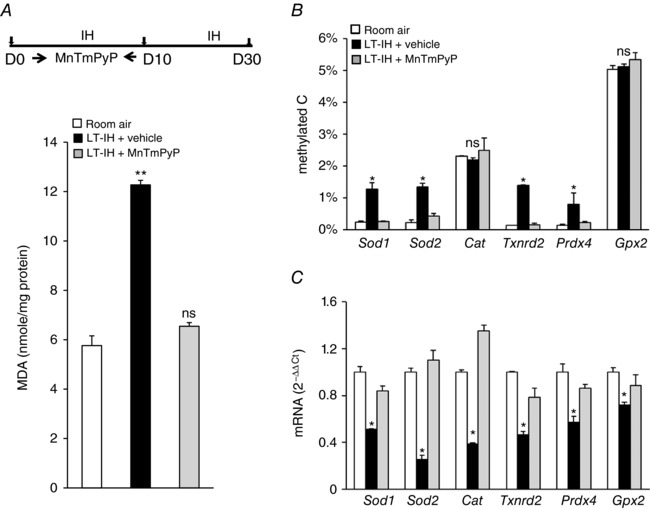
Top panel in A, rats were exposed to room air or exposed to LT‐IH and were treated with vehicle or MnTMPyP, a ROS scavenger during the first 10 days of IH exposure. A–C, analysis of malondialdehyde (MDA) levels (index of ROS levels; A), DNA methylation of AOE genes expressed as percentage of total cytosines that were methylated (methylated C; B), and AOE gene expression analysed by qRT‐PCR assay was normalized to 18S rRNA, and expressed as fold change from room air controls (C). Sod1, Sod2, superoxide dismutase 1 and 2; Cat, catalase; Txnrd2, thioredoxin reductase; Prdx4, peroxiredoxin 4; Gpx2, glutathione peroxidase 2. Data are presented as means ± SEM from 7 independent experiments for each treatment. ** P < 0.01; * P < 0.05; ns, not significant, P > 0.05.
CBs from vehicle‐treated, LT‐IH‐exposed rats showed increased malondialdehyde (MDA) levels, which reflect lipid oxidation as a measure of ROS (Ramanathan et al. 2005). DNA methylation was significantly increased at the Sod1, Sod2, Txnrd2, and Prdx4 (but not the Cat or Gpx2) loci and mRNA expression of all six AOE genes was reduced (Fig. 1 A–C). Treatment of rats with MnTmPyP blocked the effects of IH on ROS levels, DNA methylation and AOE gene expression (Fig. 1 A–C).
CB sensory axons course through the carotid sinus nerve to the brainstem and synapse with neurons in the nTS and RVLM. Micro‐punches of the nTS, RVLM and an adjacent brainstem area unrelated to the CB reflex were harvested from vehicle or MnTmPyP‐treated LT‐IH rats (for coordinates see Fig. 2 A). Vehicle‐treated rats showed increased ROS abundance (as indicated by increased MDA levels) in the nTS and RVLM, but not in the control brainstem region that does not receive CB sensory input (Fig. 2 B). Despite pooling from three rats, the amount of tissue obtained from micro‐punches was inadequate for monitoring DNA methylation of AOE genes. Therefore, mRNA expression of AOE genes was analysed by RT‐qPCR assay. Vehicle‐treated LT‐IH rats showed reduced abundance of mRNA transcribed from all six AOE genes in the RVLM and four genes (Sod1, Sod2, Txnrd2, and Prdx4) in the nTS but not in the control region unrelated to CB reflex (Fig. 2 C). MnTmPyP‐treated LT‐IH rats showed an absence of AOE gene repression in the nTS and RVLM (Fig. 2 D and E).
Figure 2. ROS scavenger prevents LT‐IH‐evoked increase in ROS and AOE gene repression in the nTS and RVLM.
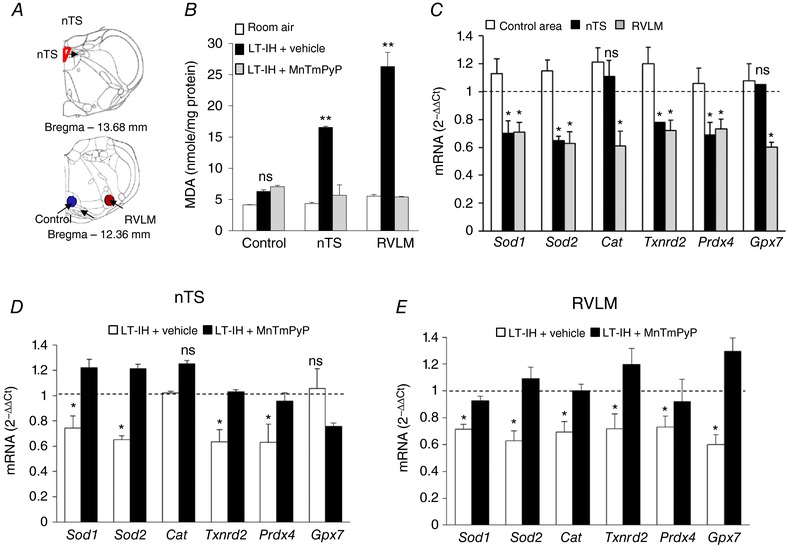
Micro‐punches of nTS, RVLM and a control region in the brainstem were obtained from rats exposed to room air, vehicle‐treated rats exposed to 30 days of IH (LT‐IH + vehicle), and MnTmPyP‐treated rats exposed to 30 days of IH (LT‐IH + MnTmPyP). A, anatomical localization of nTS (red), RVLM (red), and a control brainstem region (Control, blue) based on adult rat brain atlas (Paxinos & Watson, 2006). B and C, effect of LT‐IH on malondialdehyde (MDA) levels (index of ROS) (B), AOE gene expression (Sod1, Sod2, superoxide dismutase 1 and 2; Cat, catalase; Txnrd2, thioredoxin reductase; Prdx4, peroxiredoxin 4; Gpx2, glutathione peroxidase 2) in the control brainstem region (control area), nTS and RVLM (C). D and E, effects of MnTmPyP on LT‐IH‐induced AOE gene repression in nTS (D) and RVLM (E). Data presented as means ± SEM, n = 9 rats per group; ** P < 0.01; * P < 0.05; ns, not significant, P > 0.05.
The AM is an end organ of the sympathetic nervous system representing the efferent limb of the CB reflex. Aconitase enzyme activity was monitored in cytosolic and mitochondrial fractions as an index of ROS generation (Khan et al. 2011), along with measurements of DNA methylation and AOE mRNA expression. Vehicle‐treated LT‐IH rats showed elevated ROS as indicated by decreased aconitase enzyme activity, and increased DNA methylation of Sod1, Sod2, Txnrd2, and Prdx4 (but not Cat or Gpx2), as well as decreased expression of Sod1, Sod2, Txnrd2, and Prdx4 (but not Cat or Gpx2), and all of these effects were absent in MnTmPyP‐treated LT‐IH rats (Fig. 3 A–C).
Figure 3. ROS scavenger prevents LT‐IH‐induced ROS, AOE gene methylation and repression in the AM.
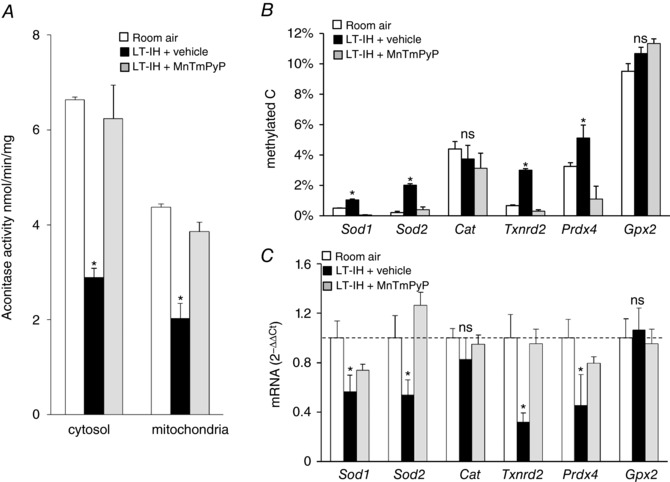
AMs were harvested from rats exposed to room air or exposed to LT‐IH and were treated with either vehicle (LT‐IH + vehicle) or MnTmPyP (LT‐IH + MnTmPyP), a ROS scavenger during the first 10 days of IH exposure. A, aconitase activity in cytosolic and membrane fractions (index of ROS). B, DNA methylation of AOE genes expressed as percentage of total cytosines that were methylated (methylated C). C, AOE gene expression analysed by qRT‐PCR assay was normalized to 18S rRNA, and expressed as fold change from room air controls. Sod1, Sod2, superoxide dismutase 1 and 2; Cat, catalase; Txnrd2, thioredoxin reductase; Prdx4, peroxiredoxin 4; Gpx2, glutathione peroxidase 2. Data presented as means ± SEM, n = 6 rats per group; * P < 0.05; ns, not significant, P > 0.05.
CB ablation (CBA) prevents DNA methylation and AOE gene repression induced by LT‐IH
Selective ablation of the CB prevents IH‐induced ROS generation in the central and efferent limbs of the CB reflex (Peng et al. 2014). We hypothesized that, in the absence of the CB, LT‐IH would not induce DNA methylation in the nTS, RVLM and AM representing the central and efferent limbs of the CB reflex because of a lack of ROS generation. This possibility was examined in rats exposed to LT‐IH with an intact CB or after ablation of the CB (CBA). Hypoxic ventilatory response (HVR) was determined by monitoring breathing in response to 12% inspired O2 4 weeks after CBA. Rats with intact CB exhibited 145 ± 4% increase in minute ventilation from baseline whereas CBA rats showed only 113 ± 8% increase in breathing in response to 12% O2 (P < 0.01), suggesting CBA markedly attenuated the magnitude of HVR. CBA blocked LT‐IH‐induced changes in ROS abundance and AOE gene expression in the nTS and RVLM as compared to LT‐IH rats with intact CBs (Fig. 4 A–C). Likewise, AMs of CBA rats also showed absence of increased ROS generation in cytosolic and mitochondrial fractions, DNA methylation and repression of AOE genes compared to LT‐IH rats with intact CBs (Fig. 5 A–C).
Figure 4. Carotid body ablation (CBA) prevents LT‐IH‐evoked ROS and AOE gene repression in the nTS and RVLM.
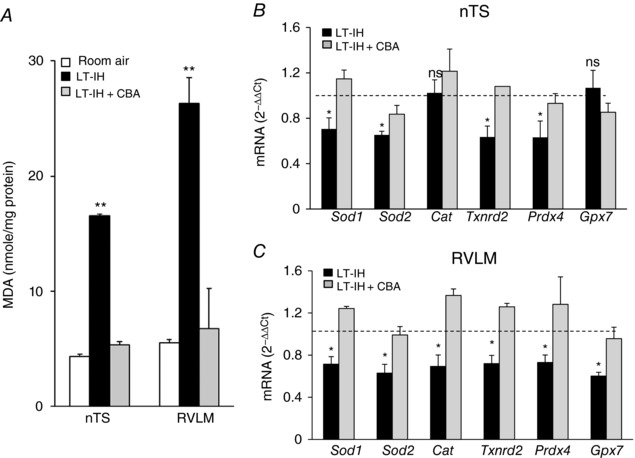
Micro‐punches of nTS, RVLM were obtained from sham‐operated rats exposed to room air; sham‐operated rats exposed to 30 days of IH with intact CB (LT‐IH), and CBA rats exposed to 30 days of IH (LT‐IH + CBA). A, malondialdehyde (MDA) levels (index of ROS). B and C, AOE gene repression (Sod1, Sod2, superoxide dismutase 1 and 2; Cat, catalase; Txnrd2, thioredoxin reductase; Prdx4, peroxiredoxin 4; Gpx2, glutathione peroxidase 2) in the nTS (B) and RVLM (C). Data presented as means ± SEM, n = 9 rats per group; ** P < 0.01; * P < 0.05; ns, not significant, P > 0.05.
Figure 5. Carotid body ablation (CBA) prevents LT‐IH‐induced ROS, DNA methylation and repression of AOE genes in the AM.
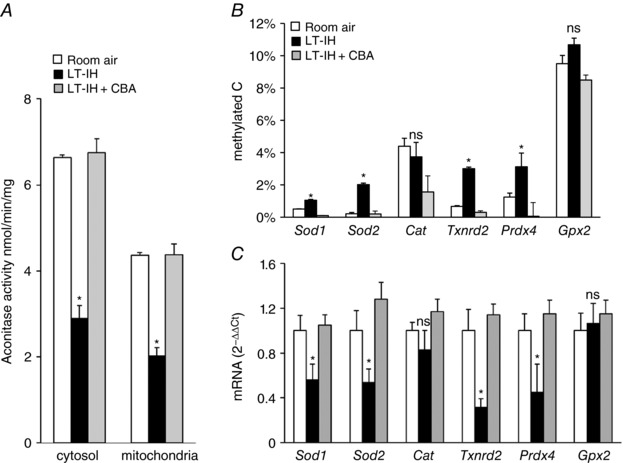
AMs were harvested from sham‐operated rats exposed to room air; sham‐operated rats exposed to 30 days of IH with intact CB (LT‐IH); and CB‐ablated rats exposed to 30 days of IH (LT‐IH + CBA). A, aconitase activity in cytosolic and membrane fractions (index of ROS). B, DNA methylation of AOE genes expressed as percentage of total cytosines that were methylated (methylated C). C, AOE gene expression analysed by qRT‐PCR assay was normalized to 18S rRNA, and expressed as fold change from room air controls. Sod1, Sod2, superoxide dismutase 1 and 2; Cat, catalase; Txnrd2, thioredoxin reductase; Prdx4, peroxiredoxin 4; Gpx2, glutathione peroxidase 2. Data presented as means ± SEM, n = 6 rats per group; * P < 0.05; ns, not significant, P > 0.05.
ROS mediate increased Dnmt protein expression in response to LT‐IH
We next investigated the mechanism by which ROS contribute to LT‐IH‐evoked DNA methylation. LT‐IH increases the expression of Dnmt1 and Dnmt3b, which catalyse DNA methylation (Nanduri et al. 2017). Previous studies suggested that ROS contributes to increased expression of Dnmt proteins (Campos et al. 2007; Wu & Ni, 2015). To determine the role of ROS in LT‐IH induced increase in Dnmt protein expression, rats were exposed to LT‐IH and were treated with vehicle or MnTmPyP during the first 10 days of IH treatment. After completion of the LT‐IH exposure, Dnmt enzyme activity and protein levels were determined. The AM was analysed in these experiments because it provided adequate protein for immunoblot and biochemical assays. AMs of vehicle‐treated LT‐IH rats showed elevated Dnmt enzyme activity, and increased expression of Dnmt1 and Dnmt3b proteins, and these effects were absent in MnTmPyP‐treated rats (Fig. 6 A–C).
Figure 6. Effect of ROS scavenger on Dnmt enzyme activity and proteins in AM of LT‐IH exposed rats.

AMs were harvested from rats exposed to room air or exposed to LT‐IH and were treated with either vehicle (LT‐IH + vehicle) or MnTmPyP (LT‐IH + MnTmPyP), a ROS scavenger during the first 10 days of IH exposure. A, Dnmt enzyme activity. B, representative immunoblots of Dnmt1, Dnmt3a, Dnmt3b, and TATA binding protein (TBP) as loading control. C, quantitation by densitometric analysis of Dnmt proteins. Molecular weights of proteins are presented as kilodaltons (kDa). Data in bar graphs are presented as means ± SEM from 5 independent experiments. * P < 0.05; ns, not significant, P > 0.05 compared to room air exposed control rats.
ROS‐dependent GSK3β inactivation by Akt mediates increased Dnmt protein expression
We then sought to determine the mechanism by which ROS increase Dnmt protein abundance. Recent studies suggested that inactivation of glycogen synthase (GSK)3β leads to increased Dnmt protein stability (Lin et al. 2010; Li et al. 2013; Lin & Wang, 2014). Akt‐dependent phosphorylation of Serine‐9 inactivates GSK3β (Sharma et al. 2002; Taketo, 2004). Given that ROS are potent activators of Akt (Kitagishi & Matsuda, 2013), we hypothesized that IH‐induced ROS activates Akt, which in turn inactivates GSK3β by phosphorylating Serine‐9, leading to increased Dnmt protein accumulation. Since Akt activation requires phosphorylation at Threonine‐308 and Serine‐473 (Hart & Vogt, 2011), we monitored Akt phosphorylation by immunoblot assays in AM tissues of vehicle‐ or MnTMPyP‐treated LT‐IH rats. AMs of vehicle‐treated LT‐IH rats showed increased Akt phosphorylation at Threonine‐308 and Serine‐473, without changes in total Akt protein levels, and these effects were absent in MnTMPyP‐treated LT‐IH rats (Fig. 7 A and B). We then examined whether Akt activation leads to inactivation of GSK3β. Immunoprecipitation assays of AM lysates showed increased phosphorylation of GSK3β at Serine‐9, along with activation of Akt, as evidenced by Serine‐473 phosphorylation, in LT‐IH rats treated with vehicle, and these effects were absent in MnTMPyP‐treated LT‐IH rats (Fig. 7 C and D).
Figure 7. ROS‐dependent Akt activation and GSK3β inactivation in LT‐IH‐treated rats.
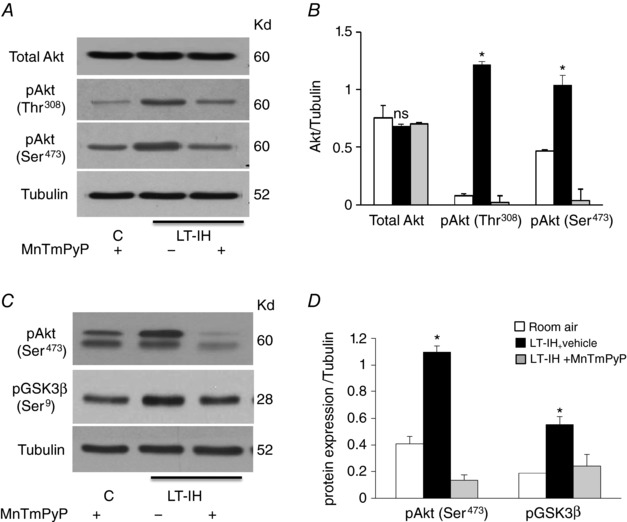
AMs were harvested from LT‐IH rats treated with either vehicle or MnTMPyP during the first 10 days of IH exposure and phosphorylation of Akt (pAkt) at Thr‐308 and Ser‐473 was monitored as an index of Akt activation and phosphorylation of GSK3β at Ser‐9 as index of its inactivation by immunoblot assay. A, representative immunoblots of total Akt protein, pAkt Thr‐308, pSer‐473, and tubulin (loading control). B, quantitation by densitometric analysis. C, representative blots of AKT kinase assay. AKT was immunoprecipitated from cell lysates by immobilized pAkt Ser‐473, followed by an in vitro kinase assay using GSK3β fusion protein as substrate as described in Methods. Phosphorylation of GSK‐3β fusion protein was measured by immunoblot using pGSK3β (Ser21/9) antibody. Tubulin is shown as input control for cell lysates taken for immunoprecipitation. D, quantitation by densitometric analysis. Molecular weights of proteins are represented by kilodaltons (kDa). Data are presented as means ± SEM from 5 independent experiments. * P < 0.05; ns, not significant, P > 0.05 compared to room air exposed control rats.
We next determined whether blocking GSK3β inactivation normalizes Dnmt protein levels in the AM of LT‐IH rats. Previous studies reported that systemic administration of GSK690693 prevents GSK3β phosphorylation at Serine‐9 in a dose‐ and time‐dependent manner (Rhodes et al. 2008; Altomare et al. 2010). Therefore, rats were treated with GSK690693 (10 mg kg−1 i.p.) every day during the first 10 days of IH exposure. GSK690693 treatment blocked IH‐induced GSK3β phosphorylation at Serine‐9, and prevented the increased Dnmt protein expression and enzyme activity (Fig. 8 A–C).
Figure 8. GSK 690693, a pan Akt‐inhibitor prevents GSK3β inactivation, upregulation of Dnmt proteins, and Dnmt activity in LT‐IH rats.
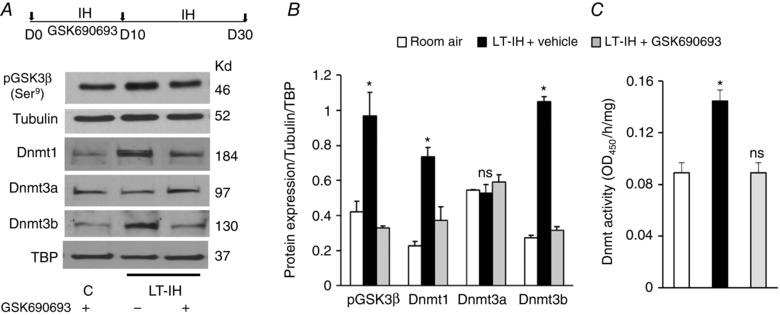
Top panel in A, AMs were harvested from rats exposed to room air or exposed to LT‐IH and were treated with either vehicle (LT‐IH + vehicle) or GSK 690693 (LT‐IH + GSK690693), a pan‐Akt inhibitor during the first 10 days of IH exposure. A, representative immunoblots of pGSK3β‐Serine‐9 (Ser9), tubulin (loading control for pGSK3β), Dnmt1, Dnmt3a, Dnmt3b, and TATA binding protein (TBP) as loading control. B, quantitation by densitometric analysis of pGSK3β protein normalized to tubulin and Dnmt1, 3a and 3b proteins normalized to TBP. C, Dnmt enzyme activity. Molecular weights of proteins are presented as kilodaltons (kDa). Data in bar graphs are presented as means ± SEM from 5 independent experiments. * P < 0.05; ns, not significant, P > 0.05 compared to room air exposed control rats.
Akt inhibitor prevents LT‐IH‐induced DNA methylation and hypertension
Because GSK690693 prevented increased Dnmt protein expression and enzyme activity in LT‐IH rats, we further determined whether it also prevents LT‐IH‐induced AOE gene methylation, as well as sympathetic activation and hypertension. LT‐IH rats treated with GSK690693 during the first 10 days of LT‐IH showed neither increased methylation nor AOE gene repression in the AM, nor did they show sympathetic activation, as indicated by elevated plasma noradrenaline levels, or hypertension (Fig. 9 A–D).
Figure 9. Effect of GSK 690693 on DNA methylation, AOE mRNAs, plasma noradrenaline (NA) and mean blood pressures (MBP) in rats exposed to LT‐IH.
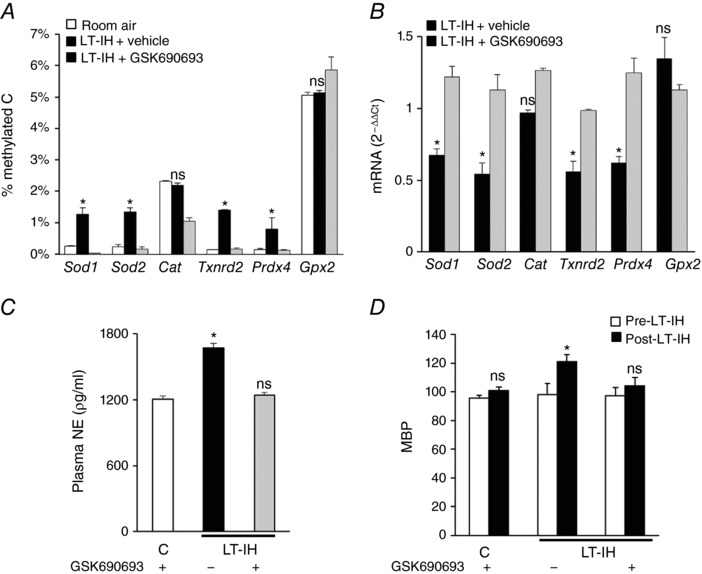
Rats exposed to room air or exposed to LT‐IH and were treated with either vehicle (LT‐IH + vehicle) or GSK 690693 (LT‐IH + GSK690693), a pan‐Akt inhibitor during the first 10 days of IH exposure. A, DNA methylation of AOE genes expressed as percentage of methylated cytosines (methylated C). B, mRNA abundances of AOE genes normalized to 18S rRNA and expressed as relative change from room air controls. C, plasma NA levels. D, mean blood pressure (MBP). Data are presented as means ± SEM from 9 independent experiments. * P < 0.05; ns, not significant, P > 0.05 compared to room air exposed control rats.
Discussion
The new findings of the present study are: (a) ROS mediate LT‐IH‐evoked DNA methylation and AOE gene repression in the CB reflex pathway; (b) CBA prevents LT‐IH‐induced DNA methylation and AOE gene repression in the central and efferent limbs of the CB reflex, and (c) Lt‐IH‐induced DNA methylation involves stabilization of Dnmt proteins through ROS‐dependent inactivation of GSK3β by Akt. LT‐IH increased DNA methylation and AOE gene repression in the CB and AM, representing the afferent and efferent limbs of the CB reflex, a finding consistent with our previous study (Peng et al. 2014). Although insufficient tissue precluded the analysis of DNA methylation, our results further demonstrate LT‐IH‐induced AOE gene repression in the nTS and RVLM, which represent the central limb of the CB reflex. Besides nTS and RVLM, the paraventricular nucleus (PVN) of the hypothalamus is also an important component of the central limb of the CB reflex (Reddy et al. 2005). It remains to be established whether the PVN also exhibits DNA methylation of AOE genes in response to LT‐IH.
Treating rats with a ROS scavenger during the first 10 days of IH was sufficient to block LT‐IH‐evoked DNA methylation and AOE gene repression, suggesting that ROS generated during initial stages of IH exposure triggers DNA methylation by LT‐IH. The reduced Sod1, Sod2, Txnrd2 and Prdx4 mRNA expression in response to LT‐IH was associated with DNA methylation, whereas Cat or Gpx2, which were not methylated in response to LT‐IH, exhibited no changes in mRNA abundance, demonstrating that DNA methylation mediates AOE gene repression. The RVLM, which showed relatively higher ROS abundance compared to the nTS (Fig. 4 A), showed repression of all six AOE genes analysed (Fig. 4 C), whereas nTS showed repression of only four out of six (Fig. 4 B). These findings suggest that: (a) AOE gene repression is cell selective, and (b) a causal relationship between the magnitude of ROS generated by IH and the degree of AOE gene repression by DNA methylation. We previously reported that LT‐IH leads to long‐lasting elevation of ROS levels in the CB reflex pathway (Peng et al. 2014). Remarkably, the LT‐IH induced increase in ROS levels was blocked by treating rats with a ROS scavenger only during first the first few days of IH. These findings indicate that ROS generated during early IH exposure lead to a long‐lasting increase in ROS by LT‐IH by a feed‐forward mechanism involving AOE gene repression by DNA methylation. However, the precise nature of the ROS (hydrogen peroxide, superoxide anion, and hydroxyl radical) responsible for activating DNA methylation by LT‐IH remains to be established.
An intriguing finding of the present study is the demonstration that CBA prevents LT‐IH‐evoked AOE gene repression and DNA methylation in the AM, nTS and RVLM. CB neural activity increases ROS generation in the AM, nTS and RVLM through transcriptional activation of pro‐oxidant enzymes (e.g. NADPH oxidases) by hypoxia‐inducible factor (HIF)‐1 and insufficient transcription of AOE genes (Sod2) by HIF‐2 (Peng et al. 2014). We attribute the absence of LT‐IH‐evoked DNA methylation and AOE gene repression in CBA rats to lack of increased ROS generation. DNA methylation in the CB is likely due to a direct effect of IH, whereas in the nTS, RVLM and AM the effects of IH are indirect and require neural input from the CB. These findings suggest a hitherto uncharacterized role for CB neural activity in activating epigenetic changes such as DNA methylation in the central and efferent limbs of the CB reflex.
How might ROS increase DNA methylation in response to LT‐IH? DNA methylation is catalysed by Dnmt proteins. LT‐IH exposed rats showed increased Dnmt protein expression and enzyme activity. Our previous study showed that post‐translational, rather than transcriptional, mechanisms mediate increased Dnmt protein expression in response to LT‐IH (Nanduri et al. 2017). The following observations demonstrated that ROS‐dependent activation of Akt and the resulting inactivation of GSK3β were required for upregulation of Dnmt1 and Dnmt3b protein expression: (a) LT‐IH led to Akt activation, as indicated by increased phosphorylation at Threonine‐308 and Serine‐473, and this effect was blocked by a ROS scavenger; (b) Akt activation was associated with GSK3β inactivation, as evidenced by Serine‐9 phosphorylation, which was also prevented by a ROS scavenger; and (c) GSK690693, which prevented GSK3β phosphorylation at Serine‐9, blocked Dnmt protein expression and enzyme activity. The inhibition of Dnmt protein expression by GSK690693 was also reflected in the absence of methylation and repression of AOE genes. The signalling mechanisms associated with ROS‐dependent activation of DNA methylation by LT‐IH in the central and efferent limbs of the CB reflex are summarized in Fig. 10.
Figure 10. Schematic representation of signalling mechanisms associated with DNA methylation by LT‐IH.
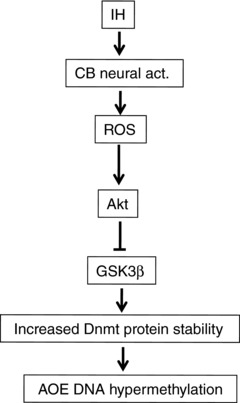
IH, intermittent hypoxia; CB neural act., carotid body neural activity; ROS, reactive oxygen species; Akt, protein kinase B; GSK3β, glycogen synthase kinase 3β; Dnmt, DNA methyltransferase proteins; AOE DNA hypermethylation, DNA methylation status of antioxidant enzyme genes.
Our previous study suggested that DNA methylation is a major molecular mechanism underlying persistent sympathetic activation and hypertension caused by LT‐IH (Nanduri et al. 2017). This conclusion was further supported by the current finding that GSK690693 treatment, which prevented AOE gene methylation, also normalized plasma NA levels and blood pressure in LT‐IH rats. Akt is negatively regulated by the phosphatase PTEN, which has a cysteine residue in its active site that makes it inherently sensitive to ROS (Kwon et al. 2004). Further studies are necessary to determine whether ROS‐dependent inhibition of PTEN contributes to Akt activation by LT‐IH.
Recurrent apnoea with IH is also a major clinical problem in preterm infants. Recent studies suggest that apnoea of prematurity predisposes to autonomic dysfunction in adulthood (Santos & Dean, 2004; Anway et al. 2005; Dolinoy et al. 2007; Nanduri & Prabhakar, 2013). We previously reported that adult rats, which were exposed to IH as neonates, exhibited an exaggerated CB reflex, irregular breathing with apnoeas and hypertension, and these effects were associated with increased DNA methylation of the Sod2 gene (Nanduri et al. 2012). Treating neonatal rats with decitabine, an inhibitor of DNA methylation, during IH exposure prevented oxidative stress and autonomic dysfunction in adult rats. Since IH leads to more pronounced ROS generation in the CB reflex pathway in neonates as compared to adult rats (Pawar et al. 2008; Souvannakitti et al. 2009), it will be of interest in future studies to investigate whether blocking ROS generation prevents neonatal IH‐evoked DNA methylation in the CB reflex pathway and its adverse cardio‐respiratory consequences in adulthood. Besides DNA methylation, epigenetic regulation of gene expression is mediated by histone modifications and microRNAs (Chuang & Jones, 2007; Audia & Campbell, 2016). Whether IH also activates histone modifications and/or microRNAs remains to be studied.
Additional information
Competing interests
None declared.
Author contributions
J.N. and N.R.P. conceived the study and designed research; J.N., Y.‐J.P., N.W., and S.A.K., performed experiments; J.N., Y.‐J.P., N.W., and S.A.K. analysed the data; J.N., G.L.S., and N.R.P. wrote the paper. All authors have approved the final version of the manuscript and agree to be accountable for all aspects of the work. All persons designated as authors qualify for authorship, and all those who qualify for authorship are listed.
Funding
This work was supported by National Institutes of Health grants P01‐HL‐90554.
Edited by: Kim Barrett & Harold Schultz
This is an Editor's Choice article from the 1 August 2018 issue.
References
- Altomare DA, Zhang L, Deng J, Di Cristofano A, Klein‐Szanto AJ, Kumar R & Testa JR (2010). GSK690693 delays tumor onset and progression in genetically defined mouse models expressing activated Akt. Clin Cancer Res 16, 486–496. [DOI] [PMC free article] [PubMed] [Google Scholar]
- Anway MD, Cupp AS, Uzumcu M & Skinner MK (2005). Epigenetic transgenerational actions of endocrine disruptors and male fertility. Science 308, 1466–1469. [DOI] [PMC free article] [PubMed] [Google Scholar]
- Audia JE & Campbell RM (2016). Histone modifications and cancer. Cold Spring Harb Perspect Biol 8, a019521. [DOI] [PMC free article] [PubMed] [Google Scholar]
- Campos AC, Molognoni F, Melo FH, Galdieri LC, Carneiro CR, D'Almeida V, Correa M & Jasiulionis MG (2007). Oxidative stress modulates DNA methylation during melanocyte anchorage blockade associated with malignant transformation. Neoplasia 9, 1111–1121. [DOI] [PMC free article] [PubMed] [Google Scholar]
- Chuang JC & Jones PA (2007). Epigenetics and microRNAs. Pediatr Res 61, 24R–29R. [DOI] [PubMed] [Google Scholar]
- Cistulli P & Sullivan C (1994). Pathophysiology of sleep apnea In Sleep and Breathing, eds Saunders NA. & Sullivan CE, pp. 405–448. Marcel Dekker, New York. [Google Scholar]
- Dempsey JA, Veasey SC, Morgan BJ & O'Donnell CP (2010). Pathophysiology of sleep apnea. Physiol Rev 90, 47–112. [DOI] [PMC free article] [PubMed] [Google Scholar]
- Dolinoy DC, Weidman JR & Jirtle RL (2007). Epigenetic gene regulation: linking early developmental environment to adult disease. Reprod Toxicol 23, 297–307. [DOI] [PubMed] [Google Scholar]
- Dudenbostel T & Calhoun DA (2012). Resistant hypertension, obstructive sleep apnoea and aldosterone. J Hum Hypertens 26, 281–287. [DOI] [PMC free article] [PubMed] [Google Scholar]
- Feinberg AP (2007). Phenotypic plasticity and the epigenetics of human disease. Nature 447, 433–440. [DOI] [PubMed] [Google Scholar]
- Fletcher EC (1995). The relationship between systemic hypertension and obstructive sleep apnea: facts and theory. Am J Med 98, 118–128. [DOI] [PubMed] [Google Scholar]
- Fletcher EC, Lesske J, Culman J, Miller CC & Unger T (1992). Sympathetic denervation blocks blood pressure elevation in episodic hypoxia. Hypertension 20, 612–619. [DOI] [PubMed] [Google Scholar]
- Gardner PR, Nguyen DD & White CW (1996). Superoxide scavenging by Mn(II/III) tetrakis (1‐methyl‐4‐pyridyl) porphyrin in mammalian cells. Arch Biochem Biophys 325, 20–28. [DOI] [PubMed] [Google Scholar]
- Hart JR & Vogt PK (2011). Phosphorylation of AKT: a mutational analysis. Oncotarget 2, 467–476. [DOI] [PMC free article] [PubMed] [Google Scholar]
- Hedner JA, Wilcox I, Laks L, Grunstein RR & Sullivan CE (1992). A specific and potent pressor effect of hypoxia in patients with sleep apnea. Am Rev Respir Dis 146, 1240–1245. [DOI] [PubMed] [Google Scholar]
- Iturriaga R, Del Rio R, Idiaquez J & Somers VK (2016). Carotid body chemoreceptors, sympathetic neural activation, and cardiometabolic disease. Biol Res 49, 13. [DOI] [PMC free article] [PubMed] [Google Scholar]
- Kara T, Narkiewicz K & Somers VK (2003). Chemoreflexes – physiology and clinical implications. Acta Physiol Scand 177, 377–384. [DOI] [PubMed] [Google Scholar]
- Khan SA, Nanduri J, Yuan G, Kinsman B, Kumar GK, Joseph J, Kalyanaraman B & Prabhakar NR (2011). NADPH oxidase 2 mediates intermittent hypoxia‐induced mitochondrial complex I inhibition: relevance to blood pressure changes in rats. Antioxid Redox Signal 14, 533–542. [DOI] [PMC free article] [PubMed] [Google Scholar]
- Kitagishi Y & Matsuda S (2013). Redox regulation of tumor suppressor PTEN in cancer and aging. Int J Mol Med 31, 511–515. [DOI] [PubMed] [Google Scholar]
- Kumar GK, Rai V, Sharma SD, Ramakrishnan DP, Peng YJ, Souvannakitti D & Prabhakar NR (2006). Chronic intermittent hypoxia induces hypoxia‐evoked catecholamine efflux in adult rat adrenal medulla via oxidative stress. J Physiol 575, 229–239. [DOI] [PMC free article] [PubMed] [Google Scholar]
- Kwon J, Lee SR, Yang KS, Ahn Y, Kim YJ, Stadtman ER & Rhee SG (2004). Reversible oxidation and inactivation of the tumor suppressor PTEN in cells stimulated with peptide growth factors. Proc Natl Acad Sci USA 101, 16419–16424. [DOI] [PMC free article] [PubMed] [Google Scholar]
- Lai JC & Clark JB (1979). Preparation of synaptic and nonsynaptic mitochondria from mammalian brain. Methods Enzymol 55, 51–60. [DOI] [PubMed] [Google Scholar]
- Lavie P, Herer P & Hoffstein V (2000). Obstructive sleep apnoea syndrome as a risk factor for hypertension: population study. BMJ 320, 479–482. [DOI] [PMC free article] [PubMed] [Google Scholar]
- Lesske J, Fletcher EC, Bao G & Unger T (1997). Hypertension caused by chronic intermittent hypoxia – influence of chemoreceptors and sympathetic nervous system. J Hypertens 15, 1593–1603. [DOI] [PubMed] [Google Scholar]
- Li C, Ebert PJ & Li QJ (2013). T cell receptor (TCR) and transforming growth factor β (TGF‐β) signaling converge on DNA (cytosine‐5)‐methyltransferase to control forkhead box protein 3 (foxp3) locus methylation and inducible regulatory T cell differentiation. J Biol Chem 288, 19127–19139. [DOI] [PMC free article] [PubMed] [Google Scholar]
- Lin RK, Hsieh YS, Lin P, Hsu HS, Chen CY, Tang YA, Lee CF & Wang YC (2010). The tobacco‐specific carcinogen NNK induces DNA methyltransferase 1 accumulation and tumor suppressor gene hypermethylation in mice and lung cancer patients. J Clin Invest 120, 521–532. [DOI] [PMC free article] [PubMed] [Google Scholar]
- Lin RK & Wang YC (2014). Dysregulated transcriptional and post‐translational control of DNA methyltransferases in cancer. Cell Biosci 4, 46. [DOI] [PMC free article] [PubMed] [Google Scholar]
- Mulgrew AT, Lawati NA, Ayas NT, Fox N, Hamilton P, Cortes L & Ryan CF (2010). Residual sleep apnea on polysomnography after 3 months of CPAP therapy: clinical implications, predictors and patterns. Sleep Med 11, 119–125. [DOI] [PubMed] [Google Scholar]
- Nanduri J, Makarenko V, Reddy VD, Yuan G, Pawar A, Wang N, Khan SA, Zhang X, Kinsman B, Peng YJ, Kumar GK, Fox AP, Godley LA, Semenza GL & Prabhakar NR (2012). Epigenetic regulation of hypoxic sensing disrupts cardiorespiratory homeostasis. Proc Natl Acad Sci USA 109, 2515–2520. [DOI] [PMC free article] [PubMed] [Google Scholar]
- Nanduri J, Peng YJ, Wang N, Khan SA, Semenza GL, Kumar GK & Prabhakar NR (2017). Epigenetic regulation of redox state mediates persistent cardiorespiratory abnormalities after long‐term intermittent hypoxia. J Physiol 595, 63–77. [DOI] [PMC free article] [PubMed] [Google Scholar]
- Nanduri J & Prabhakar NR (2013). Developmental programming of O(2) sensing by neonatal intermittent hypoxia via epigenetic mechanisms. Respir Physiol Neurobiol 185, 105–109. [DOI] [PMC free article] [PubMed] [Google Scholar]
- Nanduri J, Wang N, Yuan G, Khan SA, Souvannakitti D, Peng YJ, Kumar GK, Garcia JA & Prabhakar NR (2009). Intermittent hypoxia degrades HIF‐2alpha via calpains resulting in oxidative stress: implications for recurrent apnea‐induced morbidities. Proc Natl Acad Sci USA 106, 1199–1204. [DOI] [PMC free article] [PubMed] [Google Scholar]
- Narkiewicz K, van de Borne PJ, Pesek CA, Dyken ME, Montano N & Somers VK (1999). Selective potentiation of peripheral chemoreflex sensitivity in obstructive sleep apnea. Circulation 99, 1183–1189. [DOI] [PubMed] [Google Scholar]
- Nieto FJ, Young TB, Lind BK, Shahar E, Samet JM, Redline S, D'Agostino RB, Newman AB, Lebowitz MD & Pickering TG (2000). Association of sleep‐disordered breathing, sleep apnea, and hypertension in a large community‐based study. Sleep Heart Health Study. JAMA 283, 1829–1836. [DOI] [PubMed] [Google Scholar]
- Pawar A, Peng YJ, Jacono FJ & Prabhakar NR (2008). Comparative analysis of neonatal and adult rat carotid body responses to chronic intermittent hypoxia. J Appl Physiol 104, 1287–1294. [DOI] [PMC free article] [PubMed] [Google Scholar]
- Paxinos G & Watson C (2006). The Rat Brain in Stereotaxic Coordinates. 6th edn. Burlington, MA, USA. [DOI] [PubMed] [Google Scholar]
- Peng Y, Yuan G, Overholt JL, Kumar GK & Prabhakar NR (2003a). Systemic and cellular responses to intermittent hypoxia: evidence for oxidative stress and mitochondrial dysfunction. Adv Exp Med Biol 536, 559–564. [DOI] [PubMed] [Google Scholar]
- Peng YJ, Nanduri J, Yuan G, Wang N, Deneris E, Pendyala S, Natarajan V, Kumar GK & Prabhakar NR (2009). NADPH oxidase is required for the sensory plasticity of the carotid body by chronic intermittent hypoxia. J Neurosci 29, 4903–4910. [DOI] [PMC free article] [PubMed] [Google Scholar]
- Peng YJ, Overholt JL, Kline D, Kumar GK & Prabhakar NR (2003b). Induction of sensory long‐term facilitation in the carotid body by intermittent hypoxia: implications for recurrent apneas. Proc Natl Acad Sci USA 100, 10073–10078. [DOI] [PMC free article] [PubMed] [Google Scholar]
- Peng YJ, Yuan G, Khan S, Nanduri J, Makarenko VV, Reddy VD, Vasavda C, Kumar GK, Semenza GL & Prabhakar NR (2014). Regulation of hypoxia‐inducible factor‐α isoforms and redox state by carotid body neural activity in rats. J Physiol 592, 3841–3858. [DOI] [PMC free article] [PubMed] [Google Scholar]
- Peng YJ, Yuan G, Ramakrishnan D, Sharma SD, Bosch‐Marce M, Kumar GK, Semenza GL & Prabhakar NR (2006). Heterozygous HIF‐1alpha deficiency impairs carotid body‐mediated systemic responses and reactive oxygen species generation in mice exposed to intermittent hypoxia. J Physiol 577, 705–716. [DOI] [PMC free article] [PubMed] [Google Scholar]
- Peppard PE, Young T, Barnet JH, Palta M, Hagen EW & Hla KM (2013). Increased prevalence of sleep‐disordered breathing in adults. Am J Epidemiol 177, 1006–1014. [DOI] [PMC free article] [PubMed] [Google Scholar]
- Peppard PE, Young T, Palta M & Skatrud J (2000). Prospective study of the association between sleep‐disordered breathing and hypertension. N Engl J Med 342, 1378–1384. [DOI] [PubMed] [Google Scholar]
- Ramanathan L, Gozal D & Siegel JM (2005). Antioxidant responses to chronic hypoxia in the rat cerebellum and pons. J Neurochem 93, 47–52. [DOI] [PMC free article] [PubMed] [Google Scholar]
- Reddy MK, Patel KP & Schultz HD (2005). Differential role of the paraventricular nucleus of the hypothalamus in modulating the sympathoexcitatory component of peripheral and central chemoreflexes. Am J Physiol Regul Integr Comp Physiol 289, R789–R797. [DOI] [PubMed] [Google Scholar]
- Rhodes N, Heerding DA, Duckett DR, Eberwein DJ, Knick VB, Lansing TJ, McConnell RT, Gilmer TM, Zhang SY, Robell K, Kahana JA, Geske RS, Kleymenova EV, Choudhry AE, Lai Z, Leber JD, Minthorn EA, Strum SL, Wood ER, Huang PS, Copeland RA & Kumar R (2008). Characterization of an Akt kinase inhibitor with potent pharmacodynamic and antitumor activity. Cancer Res 68, 2366–2374. [DOI] [PubMed] [Google Scholar]
- Santos F & Dean W (2004). Epigenetic reprogramming during early development in mammals. Reproduction 127, 643–651. [DOI] [PubMed] [Google Scholar]
- Sharma M, Chuang WW & Sun Z (2002). Phosphatidylinositol 3‐kinase/Akt stimulates androgen pathway through GSK3beta inhibition and nuclear beta‐catenin accumulation. J Biol Chem 277, 30935–30941. [DOI] [PubMed] [Google Scholar]
- Sharma S, Kelly TK & Jones PA (2010). Epigenetics in cancer. Carcinogenesis 31, 27–36. [DOI] [PMC free article] [PubMed] [Google Scholar]
- Souvannakitti D, Kumar GK, Fox A & Prabhakar NR (2009). Neonatal intermittent hypoxia leads to long‐lasting facilitation of acute hypoxia‐evoked catecholamine secretion from rat chromaffin cells. J Neurophysiol 101, 2837–2846. [DOI] [PMC free article] [PubMed] [Google Scholar]
- Taketo MM (2004). Shutting down Wnt signal‐activated cancer. Nat Genet 36, 320–322. [DOI] [PubMed] [Google Scholar]
- Verna A, Roumy M & Leitner LM (1975). Loss of chemoreceptive properties of the rabbit carotid body after destruction of the glomus cells. Brain Res 100, 13–23. [DOI] [PubMed] [Google Scholar]
- Wu Q & Ni X (2015). ROS‐mediated DNA methylation pattern alterations in carcinogenesis. Curr Drug Targets 16, 13–19. [DOI] [PubMed] [Google Scholar]
- Zhan G, Serrano F, Fenik P, Hsu R, Kong L, Pratico D, Klann E & Veasey SC (2005). NADPH oxidase mediates hypersomnolence and brain oxidative injury in a murine model of sleep apnea. Am J Respir Crit Care Med 172, 921–929. [DOI] [PMC free article] [PubMed] [Google Scholar]


