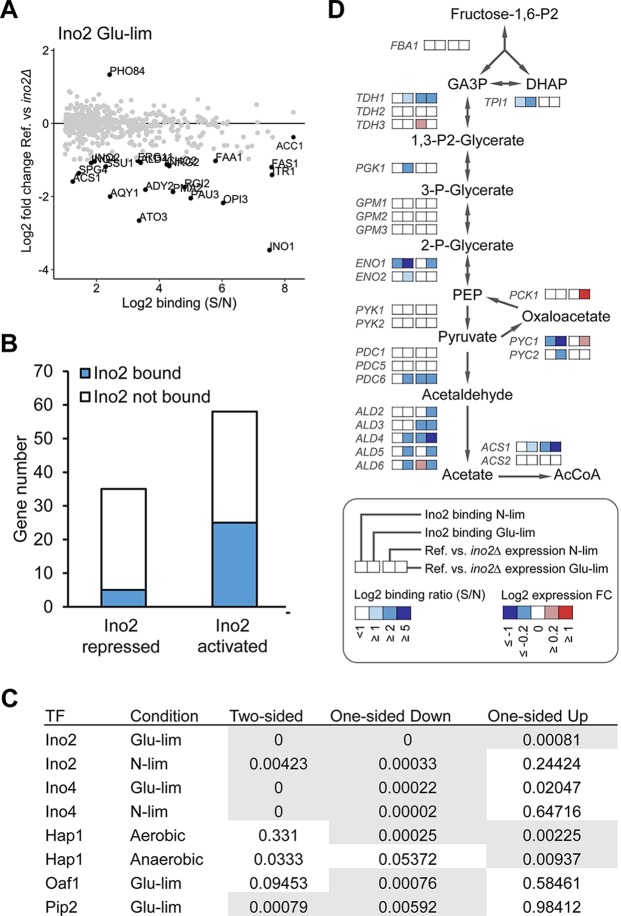
FIG 6 .
Data integration for elucidating the regulatory effect of TFs on their targets. (A) Effect of INO2 deletion on the expression of Ino2-binding targets in Glu-lim chemostat culture. The binding ratio (S/N) of Ino2 determined by ChIP-exo (x axis) and the fold change (FC) in the level of expression in the ino2Δ deletion mutant relative to the level of expression in the reference strain determined by transcriptome analysis (y axis) are shown for each gene. Genes with a |log2(FC)| of >1 are highlighted. (B) Distinguishing direct targets from indirect targets within Ino2-dependent genes in Glu-lim chemostat culture. The Ino2-repressed and -activated targets indicate genes showing significant up- and downregulation (adjusted P value of <0.05), respectively, in the ino2Δ mutant strain relative to the reference strain. (C) P values from the t test of the five TFs under different conditions showed that in a one-sided t test, all TFs had significant (P < 0.01) down- or upregulation of genes that were bound compared to nonbound genes. Test results with a P value of <0.01 are shown on a gray background. References for the transcriptome data: Ino2 and Ino4 (14), Oaf1 and Pip2 (21), and Hap1 (31). (D) Identification of genes encoding components involved in central carbon metabolism as direct targets of Ino2. The binding ratio (S/N) of Ino2 and the fold change in the level of expression in the ino2Δ mutant strain relative to the level of expression in the reference strain in N-lim and Glu-lim chemostat cultures are shown. Abbreviations: Fructose-1,6-P2, Fructose-1,6-bisphosphate; GA3P, glyceraldehyde 3-phosphate; DHAP, dihydroxyacetone phosphate; PEP, phosphoenolpyruvate; AcCoA, acetyl-CoA.

