Abstract
Background:
Evidence suggests that low levels of Vitamin D may adversely affect the cardiovascular (CV) system. Several studies have been done regarding the relation and possible causative role of Vitamin D in CV disorders and its well-known risk factors; however, there are limited studies in this part of the world. The aims were as follows: (1) To study the relation between serum Vitamin D level between nonhypertensive and hypertensive patients. (2) To study the relation of serum Vitamin D levels in patients with isolated systolic hypertension (ISH), isolated diastolic hypertension, systolo-diastolic hypertension, and their comparison vis-à-vis nonhypertensives.
Materials and Methods:
A cross-sectional study was conducted with 154 patients attending medicine outpatient department of a tertiary care hospital of North Bengal from June 2012 to May 2013. The Vitamin D was measured by direct ELISA method. Blood pressure (BP) measurements were done. Statistical analysis was done by using SPSS 16.0 for Windows.
Results:
The Vitamin D level in the hypertensive group was 22.36 ± 12.64; ISH Group was 22.04 ± 14.26; the isolated diastolic hypertension (IDH) Group was 18.82 ± 0.00; and the systolo-diastolic hypertensives (SDH) Group was 22.67 ± 12.51. Then, the mean value of Vitamin D in nonhypertensive Group (27.47 ± 13.43) was significantly (P < 0.05) higher than IDH, SDH, and the hypertensive as a whole groups. The relation with ISH Group also reached near significance (P = 0.074). There was a negative correlation with BP and serum Vitamin D. This remained statistically significant (P = 0.044) for systolic BP (SBP) and near significant (P = 0.075) for mean arterial pressure. In population having serum Vitamin D <30 ng/ml (deficient or insufficient), the negative correlation relationship between SBP and serum Vitamin D remains statistically significant (P = 0.010).
Conclusion:
Among the hypertensives, SDH shows significantly lower levels of serum Vitamin D. The patients with ISH show a trend, though not statistically significant, toward a lower level of Vitamin D compared to the nonhypertensive population.
Keywords: Hypertension, isolated diastolic hypertension, isolated systolic hypertension, mean arterial pressure, systolo-diastolic hypertension, Vitamin D
Introduction
Vitamin D is an essential component of our body. A growing body of evidence suggests that low levels of Vitamin D may adversely affect the cardiovascular (CV) system.[1] Low levels of 25-hydroxyvitamin D (25[OH]D) are associated with many markers of CV disease; for example, hypertension, increased vascular resistance, and increased left ventricular mass index.[2,3,4] In addition, 25(OH)D levels correlate inversely with coronary calcification, an indicator of atherosclerosis, and a precursor of CV events.[5] Deficient or insufficient serum 25(OH)D levels have been documented in patients with myocardial infarction, heart failure, stroke, diabetic CV disease, and peripheral arterial disease.[6,7,8,9,10] Till date, several studies have been done regarding the relation and possible causative role of Vitamin D in CV disorders and its well-known risk factors; however, there are limited studies in this part of the world. Hypertension itself is an independent risk factor for many CV and neurological disorders. In this study, we will find out the relationship between the 25(OH)D level and hypertension in persons attending the medicine outpatient department (OPD) of a tertiary care hospital in North Bengal.
Materials and Methods
This cross-sectional study was conducted at the medicine OPD of a tertiary care hospital of North Bengal from June 2012 to May 2013. The patients aged >40 years with any grade of hypertension and normotension without any clinically apparent cardiac, hepatic, neurologic, or renal disorder were included in the study. Simple active infections were corrected before inclusion. The patients having diabetes mellitus, abnormal renal function, (estimated glomerular filtration rate <60 ml/min/1.73 m2 by Modification of Diet in Renal Disease formula,[11] clinical or laboratory evidence of secondary hypertension, already on Vitamin D supplement and/or steroid therapy, chronic inflammatory conditions, abnormal resting electrocardiography (ECG), abnormal liver function tests (LFTs), abnormal thyroid function, and patients not giving consent for the study were excluded from the study.
A total of 154 patients were selected for the study. Assuming the prevalence of Vitamin D deficiency 50% (P) in n population, the sample size was calculated by applying the formula
n = Zα2 × P × (1 − P)/L2
n = 150
where Zα = 1.96. P = 50%. L = Absolute allowable error (8%).
Considering a 20% attrition rate initially a total of 180 patients were selected by systematic random sampling. Among those attending medicine OPD, every 10th patient was selected as a sample in a specified weekday, every week. Data collection was done from August 2012 to January 2013. Among those selected, 21 were excluded from the study due to calculated GFR <60; three having hypothyroidism, and two did not give consent. Hence, the final number of the sample was 154.
History taking
Age, sex, and religion (Hindu, Muslim, and Others) of the participants were noted as per voter ID card
Dietary pattern was classified as nonvegetarian and vegetarian
Sunlight exposure was quantified as average hours of direct sunlight per day based on direct questioning
Smoking status was defined as smokers and nonsmokers. Smokers Group included current smoker (having regular smoking in the preceding year - any number of bidi, cigarette) and former smoker (quit smoking 1 year back)[12]
Alcohol addiction was defined as patients taking at least one or two standard drink per week. One standard drink[13] equals to 340 mL (12 oz) of beer, 115 mL (4 oz) of nonfortified wine, and 43 mL (1.5 oz) (a shot) of 80 proof beverages such as whisky, gin, or vodka each contain 10–15 g of ethanol and ~ 30–40 ml of Country liquor. Nondrinker was defined to those having never taken a drink or social drinker with lesser frequency than the previously mentioned values
Diabetes was defined as per the American Diabetes Association Guidelines 2011.
Measurements
Blood pressure
Blood pressure (BP) was measured in the sitting position using a mercury sphygmomanometer. Patients were kept seated quietly for at least 5 min in a chair with feet on the floor and arm supported at heart level. Caffeine, exercise, and smoking were avoided for at least 30 min before measurement. An appropriately sized cuff (cuff bladder encircling at least 80 percent of the arm) was used to ensure accuracy. At least, two measurements were taken, and the average was recorded. For manual determinations, palpated radial pulse obliteration pressure was used to estimate systolic BP (SBP)– the cuff was inflated 20–30 mmHg above this level for the auscultatory determinations; the cuff deflation rate for auscultatory readings was 2 mmHg per second. SBP is the point at which the first of two or more Korotkoff sounds was heard (onset of phase 1), and the disappearance of Korotkoff sound (onset of phase 5) was used to define diastolic BP (DBP).
The hypertension categories were defined[14,15] as follows:
Hypertension (overall): SBP of ≥140 mmHg and/or DBP of ≥90 mmHg, or use of antihypertensive drugs, including diuretics.
Isolated systolic hypertension (ISH): When SBP ≥140, DBP <90 mm Hg
Isolated diastolic hypertension (IDH): When SBP <140, DBP ≥90 mmHg
Systolo-diastolic hypertension (SDH): When SBP ≥140 and DBP ≥90 mmHg
Nonhypertensive was defined SBP <140, DBP <90 mmHg
Mean arterial pressure (MAP) was defined as 1/3 SBP + 2/3 DBP.
Height, weight, body mass index, and waist circumference
Body weight (kg) was measured without upper clothes and shoes using a calibrated balance beam scale. Height (cm) was measured using a stadiometer. Body mass index (BMI) was calculated by weight divided by height squared (kg/m2). BMI >18.5 ≤24.9 was considered as normal, BMI ≤18.5 was considered underweight, BMI ≥25 ≤29.9 overweight, BMI ≥30 obesity. Waist circumference (cm) was measured midway between the lower rib margin and the iliac crest following a normal expiration.[16]
Vitamin D
Blood samples were obtained and centrifuged immediately to separate the serum portion. Patients were allowed to have tea and toast, but no dairy products before blood sampling. These samples were analyzed either within 30 min of collection or in case of expected delay, were stored at −40°C for analyzing later on.
For measurement, a competitive ELISA technique with a selected monoclonal antibody recognizing 25(OH)D was used (immundiagnostik 25[OH]D direct ELISA). The intra- and inter-assay coefficients of variation were 10.0% and 8.0%, respectively. The analyses were carried out at the biochemistry laboratory of a tertiary care hospital of North Bengal.
Vitamin D status was categorized as follows [Table 1]:[17]
Table 1.
Vitamin D status definitions[17]

Deficiency (moderate, severe), insufficiency, and sufficient (normal) level.
Other investigations
Other laboratory tests and/or imaging studies were done when indicated to rule out secondary hypertension.
Ultrasonography (USG) of the kidney, ureter, and bladder: To look for kidney size (by Philips HD7 machine)
USG Doppler study of renal artery (as and when necessary)
Fasting blood sugar, postprandial blood sugar, T3 T4, TSH, Na+, K+, creatinine, LFT, ECG.
Statistical analysis of data
The data were entered in Microsoft Office Excel Worksheet and expressed as mean ± standard deviation for continuously distributed variables and in absolute numbers and percentages for discrete variables. Chi-square test was used for testing of significance in case of discrete variables, and independent t-test was used to test continuous variables. Tests for a linear trend were conducted by multivariate linear regression analysis. Statistical analysis was done using SPSS 16.0 for Windows Microsoft corporation 2008. For each test, a 95% confidence interval was used. Results were considered statistically significant if P < 0.05.
Results
The present study included 154 patients. There were 98 male (63.63%) and 56 (36.37%) female patients. The mean age of the participants in this study was 53.45 (±10.661). The mean age of the male participants was 55.73 (±11.156) while that of the female participants was 49.45 (±8.427) [Table 2].
Table 2.
Mean age and standard deviation of the study population

In our study, the prevalence of hypertension was 53.24% in total. For male and female population, the figure was 53.06% and 53.57%, respectively [Table 3].
Table 3.
Distribution of hypertension in the study population according to gender

Correlation analysis [Table 4] between systolic, diastolic, and MAP with serum Vitamin D level shows that there was a negative correlation with BP and Serum Vitamin D though the relation remained statistically significant (P = 0.044) for systolic BP and near significant (P = 0.05–0.09) for MAP.
Table 4.
Correlation analysis of blood pressure with other variables
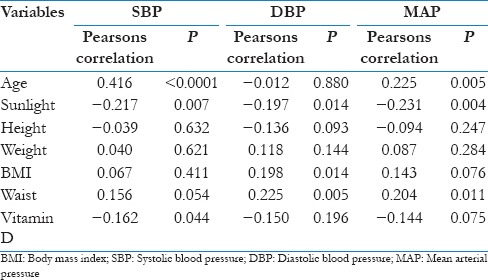
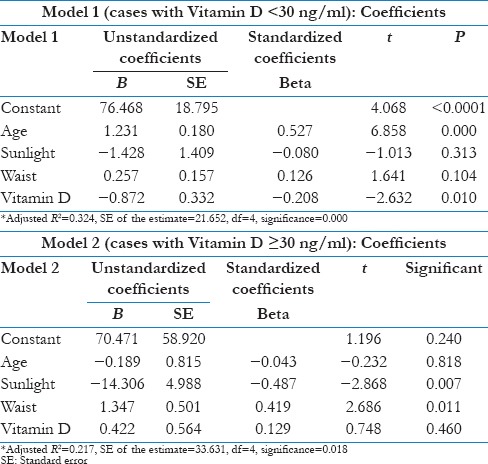
As other covariates such as age, sunlight exposure, and waist circumference were also having a significant correlation with SBP and MAP [Table 4], Multivariate linear regression analysis was performed after adjusting for those variables.
In population having serum Vitamin D < 30 ng/ml (deficient or insufficient), the negative correlation relationship between SBP and serum Vitamin D remains statistically significant (P = 0.010), i.e., Vitamin D had an independent negative impact on SBP [Table 5 and Model 1]. There was no independent impact of Vitamin D on SBP after adjusting for age, sunlight exposure and waist circumference in Vitamin D sufficient population [Table 5 and Model 2].
Table 5.
Multivariate linear regression analysis of systolic blood pressure with Vitamin D and other co-variates
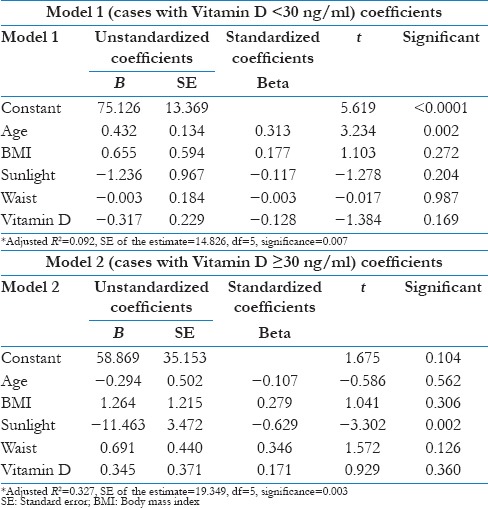
Similarly, the near significant correlation between Vitamin D and MAP became insignificant after adjusting for age, sunlight exposure, waist circumference, and BMI [Table 6].
Table 6.
Multivariate linear regression analysis of mean arterial pressure with Vitamin D and other covariates
In this study, 53.24% population were hypertensives. Among them, 35.36% having ISH, 2.44% having IDH, and 62.20% having SDH [Table 7 and Figure 1]. The Vitamin D level in as a whole hypertensive Group was 22.36 ± 12.64; ISH Group was 22.04 ± 14.26; the IDH Group was 18.82 ± 0.00; the SDH Group was 22.67 ± 12.51. Comparing the serum Vitamin D level of these individual Groups with that of the nonhypertensive Group (27.47 ± 13.43), it showed that the mean value of Vitamin D in nonhypertensive Group (27.47 ± 13.43) was significantly (P < 0.05) higher than IDH, SDH, and the hypertensive as whole groups. The relation with ISH Group also reached near significance (P = 0.074).
Table 7.
Comparison of Vitamin D level between nonhypertensive and isolated systolic, systolo-diastolic, isolated diastolic hypertensive groups
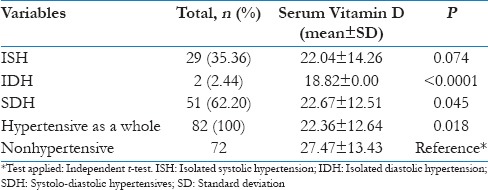
Figure 1.
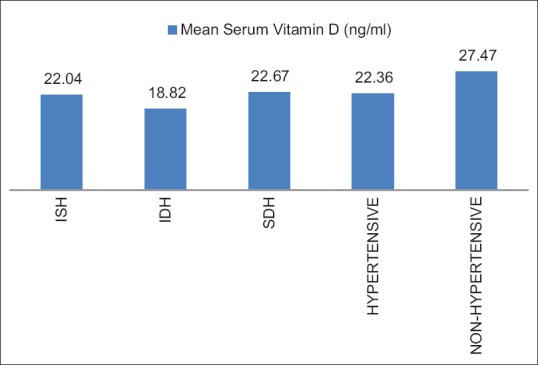
Comparison of Vitamin D level between nonhypertensive and isolated systolic, systolo-diastolic, and isolated diastolic hypertensive groups
Conclusion
In this study, Vitamin D deficiency is significantly prevalent in otherwise healthy middle-aged and elderly population with significant relation with female gender (irrespective of the religion status), vegetarian diet, higher waist circumference, and patients with higher BMI. The association of diabetes with hypertension is significantly related with lower blood level of Vitamin D compared to nondiabetic, normotensive healthy population. Among the hypertensives, SDH shows significantly lower levels of serum Vitamin D. Participants with ISH shows a trend, though not statistically significant, toward a lower level of Vitamin D compared to the nonhypertensive population. The relationship of Vitamin D status with IDH was not much conclusive, in our study, due to a very low patient number.
Financial support and sponsorship
Nil.
Conflicts of interest
There are no conflicts of interest.
References
- 1.Zittermann A, Schleithoff SS, Koerfer R. Putting cardiovascular disease and Vitamin D insufficiency into perspective. Br J Nutr. 2005;94:483–92. doi: 10.1079/bjn20051544. [DOI] [PubMed] [Google Scholar]
- 2.Lind L, Hänni A, Lithell H, Hvarfner A, Sörensen OH, Ljunghall S, et al. Vitamin D is related to blood pressure and other cardiovascular risk factors in middle-aged men. Am J Hypertens. 1995;8:894–901. doi: 10.1016/0895-7061(95)00154-H. [DOI] [PubMed] [Google Scholar]
- 3.Duprez D, De Buyzere M, De Backer T, Clement D. Relationship between Vitamin D and the regional blood flow and vascular resistance in moderate arterial hypertension. J Hypertens Suppl. 1993;11:S304–5. [PubMed] [Google Scholar]
- 4.Holick MF. Vitamin D: Important for prevention of osteoporosis, cardiovascular heart disease, type 1 diabetes, autoimmune diseases, and some cancers. South Med J. 2005;98:1024–7. doi: 10.1097/01.SMJ.0000140865.32054.DB. [DOI] [PubMed] [Google Scholar]
- 5.Watson KE, Abrolat ML, Malone LL, Hoeg JM, Doherty T, Detrano R, et al. Active serum Vitamin D levels are inversely correlated with coronary calcification. Circulation. 1997;96:1755–60. doi: 10.1161/01.cir.96.6.1755. [DOI] [PubMed] [Google Scholar]
- 6.Scragg R, Jackson R, Holdaway IM, Lim T, Beaglehole R. Myocardial infarction is inversely associated with plasma 25-hydroxyvitamin D3 levels: A community-based study. Int J Epidemiol. 1990;19:559–63. doi: 10.1093/ije/19.3.559. [DOI] [PubMed] [Google Scholar]
- 7.Zittermann A. Vitamin D and disease prevention with special reference to cardiovascular disease. Prog Biophys Mol Biol. 2006;92:39–48. doi: 10.1016/j.pbiomolbio.2006.02.001. [DOI] [PubMed] [Google Scholar]
- 8.Poole KE, Loveridge N, Barker PJ, Halsall DJ, Rose C, Reeve J, et al. Reduced Vitamin D in acute stroke. Stroke. 2006;37:243–5. doi: 10.1161/01.STR.0000195184.24297.c1. [DOI] [PubMed] [Google Scholar]
- 9.Cigolini M, Iagulli MP, Miconi V, Galiotto M, Lombardi S, Targher G, et al. Serum 25-hydroxyvitamin D3 concentrations and prevalence of cardiovascular disease among type 2 diabetic patients. Diabetes Care. 2006;29:722–4. doi: 10.2337/diacare.29.03.06.dc05-2148. [DOI] [PubMed] [Google Scholar]
- 10.Melamed ML, Muntner P, Michos ED, Uribarri J, Weber C, Sharma J, et al. Serum 25-hydroxyvitamin D levels and the prevalence of peripheral arterial disease: Results from NHANES 2001 to 2004. Arterioscler Thromb Vasc Biol. 2008;28:1179–85. doi: 10.1161/ATVBAHA.108.165886. [DOI] [PMC free article] [PubMed] [Google Scholar]
- 11. [Last accessed on 2009]. Available from: http://www.kidney.org/professionals/kdoqi/gfr_calculator.cfm .
- 12.Wang TJ, Pencina MJ, Booth SL, Jacques PF, Ingelsson E, Lanier K, et al. Vitamin D deficiency and risk of cardiovascular disease. Circulation. 2008;117:503–11. doi: 10.1161/CIRCULATIONAHA.107.706127. [DOI] [PMC free article] [PubMed] [Google Scholar]
- 13.Schuckit MA. Alcohol and alcoholism. Harrison's Princ Intern Med. 2012;392:3546. [Google Scholar]
- 14.Chobanian AV, Bakris GL, Black HR, Cushman WC, Green LA, Izzo JL, Jr, et al. The seventh report of the joint national committee on prevention, detection, evaluation, and treatment of high blood pressure: The JNC 7 report. JAMA. 2003;289:2560–72. doi: 10.1001/jama.289.19.2560. [DOI] [PubMed] [Google Scholar]
- 15.Franklin SS, Jacobs MJ, Wong ND, L’Italien GJ, Lapuerta P. Predominance of isolated systolic hypertension among middle-aged and elderly US hypertensives: Analysis based on national health and nutrition examination survey (NHANES) III. Hypertension. 2001;37:869–74. doi: 10.1161/01.hyp.37.3.869. [DOI] [PubMed] [Google Scholar]
- 16.Snijder MB, Lips P, Seidell JC, Visser M, Deeg DJ, Dekker JM, et al. Vitamin D status and parathyroid hormone levels in relation to blood pressure: A population-based study in older men and women. J Intern Med. 2007;261:558–65. doi: 10.1111/j.1365-2796.2007.01778.x. [DOI] [PubMed] [Google Scholar]
- 17.Lyerly GW, Sui X, Church TS, Lavie CJ, Hand GA, Blair SN, et al. Maximal exercise electrocardiography responses and coronary heart disease mortality among men with diabetes mellitus. Circulation. 2008;117:2734–42. doi: 10.1161/CIRCULATIONAHA.107.729277. [DOI] [PMC free article] [PubMed] [Google Scholar]


