Abstract
Identification of neural circuit changes contributing to behavioral plasticity has routinely been conducted on candidates that were preselected based on past results. Here we present an unbiased method for identifying experience-triggered circuit-level changes in neuronal ensembles. Using rabies virus monosynaptic tracing we mapped cocaine-induced global input changes onto ventral tegmental area (VTA) neurons. Cocaine increased rabies labeled inputs from the globus pallidus externus (GPe), a basal ganglia nucleus previously not known to participate in behavioral plasticity triggered by drugs of abuse. We demonstrated that cocaine increased GPe neuron activity, which accounted for the increase in GPe labeling. Inhibition of GPe activity revealed its vital role in two different forms of cocaine-triggered behavioral plasticity, at least in part via GPe-mediated disinhibition of VTA dopamine neuron activity. These results suggest that rabies-based unbiased screening of changes in input populations can identify previously unappreciated circuit elements that critically support behavioral adaptations.
Plasticity in neuronal circuits enables animals to adapt to an ever-changing environment. However, the loci and nature of experience-dependent changes in circuit function that drive adaptive and pathological behaviors remain largely unknown. While modern techniques such as optogenetics1 and chemogenetics2 permit sequential screening of targeted elements in circuits with complex input and output patterns, unbiased approaches are necessary to identify new components that play critical roles in the behavioral changes of interest. One such approach uses the expression of immediate early genes to identify the neuronal ensembles activated by a defined experience3,4 but as currently utilized, this approach does not reveal the connectivity of these ensembles. Brain imaging techniques such as fMRI or PET also provide insights into unexpected experience-dependent macroscopic connectivity changes but lack cellular resolution. Thus, there is a need for additional methods that facilitate unbiased identification of circuit substrates of experience-dependent behavioral changes. Here, we present evidence that the rabies virus-based monosynaptic tracing technique facilitates screening of circuit elements that contribute to behavioral changes by allowing whole-brain mapping of monosynaptic inputs5,6 to defined starter neuronal populations and their input/output relationships7–9.
To test the utility of a rabies virus-based approach for screening of behaviorally relevant experience-dependent circuit adaptations, we initially focused on the VTA, a circuit node critical for a variety of experience-dependent behaviors10–12. The diverse array of inputs to and input-output relationships of VTA dopamine (DA) and GABA cells have been extensively elucidated using rabies virus methods5,7. As a robust trigger of experience-dependent plasticity we administered drugs of abuse focusing on cocaine, which elicits long-lasting behavioral adaptations including locomotor sensitization (LMS) and conditioned place preference (CPP). Our unbiased input screen revealed an unexpected critical role for the GPe, which has been implicated in motor control13, habit formation14, and Parkinson’s disease15 but ignored when studying addiction-related behaviors triggered by drugs of abuse. Our findings provide proof of principle for the utility of this approach while implicating the GPe as playing a vital function for the establishment of drug-evoked behavioral plasticity.
Screen for cocaine-induced input changes
Cocaine administration induces modification of synapses on VTA-DA and VTA-GABA neurons16 but the identities of cells providing those inputs are largely unknown. To test whether rabies virus monosynaptic tracing might reveal the identity of inputs altered by cocaine, we first employed the rabies monosynaptic input tracing technique17, where animals were given a single injection of cocaine (15 mg/kg) or saline one day prior to injection of the rabies virus, RVdG (Fig. 1a). Unbiased analysis of the labeled input cells from 22 different brain regions comprising >90% of long-range inputs to VTA-DA neurons revealed that while the global maps were quantitatively similar, labeling proportionally increased or decreased in a small subset of regions in cocaine-treated animals, with inputs from the GPe displaying the largest magnitude proportional change (Fig. 1b).
Figure 1. Cocaine-induced changes to VTA neuron inputs.
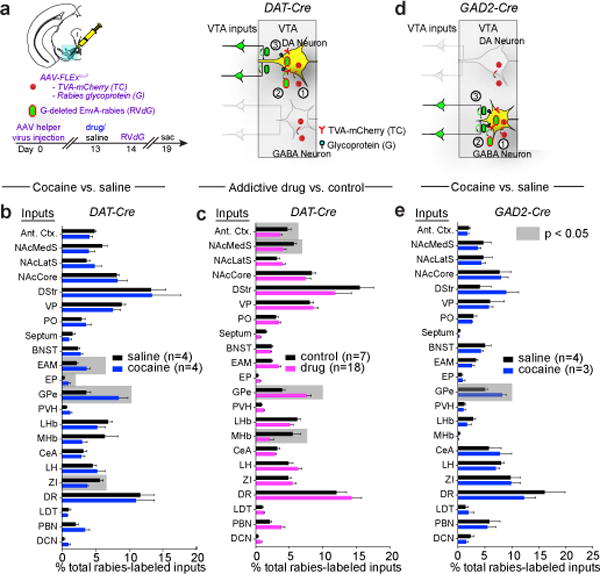
a, Strategy for labeling inputs to VTA-DA neurons. b, Fraction of total GFP+ inputs from each site relative to total quantified inputs. Highlighted regions represent p < 0.05 (p = 0.04, 0.04, 0.02, 0.02 for EAM, EP, GPe, and ZI, respectively). c, Combined data for administration of drug of abuse (n = 4, 5, 5, 4 for cocaine, amphetamine, morphine, and nicotine, respectively) or control (saline, n = 4; fluoxetine, n = 3: p = 0.005, 0.007, 0.05, 0.05 for GPe, MHb, NAcMedS, and Ant. Ctx., respectively). d, e, Strategy (d) and quantification (e) of labeling inputs to ventral midbrain GABA neurons (GPe, p = 0.01). In this and subsequent figures, unless otherwise noted, all statistical analyses used paired t-tests, and error bars represent SEM. See Methods for abbreviations of anatomical terms. The schematics of the mouse brain in this figure were adapted from ref. 33.
To determine if similar labeling changes occurred in response to different classes of abused substances, as occurs with synaptic adaptations onto VTA-DA neurons16, we administered single doses of amphetamine, morphine, nicotine, or the psychoactive but non-addictive substance fluoxetine. The drugs of abuse increased labeling of GPe cells while fluoxetine did not (Fig. 1c, Extended Data Fig. 1a). As previous work using rabies virus revealed that VTA-DA and VTA-GABA neurons receive similar inputs7, we next used the GAD2-Cre mouse driver line to test if cocaine induced similar changes in labeling of cells making monosynaptic contacts onto midbrain GABA neurons in the VTA and the nearby substantia nigra pars reticulata (SNr) (Fig. 1d). Cocaine again elicited a proportional increase in labeling of GPe cells compared to saline injections (Fig. 1e).
Cocaine enhances GPe-PV neuron activity
The four brain regions exhibiting the largest drug-induced change in labeling were the GPe, anterior cortex (Ant. Ctx.), medial habenula (MHb), and nucleus accumbens medial shell (NAcMedS) (Fig. 1c, Extended Data Fig. 1a). While the latter three are sites previously implicated in the behavioral adaptations caused by drugs of abuse11, the potential role of the GPe has not been investigated. What does the increase in rabies virus labeling of GPe inputs onto VTA-DA and GABA cells indicate about the effects of cocaine? To address this question we used parvalbumin (PV)-Cre or PV-Flp mouse driver lines to specifically target GPe-PV cells as the majority of rabies-labeled GPe cells making synapses onto VTA-DA neurons co-stained with PV (305/367; Extended Data Fig. 1b). Visualization of axons of GPe-PV neurons expressing a membrane tagged GFP demonstrated that these cells send major projections to a range of brain regions including the forebrain and thalamus (Extended Data Fig. 2a, b). Consistent with prior work18, the major GPe projection to the midbrain was to the SNr, which contains mostly GABA neurons19, while DA neuron-containing nuclei such as the substantia nigra pars compacta (SNc) or VTA received fewer inputs (Extended Data Fig. 2c, d).
To determine if the cocaine-induced increase in rabies virus labeling of GPe cells reflected an increase in the number of synaptic contacts, we injected AAV-FLExloxP-mGFP-2A-synaptophysin-mRuby, which labels putative presynaptic sites (Fig. 2a), into the GPe of PV-Cre mice and imaged ~1 month later after a cocaine or saline injection (Fig. 2b). The density and volume of these puncta in the SNr were indistinguishable in saline versus cocaine-treated animals (Fig. 2c, d), suggesting no change in synapse number occurred. Next, we assessed potential changes in synapse strength since single doses of drugs of abuse can enhance synaptic strength of both excitatory and inhibitory inputs into the ventral midbrain16. We injected AAV-FLExFRT-ChR2 into the GPe of PV-Flp animals and conducted whole-cell recordings from SNr neurons in acute slices ~1 month later. Calcium in the extracellular recording solution was replaced by strontium to enable measurements of quantal events20 (Fig. 2e, f). No change in the amplitude or frequency of quantal events was observed in slices prepared from cocaine versus saline treated animals (Fig. 2g, h), suggesting cocaine did not elicit a change in the strength of the inhibitory synapses made by GPe-PV neurons on SNr neurons.
Figure 2. Cocaine triggers increase in GPe-PV neuron activity and excitability.
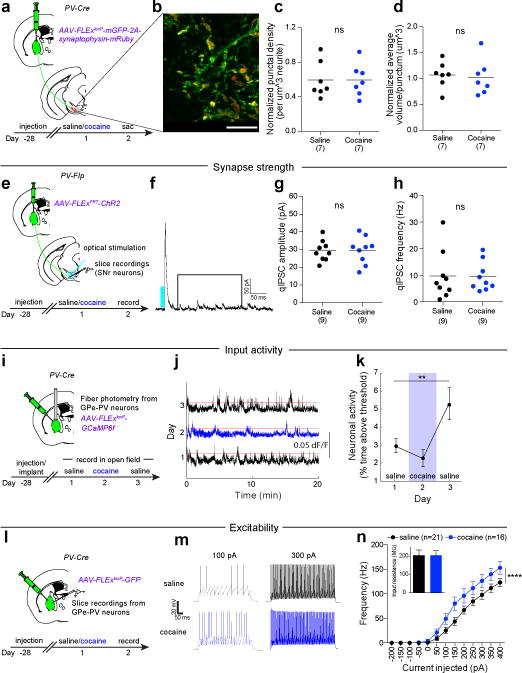
a, AAV-FLExloxP-mGFP-2A-synaptophysin-mRuby was injected in GPe of PV-Cre mice to quantify mRuby+ puncta in SNr. b, mGFP+ neurites and mRuby+ puncta from GPe-PV neurons in SNr (scale = 10 μm). c, d, No change in density (c; p = 0.99) or volume (d; p = 0.76) of mRuby puncta was observed. e, AAV-FLExFRT-ChR2 was injected into GPe of PV-Flp mice, and recordings conducted from SNr-GABA neurons in slices from cocaine or saline-treated animals. f, Trace from SNr neuron highlighting the time window for analysis. g, h, No change in quantal IPSC amplitude (g; p = 0.94) or frequency (h; p = 0.94) was observed. i, AAV-FLExloxP-GCaMP6f was injected into GPe of PV-Cre animals to measure PV neuron activity using fiber photometry. j, Traces showing ΔF/F following the first saline, cocaine, and second saline injections. Red = activity threshold of six times the median absolute deviation. k, Percent time activity surpassed threshold (one-way ANOVA, p = 0.018; post-hoc tests day 1 vs. 2, p = 0.17; day 1 vs. 3, p = 0.0049). l, AAV-FLExloxP-GFP was injected into GPe of PV-Cre mice, and recordings made from GFP+ cells. m, Traces from depolarizing current injections. n, Frequency of action potentials over range of current steps (p < 0.0001 for saline vs. cocaine, two-way ANOVA). For this and all subsequent figures, ns p > 0.05, * p ≤ 0.05, ** p ≤ 0.01, *** p ≤ 0.001, **** p ≤ 0.0001. Dot plots include horizontal line representing mean. The schematics of the mouse brain in this figure were adapted from ref. 33.
Finally, we assessed if GPe-PV neuron spontaneous activity in vivo was altered by cocaine by expressing the fluorescent Ca2+ indicator GCaMP6f in GPe-PV neurons and collecting population Ca2+-dependent signals using fiber photometry (Fig. 2i). While cocaine administration had no significant acute effect, population activity increased two-fold the following day (Fig. 2j, k). To assess if this increase might reflect changes in intrinsic excitability, we injected AAV-FLExloxP-GFP into the GPe of PV-Cre mice and made targeted whole-cell current clamp recordings from acute GPe slices prepared one day after animals received saline or cocaine injections (Fig. 2l). GPe-PV neurons from cocaine-treated animals were more excitable in that more action potentials were generated by depolarizing current injection steps (Fig. 2m, n) with no change in cells’ input resistances (Fig. 2n). These results demonstrate that a single exposure to cocaine triggers increases in the spontaneous activity and excitability of GPe-PV neurons.
Input activity modulates rabies labeling
Are the cocaine-induced changes in rabies virus labeling of GPe-PV input neurons due to the observed changes in their activity? To address this possibility, we expressed transgenes in GPe-PV neurons that permit manipulation of their activity levels while simultaneously performing rabies virus transsynaptic labeling. Chronic activity manipulations bi-directionally influenced the extent of GPe neuronal labeling: chronic inhibition of GPe-PV neuron activity with the inhibitory DREADD hM4Di2 or Kir2.121 decreased rabies virus labeling of GPe neurons compared to control and YFP-expressing animals while the excitatory manipulation using hM3Dq2, on average, increased labeling (Fig. 3d). As a control for these manipulations, we examined labeling in the NAcMedS and found no effect due to expressing any of these transgenes in GPe-PV neurons (Fig. 3e).
Figure 3. Bidirectional modulation of rabies labeling by activity manipulations.
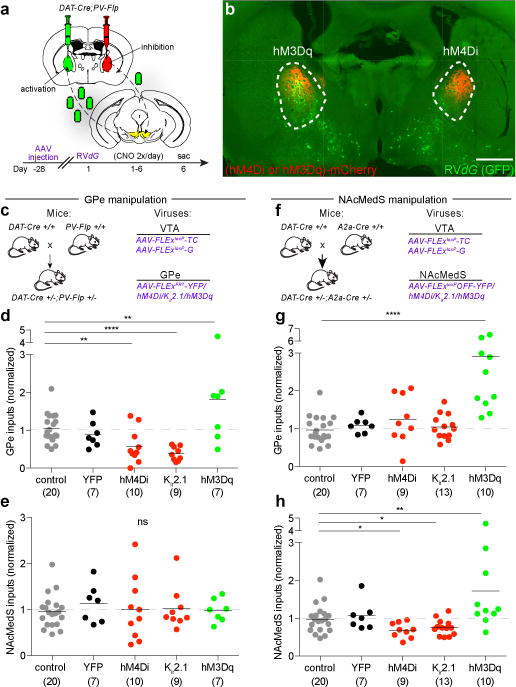
a, A mixture of AAV-FLExloxP-TC and AAV-FLExloxP-G was injected into VTA while an AAV expressing a Flp-dependent YFP, hM4Di, Kir2.1, or hM3Dq was injected into GPe. b, Image of rabies labeling in GPe (scale = 1 mm). c, Experimental strategy for d-e. d, Quantification of labeled inputs in GPe when GPe was manipulated. y-axis = labeled GPe inputs/(NAcLat + NAcCore inputs). Combined controls (uninjected and YFP) were assigned a value of 1. GPe inhibition reduced (hM4Di, p = 0.004; Kir2.1, p < 0.0001) while activation increased (hM3Dq, p = 0.016) labeled inputs. e, Quantification of labeled inputs in NAcMedS following GPe activity manipulations (hM4Di, p = 0.98; Kir2.1, p = 0.90; hM3Dq, p = 0.88). f, Experimental strategy for g-h. g, NAcMedS-D1 inhibition had no effect on labeling of GPe inputs (hM4Di, p = 0.13; Kir2.1, p = 0.65) while activation increased labeling (hM3Dq, p < 0.001). h, NAcMedS-D1 inhibition decreased (hM4Di, p = 0.02; Kir2.1, p = 0.03) while activation increased (hM3Dq, p = 0.007) labeling of NAcMedS inputs. The schematics of the mouse brain in this figure were adapted from ref. 33.
To determine if the effects of chronic activity changes on rabies virus transsynaptic labeling generalized to other brain regions, we performed the same genetic manipulations on NAcMedS-D1 receptor-expressing medium spiny neurons (MSNs), the labeling of which was decreased by drugs of abuse (Fig. 1c; Extended Data Fig. 1a, c). Parallel to the effects of manipulating GPe-PV neurons, chronic NAcMedS inhibition using hM4Di or Kir2.1 reduced labeled inputs in the NAcMedS, while activation with hM3Dq enhanced NAcMedS labeling (Fig. 3h). Unexpectedly, while NAcMedS inhibition did not alter labeling of GPe neurons, NAcMedS activation increased labeled GPe inputs (Fig. 3g), suggesting that NAcMedS-D1 MSN activation indirectly increases GPe activity. Together, these experiments provide evidence that rabies-mediated transsynaptic labeling from starter neurons is influenced by the level of activity in input cell populations. Furthermore, they support the hypothesis that cocaine as well as other drugs of abuse chronically increases the level of GPe-PV neuron activity and this accounts for the observed increase in their labeling by the rabies virus.
Behavioral changes require GPe activity
To determine if the cocaine-elicited changes in GPe-PV neuron activity revealed by rabies virus tracing are functionally relevant and necessary for cocaine-induced behavioral adaptations, we examined if inhibition of GPe-PV neurons influenced two forms of cocaine-induced behavioral plasticity, LMS and CPP. Inhibition of activity in GPe-PV neurons using expression of any one of three different transgenes, hM4Di, Kir2.1, or the tetanus toxin light chain (TeTxLc), which inhibits presynaptic vesicle release22, prevented cocaine-induced LMS (Fig. 4a-c), while having no effect on basal locomotion and only a modest effect on cocaine-induced locomotion upon initial administration (Extended Data Fig. 3). Furthermore, there was a positive correlation between the number of rabies-labeled GPe inputs and the magnitude of LMS in a two-day injection protocol for cocaine as well as other addictive drugs (Extended Data Fig. 4). Similar results were obtained for cocaine-elicited CPP: using a four-day protocol (Fig. 4d), inhibition of GPe-PV activity via expression of hM4Di, Kir2.1, or TeTxLc prevented CPP (Fig. 4e, f). Inhibition of GPe-PV neurons with hM4Di also prevented morphine-induced LMS and CPP (Extended Data Fig. 5), implying that the role of these neurons may generalize to other abused substances.
Figure 4. GPe-PV neuron activity is required for cocaine-induced LMS and CPP.
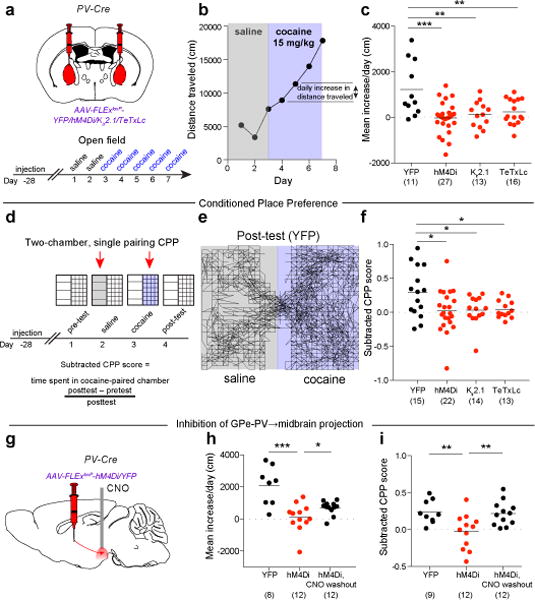
a, Cre-dependent AAVs were injected into GPe of PV-Cre animals. b, Plot of locomotor activity for a single animal. c, GPe-PV inhibition blocked cocaine-induced LMS (hM4Di, p = 0.0002; Kir2.1, p = 0.007; TeTxLc, p = 0.008). d, Procedure to test CPP during GPe-PV inhibition. e, Trace from YFP animal during post-test. f, GPe-PV inhibition prevented CPP (hM4Di, p = 0.019; Kir2.1, p = 0.030; TeTxLc, p = 0.029). g, Slow-release CNO microspheres were injected into ventral midbrain in animals expressing hM4Di or YFP in GPe-PV neurons. h, i, Both LMS (h; p = 0.0005) and CPP (i; p = 0.0094) were blocked in hM4Di-expressing animals. When tested again after CNO washout, these same animals developed LMS (h; p = 0.047) and CPP (i; p = 0.0078). The schematics of the mouse brain in this figure were adapted from ref. 33.
A limitation of these experiments is that GPe-PV neurons project to several different brain regions (Extended Data Fig. 2) and thus the transgene-mediated inhibition of these neurons was not target-specific. To limit expression of an inhibitory transgene specifically to those GPe-PV neurons projecting to the midbrain, we injected a retrogradely-transported CAV-FLExloxP-Flp into the midbrain of PV-Cre mice and a Flp-dependent AAV-FLExFRT-Kir2.1 into the GPe, enabling Kir2.1 expression only in Cre-expressing GPe-PV neurons projecting to the midbrain (Extended Data Fig. 6a). This manipulation prevented both cocaine-elicited LMS and CPP (Extended Data Fig. 6b, c). However, subsequent axon tracing experiments revealed that the GPe-PV neurons projecting to the midbrain collateralize extensively (Extended Data Fig. 7), limiting the interpretation of this experiment. To specifically inhibit the GPe-PV neuron projections within the midbrain, we expressed hM4Di in GPe-PV neurons and infused slow-release CNO microspheres23 into the midbrain (Fig. 4g). This local inhibition was sufficient to block both cocaine-induced LMS (Fig. 4h) and CPP (Fig. 4i). After waiting a week to allow for depletion of CNO, these same animals were re-tested using the same protocols, and expressed significant LMS and CPP (Fig. 4h, i). These results demonstrate that activity in the projection of GPe-PV neurons to the midbrain is necessary for two different forms of cocaine-induced behavioral plasticity.
GPe-PV neurons disinhibit VTA-DA neurons
Does the cocaine-induced increase in activity in inhibitory GPe-PV neurons influence DA cell activity, which is required for induction of LMS and CPP (Extended Data Fig. 8)? Given that the major projection from GPe-PV neurons to the midbrain is into the SNr (Extended Data Fig. 2), a simple hypothesis is that GPe-PV neurons strongly inhibit SNr neurons that tonically inhibit DA neurons. Thus, activation of GPe-PV neurons would increase DA neuron activity via disinhibition despite some direct synaptic inhibition of DA cells. We tested this hypothesis in several ways. First, to examine the functional strength of GPe-PV neuron connections to midbrain DA and GABA neurons, we injected a Flp-dependent AAV expressing channelrhodopsin (AAV-FLExFRT-ChR2) into the GPe of either DAT-Cre;PV-Flp or GAD2-Cre;PV-Flp double transgenic animals, AAV-FLExloxP-GFP into the VTA to label DA or GABA neurons (Fig. 5a), and retrobeads into either the NAcMedS or nucleus accumbens lateral shell (NAcLatS) to demarcate one of two VTA-DA subpopulations whose inputs are modified by cocaine24. We then assayed monosynaptic inhibitory postsynaptic currents (IPSCs) via whole-cell recordings in acute slices. Optical stimulation of GPe-PV neuron axons evoked large IPSCs in the majority (63%, n=24) of SNr-GABA neurons (Fig. 5b-c). In the same sets of slices using the same optical stimulation, the connectivity onto VTA neurons was much smaller (5-14%) as was the size of the IPSCs in cells in which they could be detected (Fig. 5b, c, Extended Data Fig. 9). These results demonstrate that functionally, GPe-PV neurons exhibit much stronger inhibitory connections onto SNr-GABA neurons than VTA-DA or VTA-GABA neurons and thus the GPe-PV synapses in the VTA appear to be of limited functional importance.
Figure 5. GPe-PV neurons disinhibit VTA-DA neurons.
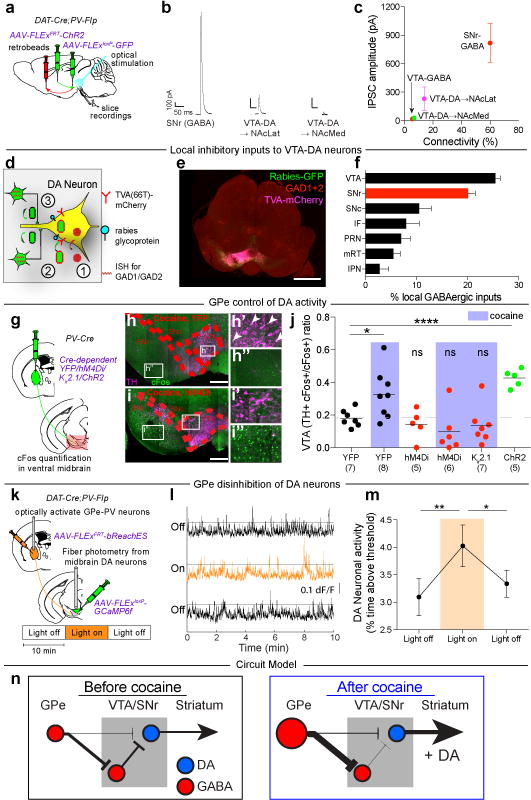
a, AAV-FLExFRT-ChR2 was injected into GPe, AAV-FLExloxP-GFP injected in VTA, and retrobeads injected into NAcLatS or NAcMedS of DAT-Cre;PV-Flp or GAD2-Cre;PV-Flp mice. Whole-cell recordings were made from identified midbrain neurons in acute slices. b, Example light-evoked IPSCs. c, Quantification of percent connectivity and IPSC amplitude for each cell type. d, AAV-FLExloxP-TC66T and AAV-FLExloxP-G were injected into VTA of DAT-Cre mice, followed two weeks later by RVdG. e, Sample labeling of midbrain section (scale = 1 mm). f, Quantification of labeled local inhibitory inputs. g, Cre-dependent AAVs expressing YFP, hM4Di, Kir2.1, or ChR2 were injected into GPe of PV-Cre mice followed by quantification of Fos labeling. h, i, Sections of ventral midbrain showing Fos labeling (green) and tyrosine hydroxylase (TH) labeling (magenta) in animals receiving cocaine injections and expressing YFP (h) or hM4Di (i) in GPe. Arrows indicate Fos+ neurons co-expressing TH (scale = 200 μm). j, Quantification of activated DA neurons (Fos+ TH+) relative to all activated ventral midbrain neurons (Fos+) (cocaine-YFP, p = 0.029; ChR2, p < 0.0001). k, Flp-dependent bReachES was injected in GPe and a Cre-dependent GCaMP6f was injected in VTA of DAT-Cre;PV-Flp mice. l, Fiber photometry traces during consecutive 10 min epochs. m, VTA-DA neurons were more active during light-on than light-off (one-way ANOVA, p = 0.014; post-hoc tests 0-10 vs. 10-20 min, p = 0.008; 10-20 vs. 20-30 min, p = 0.039). n, Proposed circuit diagram before and after cocaine. Size of cell body and arrows represent activity strength. The schematics of the mouse brain in this figure were adapted from ref. 33.
Second, we tested if manipulating activity in SNr-GABA neurons could impact the development of LMS and CPP. Activating SNr-GABA neurons via hM3Dq prevented the development of LMS and CPP (Extended Data Fig. 10a-c) while concurrently inhibiting SNr-GABA neurons via hM4Di during chronic GPe-PV neuron inhibition rescued cocaine-mediated behavioral plasticity (Extended Data Fig. 10d-f). These results suggest that GPe-PV neuron inhibition prevents LMS and CPP by enhancing activity of SNr-GABA neurons.
Third, we examined if SNr-GABA neurons provide direct inhibition to DA neurons using a modified rabies virus input tracing strategy25 to label local inputs onto DA neurons and combining this with in-situ hybridization for GAD1/2 mRNA (Fig. 5d, e). Quantitatively, SNr-GABA neurons were the second-largest source of inhibitory inputs to DA neurons (Fig. 5f).
Fourth, we tested if changes in GPe-PV neuron activity influenced integrated VTA-DA neuron activity using Fos labeling. In YFP-expressing animals, acute cocaine administration caused a clear increase in Fos+ DA neurons compared to saline injected animals measured 90 minutes after injection (Fig. 5j). Inhibition of GPe-PV neurons with hM4Di had no effect in saline treated animals but completely prevented the increase in cocaine treated animals, as did expression of Kir2.1 (Fig. 5j). Conversely, activation of GPe-PV neurons via ChR2 increased Fos expression in DA cells to a degree similar to that elicited by cocaine (Fig. 5j).
Finally, to directly test the effect of activating GPe-PV neurons on VTA-DA neuron activity in vivo, we injected a Flp-dependent red-shifted opsin bReachES26 in the GPe and a Cre-dependent GCaMP6f in the VTA of DAT-Cre;PV-Flp double transgenic mice and recorded population activity from VTA-DA neurons with fiber photometry while optically activating GPe-PV neurons (Fig. 5k). Stimulation of GPe-PV neurons caused a small but significant increase of GCaMP6f fluorescence in VTA-DA neurons (Fig. 5l-m). Taken together, these results indicate that GPe-PV neurons control VTA-DA neuron activity through a disynaptic disinhibition via SNr-GABA neurons (Fig. 5n).
Concluding remarks
Connecting specific experience-dependent circuit changes with corresponding behavioral adaptations has been hampered by a lack of suitable methodology. While most investigations of circuit function rely on a candidate approach leveraging the advantages of cell-type specific manipulations, a limitation is the requirement of a priori assumptions regarding the roles of targeted populations. Given the complexity of circuit mechanisms mediating animal behaviors, unbiased approaches offer advantages for identifying the array of specific neuroplastic changes that drive behavioral changes. Here, we demonstrate that neural activity influences the extent of labeling by the rabies monosynaptic input-tracing method. This property enabled identification of circuit elements that were modified by experience in a behaviorally relevant manner. Specifically, the activity-dependence of rabies labeling enabled the identification of an underappreciated circuit node, the GPe, as a central player in cocaine-induced behavioral adaptations. As a core component of the dorsal striatal indirect pathway implicated in motor control13 and associated disorders15,27, the GPe had not previously been directly linked to addictive behaviors. Using a number of different assays, we demonstrated that the effect of enhanced GPe input to the midbrain is increased VTA-DA neuron activity via a mechanism of disinhibition (Fig. 5n). These findings provide a novel circuit mechanism for influencing VTA-DA neuron activity, the critical role of which in drug-induced behavioral adaptations11,28 we confirmed (Extended Data Fig. 8). Given that the rabies virus transsynaptic technique has been used successfully to map inputs onto cell populations in many brain areas5–9,29–32, we anticipate that this method will be generalizable and complementary to other circuit analysis methods1, 2 for elucidating how activity changes in connected ensembles orchestrate features of complex behaviors.
Methods
No statistical methods were used to predetermine sample size. Experiments described in Figures 1, 2a-h and 2l-n, 3, 5g-j and Extended Data Figs. 1a, 4, 5, 6, 8, and 10 were randomized and investigators were blinded to allocation and outcome assessments; all other experiments were not randomized and investigators were not blinded.
Mice and Viral Procedures
Generation and characterization of the DAT-Cre34, GAD2-Cre35, PV-Cre36, PV-Flp37, A2a-Cre38, and D1-tdtomato39 mouse lines have been described previously. Mice were housed on a 12-hour light/dark cycle with food and water ad libitum. Males and females from a mixed CD1 and C57/BL6 background were used for all experiments in approximately equal proportions. All surgeries were done under isoflurane anesthesia. All procedures complied with the animal care standards set forth by the National Institute of Health and were approved by Stanford University’s Administrative Panel on Laboratory Animal Care and Administrative Panel of Biosafety.
pAAV-CAG-FLExloxP-G, pAAV-CAG-FLExloxP-TC, pAAV-CAG-FLExloxP-TC66T, pAAV-CAG-FLExFRT-G, pAAV-CAG-FLExFRT-TC, and pCAV-FLExloxP-Flp were constructed as reported previously8. For construction of viruses containing Kirr2.1-2A-GFP, hM4Di-mCherry, and hM3Dq-mCherry, pAAV-hSyn1-FLExloxP-mGFP-2A-synaptophysin-mRuby9 or pAAV-hSyn1-FLExFRT-mGFP-2A-synaptophysin-mRuby7 were used as templates. All inserts were cloned into the AscI and SalI sites between the loxP or FRT sites. hM3Dq-mCherry or hM4Di-mCherry were PCR-amplified from pAAV-hSyn-DIO-hM3Dq-mCherry or pAAV-hSyn-DIO-hM4Di-mCherry, respectively40, and Kir2.1-2A-GFP was modified from Xue et al.41. AAV-CMV-FLExloxP-GFP-2A-TeTxLc, AAV-hSyn-FLExloxP-ChR2(H134R)-eYFP, AAV-hSyn-FLExloxP-eYFP, and AAV-hSyn-FLExFRT-eYFP were purchased from the Stanford Gene and Viral Vector Core.
Transsynaptic tracing
Transsynaptic tracing studies were carried out as previously described7, with minor modifications. For rabies tracing, 100 nL of a 1:1 volume mixture of AAV-CAG-FLExloxP-TC and AAV-CAG-FLExloxP-G was injected into the VTA of 4-6 week-old mice. Thirteen days later, a single dose of cocaine (15 mg/kg), amphetamine (10 mg/kg), nicotine (0.5 mg/kg), morphine (10 mg/kg), fluoxetine (10 mg/kg), or saline was injected intraperitoneally (IP), and the mouse was placed in a new cage for thirty minutes before being returned to its home cage. The following day, RVdG was injected into the VTA. After recovery, mice were housed in a BSL2 facility for 5 days to allow for rabies spread and GFP expression. P values presented in Fig. 1 were not corrected for multiple comparisons.
For identification of local GABAergic inputs to VTA-DA neurons, 100 nL of a 1:1 volume mixture of AAV-CAG-FLExloxP-TC66T and AAV-CAG-FLExloxP-G was injected into the VTA of 4-6 week-old mice. Two weeks later, RVdG was injected into the VTA, and animals were sacrificed five days later. For in-situ hybridization, midbrain sections were stained with probes for Gad1 and Gad26, and imaged on a Zeiss LSM780 microscope at 20× magnification. Imaging, histology, and whole-brain quantification were performed as previously described7. In Fig. 5f, the VTA included the parabrachial pigmented area (PBP) and paranigral nucleus (PN). Data were averaged from three animals.
Coordinates used were (relative to Bregma, midline, or dorsal brain surface and in mm):
VTA: AP −3.20, ML 0.4, DV −4.2
NAcLat: AP +1.45, ML 1.75, DV −4.0
NAcMed: AP +1.55, ML 0.7, DV −4.0
GPe: AP −0.35, ML 1.75, DV −3.5
SNr (midbrain): AP −3.2, ML 1.1, DV −4.5
Abbreviations for brain regions made throughout the paper are listed below, in alphabetical order.
Ant. Ctx., anterior cortex
BNST, bed nucleus of the stria terminalis
CeA, central amygdala
DCN, deep cerebellar nuclei
DMStr, dorsomedial striatum
DLStr, dorsolateral striatum
DR, dorsal raphe
DStr, dorsal striatum
EAM, extended amygdala
EP, entopeduncular nucleus
GPe, globus pallidus externus
IF, interfascicular nucleus
IPN, interpeduncular nucleus
LDT, laterodorsal tegmentum
LH, lateral hypothalamus
LHb, lateral habenula
MHb, medial habenula
mPFC, medial prefrontal cortex
mRT, midbrain reticular nucleus
NAcCore, nucleus accumbens core
NAcMedS, nucleus accumbens medial shell
NAcLatS, nucleus accumbens lateral shell
PBN, parabrachial nucleus
PO, preoptic nucleus
PRN, pontine reticular nucleus
PVH, paraventricular hypothalamus
SNc, substantia nigra pars compacta
SNr, substantia nigra pars reticulata
STN, subthalamic nucleus
VP, ventral pallidum
VTA, ventral tegmental area
ZI, zona incerta
The titers of viruses, based on quantitative PCR analysis, were as follows:
AAV-CAG-FLExloxP-TC, serotype 5, 2.4 × 10¹³ genome copies (gc)/mL;
AAV-CAG-FLExloxP-G, serotype 8, 1.0 × 10¹² gc/mL;
AAV-CAG-FLExFRT-TC, serotype 5, 2.6 × 10¹² gc/mL;
AAV-CAG-FLExFRT-G, serotype 8, 1.3 × 10¹² gc/mL;
AAV-CAG-FLExloxP-TC66T, serotype 2, 1.0 × 10¹² gc/mL;
AAV-hSyn-FLExloxP-mGFP-2A-synaptophysin-mRuby, serotype DJ, 9.3 × 10¹² gc/mL;
AAV-hSyn-FLExloxP-hM3Dq-mCherry, serotype DJ, 4.0 × 10¹²gc/mL;
AAV-hSyn-FLExloxP-hM4Di-mCherry, serotype DJ, 5.5 × 10¹² gc/mL;
AAV-hSyn-FLExloxP-Kir2.1-T2A-GFP, serotype DJ, 5.6 × 10¹³ gc/mL;
AAV-CMV-FLExloxP-eGFP-2A-TeTxLc, serotype DJ, 2.1 × 10¹² gc/mL;
AAV-hSyn-FLExloxP-ChR2(H134R)-YFP, serotype DJ, 1.4 × 10¹³ gc/mL;
AAV-hSyn-FLExloxP-YFP, serotype DJ, 1.5 × 10¹³ gc/mL;
AAV-EF1α-FLExloxP-GCaMP6f, serotype 5, 1.9 × 10¹³ gc/mL;
AAV-hSyn-FLExFRT-mGFP-2A-synaptophysin-mRuby, serotype DJ, 3.7 × 10¹² gc/mL;
AAV-hSyn-FLExFRT-hM4Di-mCherry, serotype DJ, 2.9 × 10¹³ gc/mL;
AAV-hSyn-FLExFRT-hM3Dq-mCherry, serotype DJ, 4.6 × 10¹³ gc/mL;
AAV-hSyn-FLExFRT-Kir2.1-T2A-GFP, serotype DJ, 7.2 × 10¹³ gc/mL;
AAV-hSyn-FLExFRT-ChR2(H134R)-YFP, serotype DJ, 5.2 × 10¹² gc/mL;
AAV-hSyn-FLExFRT-YFP, serotype DJ, 4.3 × 10¹² gc/mL;
AAV-EF1α-FLExFRT-bReachES-mCherry, serotype 5, 2.5 × 10¹³ gc/mL;
AAV-hSyn-FLExOFFloxP-hM4Di-mCherry, serotype DJ, 1.1 × 10¹³ gc/mL;
AAV-hSyn-FLExOFFloxP-hM3Dq-mCherry, serotype DJ, 1.2 × 10¹³ gc/mL;
AAV-hSyn-FLExOFFloxP-Kir2.1-T2A-GFP, serotype DJ, 7.8 × 10¹² gc/mL;
AAV-hSyn-FLExOFFloxP-YFP, serotype DJ, 1.4 × 10¹³ gc/mL;
CAV-FLExloxP-Flp, 5.0 × 10¹² gc/mL;
RVdG, 5.0 × 10⁸ colony forming units (cfu)/mL (both GFP and mCherry)
Rabies input tracing + targeted input activity manipulations
For tracing inputs from VTA-DA neurons while manipulating input regions, we used either DAT-Cre;PV-Flp double heterozygotes (for GPe manipulations) or DAT-Cre;A2a-Cre double heterozygotes (for NAcMedS manipulations) between 4-6 weeks of age.
To manipulate GPe-PV neurons, in DAT-Cre;PV-Flp mice, 100 nL of a 1:1 volume mixture of AAV-CAG-FLExloxP-TC and AAV-CAG-FLExloxP-G was injected into the VTA of both hemispheres, and 300 nL of AAV-FLExFRT-hM4Di, AAV-FLExFRT-hM3Dq, AAV-FLExFRT-Kir2.1, or AAV-FLExFRT-YFP was injected into the GPe. Both hemispheres were used for each animal, and counted independently. AAV-FLExFRT-hM4Di and AAV-FLExFRT-hM3Dq were injected into the same animals, as were AAV-FLExFRT-Kir2.1 and AAV-FLExFRT-YFP. One month later, RVdG was injected bilaterally into the VTA. To activate DREADDs, animals were injected once every 12 hours with CNO for five days beginning immediately after RVdG injection.
To manipulate NAcMedS-D1 neurons, in DAT-Cre;A2a-Cre mice, 100 nL of a 1:1 volume mixture of AAV-FLExloxP-TC and AAV-FLExloxP-G was injected into the VTA of both hemispheres, and 300 nL of either AAV- FLExOFFloxP-hM4Di, AAV- FLExOFFloxP-hM3Dq, AAV- FLExOFFloxP-Kir2.1, or AAV-FLExOFFloxP-YFP was injected into the NAcMedS. Both hemispheres were used for each animal, and counted independently. AAV-FLExOFFloxP-hM4Di and AAV-FLExOFFloxP-hM3Dq were injected into the same animals, as were AAV-FLExOFFloxP-Kir2.1 and AAV-FLExOFFloxP-YFP. One month later, RVdG was injected bilaterally into the VTA.
For both GPe and NAcMedS manipulations, in animals injected with hM4Di-mCherry or hM3Dq-mCherry, an RVdG that expressed GFP was used; if the AAV expressed GFP or YFP, RVdG expressing mCherry was used.
Due to the large sample sizes of the experiments involving targeted input activity manipulations, only inputs from the GPe and NAc were quantified. Inputs from the NAcCore and NAcLatS were used for normalization because the percentage of total rabies-labeled inputs from these regions was relatively invariant, regardless if injections were located more medially or laterally in the VTA7, or if a drug of abuse had been injected (Fig. 1, Extended Data Fig. 1a).
Rabies input tracing with two-day LMS procedure
To examine the relationship between rabies-labeled inputs in the GPe and the locomotor sensitization to cocaine injections using a two-dose procedure, in DAT-Cre mice, 100 nL of a 1:1 volume mixture of AAV-FLExloxP-TC and AAV-FLExloxP-G was injected into the VTA. On days 1-2, mice received IP injections of saline and were habituated to an open field chamber equipped with infrared lasers for motion tracking. On day 3, animals were injected with one of the following: cocaine (15 mg/kg), amphetamine (1 mg/kg), nicotine (0.5 mg/kg), or morphine (10 mg/kg) and placed in the same open field chamber. On day 4, RVdG was injected into the VTA. On day 9, animals were injected with the same dose of the same drug they had received on day 3, and their locomotion was tracked in the open field. Animals were sacrificed immediately thereafter. The rabies-labeled inputs in the GPe were quantified, and normalized to the sum of inputs from the NAcLat and NAcCore.
Axon projection quantification
Images were obtained and quantified as previously described7, except that three sections were used for each region and were averaged to obtain the final value. Four brains were used for each experiment.
Synaptic puncta quantification
Methods for synaptic puncta quantification were adapted from Mosca and Luo42 for use in mice. To quantify the volume and density of mRuby-labeled puncta from GPe-PV neuron termini in the SNr, 300 nL of AAV-FLExloxP-mGFP-2A-synaptophysin-mRuby was injected into the GPe of PV-Cre mice, and sections were cut at a thickness of 60 μm. Floating sections were stained using anti-mCherry and anti-GFP antibodies. Sections were imaged on a Zeiss 510 confocal microscope using a 63× objective, with image stacks containing 30 sections at 0.44 μm intervals using 2× averaging and 2× optical zoom. Three images were taken of puncta in the SNr as well as in the STN for each brain. Images were analyzed using Imaris (Bitplane). The surface function was used to obtain the volume of mGFP+ neurites and mRuby-positive puncta, while the spots function was used to estimate the number of mRuby puncta. Data from the three slices from the SNr and STN were averaged for each brain. Measurements from the SNr were normalized to those from the STN.
Quantification of Fos immunostaining
To quantify integrated neural activity, Cre-dependent AAVs expressing YFP, hM4Di, ChR2, or Kir2.1 were injected into the GPe of PV-Cre mice and relative activation of VTA-DA neurons was measured by the ratio of Fos+ neurons in the ventral midbrain that co-stained with tyrosine hydroxylase (TH) to all Fos+ neurons in the ventral midbrain (Fig. 5g-i). Animals were sacrificed 90 minutes after the final stimulus (optical stimulation at 20 Hz for thirty minutes in ChR2-expressing animals, or cocaine/saline injection). When cocaine or saline was injected in animals expressing hM4Di, CNO was injected thirty minutes prior to cocaine or saline injection. Animals were transcardially perfused, and brains sectioned on a vibratome in PBS. Sections were blocked with 10% normal donkey serum (NDS) and 2% BSA/0.5% triton-X100 in PBS (PBST), then stained with TH and Fos antibodies, in 1% NDS in PBST at 4 degrees for four nights. Sections were rinsed three times for 30 minutes each at room temperature, followed by secondary antibody stain in 1% NDS in PBST at 4 degrees for two nights. Sections were then rinsed three times for 30 minutes each, and mounted on slides. The midbrain from three representative VTA-containing sections were then imaged on a Zeiss LSM 780 confocal microscope at 20× magnification, and the results averaged together for each brain. For activation of GPe neurons for Fos immunostaining, 300 nL of AAV-FLExloxP-ChR2 was injected bilaterally into the GPe of PV-Cre mice, and 200 μm, 0.39NA optical fibers were implanted over the VTA. For stimulation, the optical fiber was connected to a 473 nm laser diode (OEM Laser systems) through an FC/PC adaptor. Laser output was controlled using a Master-8 pulse stimulation, which delivered 5 ms light pulses at 20 Hz. Light output through the optical fibers was adjusted to 20 mW using a digital power meter console. Images were taken with a constant exposure time. Cells with a visually identifiable nuclear label by eye were considered Fos+.
Immunohistochemistry
The following primary antibodies were used: Rat anti-mCherry, Life Sciences, 1:2000; chicken anti-GFP, Aves Labs, 1:1000; rabbit anti-TH, Millipore, 1:1000; Goat anti-Fos, Santa Cruz, 1:500. The following secondary antibodies were used from Jackson ImmunoResearch at a concentration of 1:250: donkey anti-chicken AlexaFluor488; donkey anti-goat AlexaFluor488; donkey anti-rat AlexaFluor555; donkey anti-goat AlexaFluor555; donkey anti-rabbit AlexaFluor647.
Fiber photometry
To assess cocaine-induced changes in neuronal activity in vivo, fiber photometry was used43. 750nL of AAV-FLExloxP-GCaMP6f was injected into the GPe of PV-Cre mice, and a 400 μm diameter, 0.48NA optical fiber (Doric Lenses) was implanted at the same location. To test the effect of GPe-PV neuron stimulation on VTA-DA neuron activity, 300 nL of AAV-FLExFRT-bReachES was injected into the GPe, and 750 nL of AAV-FLExloxP-GCaMP6f was injected into the VTA of DAT-Cre;PV-Flp mice. A 400 μm diameter, 0.48NA optical fiber was implanted over the VTA, and a 200 μm, 0.39NA fiber (made in-house) was implanted over the GPe. Implants were secured to the skull with metal screws (Antrin Miniature Specialists), Metabond (Parkell), and Geristore dental epoxy (DenMat). Mice were allowed to recover for at least 4 weeks prior to experiments.
Fiber photometry recordings were made using previously described equipment9. Briefly, 405 nm and 470 nm excitation light was used to excite GCaMP6f at its isosbestic and calcium-dependent wavelengths to obtain both a control and calcium signal in the same animal, respectively. To activate bReachES-expressing GPe-PV neurons, a 594 nm laser was controlled by a Master-8 pulse stimulation (A.M.P.I) that delivered 5 ms pulses at 40 Hz. Light output through the optical fibers was adjusted to 10 mW using a digital power meter console (Thorlabs). Light was manually switched on at 10 minutes and off at 20 minutes.
All data analysis was performed in MATLAB. Signals were first motion corrected by subtracting the least squares best fit of the control trace to the calcium signal. Data points containing large motion artifacts were then manually removed. To assess neural activity, the median absolute deviation (MAD) was calculated across the entire photometry trace during a given session. We conservatively defined a threshold of 6*MAD to assess bouts of high neural activity. During each session, we calculated the percentage of time that the photometry trace was greater than or equal to 6*MAD of the entire trace. For Fig. 2i-k n = 11, and Fig. 5k-m n = 9.
Whole-cell recordings
Mice were deeply anaesthetized with isoflurane, and coronal midbrain or GPe slices (250 μm) were prepared after intracardial perfusion with ice-cold artificial cerebrospinal fluid (ACSF) containing (in mM): 230 sucrose, 10 glucose, 25 NaHCO3, 2.5 KCl, 1.2 NaH2PO4, 0.5 CaCl2, 7 MgCl2, and oxygenated with 95% O2/5% CO2. After 60 min of recovery, slices were transferred to a recording chamber and perfused continuously at 2–4 ml/min with oxygenated ACSF containing (in mM): 120 NaCl, 10 glucose, 25 NaHCO3, 2.5 KCl, 1.2 NaH2PO4, 2.5 CaCl2, 2.3 MgCl2 at 30 °C. Patch pipettes (3.8-4.4 MΩ) were pulled from borosilicate glass (G150TF-4; Warner Instruments) and filled with internal solution containing (in mM): 131 CsCH3SO3, 10 HEPES, 10 glucose, 2 CaCl2, 10 EGTA, 5 MgATP, 0.4 NaGTP, 10 phosphocreatine, 5 QX314, and 0.2% biocytin (pH 7.3, 292 mOsm) for voltage clamp recordings. For analysis of GPe excitability, the internal solution contained (in mM): 130 KMeSO3, 9 KCl, 0.1 EGTA, 10 HEPES, 4 Mg-ATP, 0.4 Na-GTP, 7.5 Na2phosphocreatine, adjusted to pH 7.3 with KOH, 290-295 mOsm. Input resistance and access resistance were monitored continuously throughout each experiment; experiments were terminated if these changed by >20%.
Labeled neurons were visualized with a 40× water-immersion objective on an upright fluorescent microscope (BX51WI; Olympus) equipped with infrared-differential interference contrast video microscopy and epifluorescence (Olympus). ChR2 was stimulated by flashing 473-nm light (2 ms pulses, 0.1 Hz, 10 mW) through the light path of the microscope using an ultrahigh-powered light-emitting diode (LED) powered by an LED driver (Thorlabs) under computer control. The light intensity of the LED was not changed during the experiments. A dual lamp house adaptor (Olympus) was used to switch between the fluorescence lamp and LED light source.
For monosynaptic connectivity analysis, D-APV (50 μM) and NBQX (10 μM) were added to block NMDA receptors and AMPA receptors, respectively, and tetrodotoxin (TTX, 1 μM), a voltage-gated sodium channel antagonist, and 4-aminopyridine (4-AP, 1mM), a potassium channel antagonist, were added to isolate monosynaptic connections44. The IPSC amplitude plotted in Fig. 5c only included cells with detectable optically-evoked IPSCs.
For analysis of quantal size and frequency from GPe inputs to SNr neurons, we replaced calcium in the ACSF with 4 mM SrCl2 to induce asynchronous vesicle release. The amplitude and frequency of events occurring between 50 ms and 250 ms after the blue light pulse were recorded. The amplitude of each event was measured from a local baseline established 5-10 ms before the light pulse. All electrophysiology data were collected using Axograph software.
Behavioral assays of locomotor sensitization (LMS) and conditioned place preference (CPP)
To test the necessity of GPe-PV neuron activity for the development of LMS or CPP, 300 nL of AAV-FLExloxP-hM4Di, AAV-FLExloxP-Kir2.1, AAV- FLExloxP-TeTxLc, or AAV-FLExloxP-YFP was injected bilaterally into the GPe of PV-Cre animals.
To assay for drug-induced CPP, animals were first tested in a single drug pairing, two-chamber CPP test. Each chamber was given either a clear, textured or black, smooth floor. On the first day, animals were initially placed into the right chamber, and allowed to freely explore both chambers for thirty minutes (pre-test). The second day, animals were saline-conditioned to the left side, and the following day, cocaine (or morphine)-conditioned to the right side. Drug conditioning on the black, smooth or clear, textured floor was counter-balanced across the mice. On the fourth day, animals were again initially placed into the right chamber, and allowed to explore freely (post-test). For animals injected with CNO, 10 mg/kg CNO was injected thirty minutes before the beginning of the cocaine and saline pairings.
The following week, to test LMS, animals were habituated to open field boxes equipped with motion tracking for two days (receiving saline injections before each session). Animals were then injected with cocaine (or morphine) immediately before entry into the open-field boxes, for five consecutive days, for 30 minutes each. For animals injected with CNO, CNO was injected thirty minutes before the beginning of each session. In Extended Data Fig. 5, both YFP and hM4Di-expressing animals were given CNO 30 minutes prior to morphine injection.
To inhibit GPe-PV→midbrain neurons, 500 nL of CAV2-FLExloxP-Flp was injected into the SNr, and 300 nL of AAV-FLExFRT-Kir2.1 was injected into the GPe of PV-Cre mice. All injections were bilateral. Animals were tested 2 weeks later.
To inhibit GPe-PV terminals in the midbrain, animals were injected with 300 nL of AAV-FLExloxP-YFP or AAV-FLExloxP-hM4Di in the GPe, and a bilateral cannula guide (C235G, 26GA, C/C distance 1.8 mm, 5 mm pedestal, cut 3.5 mm below pedestal, custom specified for mouse bilateral VTA coordinates, Plastics One) was implanted over the VTA (coordinates AP −3.5, ML 0.9, DV −3.13). 2 skull screws were implanted for headcap stability, and headcaps were sealed with Metabond and Geristore. CNO microspheres were synthesized to enable slow release of CNO after a single infusion. Degradex PLGA CNO microspheres were custom ordered from Phosphorex (Hopkinton, MA). Beads of target mean diameter = 1 μm were dissolved in 0.5% trehalose at a concentration of 5 mg microsphere/mL. The estimated CNO loading efficiency was 5%, the estimated burst release was 50%, and the estimated release time was 7 days. The target concentration of CNO release at a steady state was 100pg/hr23, 45.
On day 1 of the behavioral protocols, animals were given an IP saline injection. On day 2, one hour prior to locomotor testing, all cannula guides were pierced with a dummy infuser (C235I, 33GA, project 1.5 MM past guide), and mice were given an IP saline injection one hour later. On day 3, CNO microspheres were infused one hour prior to locomotor testing, 250 nL per side at 250 nL/min, and mice were given an IP saline injection one hour later and tested for effects on basal locomotion. On days 3-6 (starting the same afternoon), animals were run through the CPP protocol and the LMS protocol on days 6-10. We then waited a week for CNO washout, and repeated the standard CPP and LMS procedures without subsequent infusions in hM4Di-expressing animals.
For manipulations of SNr-GABA neurons, 500 nL of AAV-FLExloxP-hM3Dq was injected bilaterally into the SNr of GAD2-Cre mice, or 500 nL of AAV-FLExloxP-hM4Di was injected into the SNr and 300 nL of AAV-FLExFRT-Kir2.1 was injected into the GPe of GAD2-Cre;PV-Flp animals. All injections were bilateral.
Data analyses and statistics
All statistics were calculated using GraphPad Prism 7 software. Statistical significance was assessed by paired t-tests with the exception of Fig. 2n, where a two-way ANOVA was used, and Fig. 2k and 5m where a one-way ANOVA was used with the Geisser-Greenhouse correction followed by post-hoc Wilcoxon matched-pairs signed rank tests. Dot plots presented throughout the manuscript include a horizontal line representing the mean value for each group. In Fig. 1 and Extended Data Fig. 1, the length of each bar represents the mean. Error bars represent SEM throughout. For all figures, ns p > 0.05, * p ≤ 0.05, ** p ≤ 0.01, *** p ≤ 0.001, **** p ≤ 0.0001.
Data availability
Numerical data for each figure is included with the manuscript as source data. All other data will be available from the authors upon reasonable request.
Extended Data
Extended Data Figure 1. Changes to VTA-DA inputs induced by drugs of abuse.
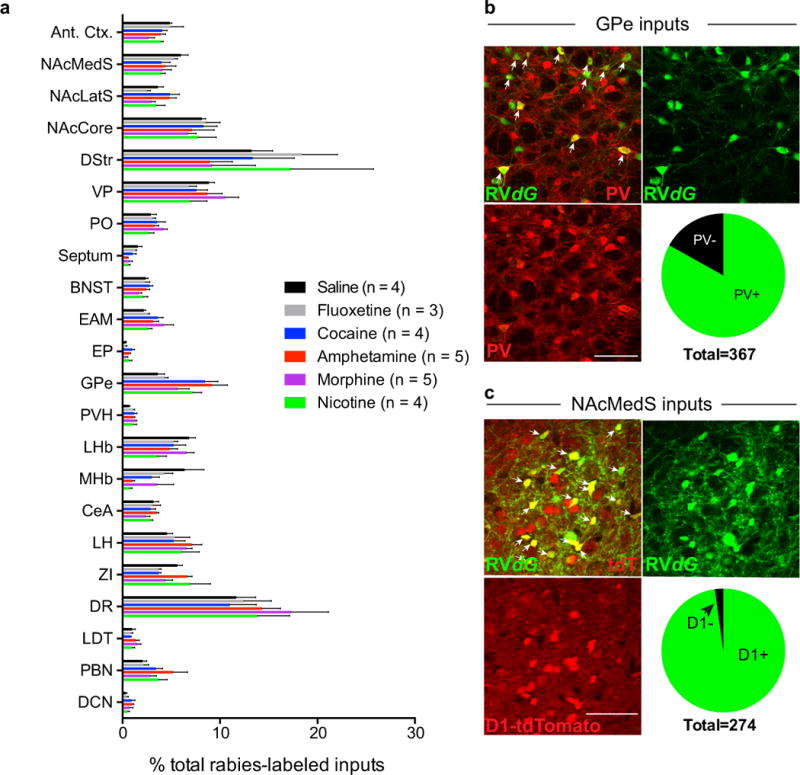
a, Quantification of monosynaptic inputs to VTA-DA neurons labeled in animals receiving single dose administration of either cocaine, amphetamine, nicotine, morphine, saline, or fluoxetine one day prior to injection of RVdG into the VTA. Data were combined to generate Fig. 1c. b, Sample images of GPe neurons labeled by RVdG and co-stained for PV. Pie graph shows proportion of labeled cells that co-stained for PV. c, Sample images of NAcMedS neurons labeled by RVdG in DAT-Cre;D1-tdTomato mice. Pie graph shows proportion of labeled cells that were D1+ as defined by presence of tdTomato (scale bars = 50 μm).
Extended Data Figure 2. Axonal projections of GPe-PV neurons.
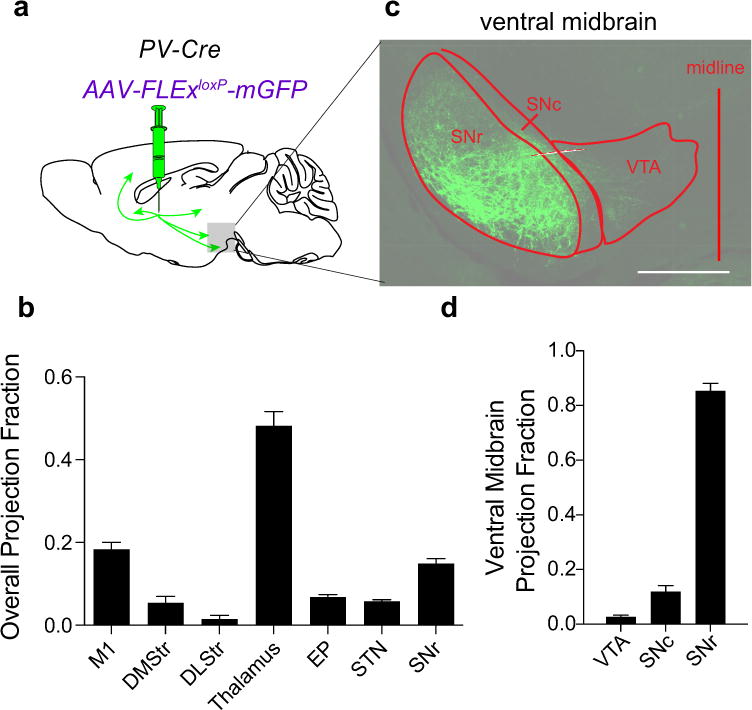
a, AAV-FLExloxP-mGFP was injected into the GPe of PV-Cre animals, and mGFP+ axons were quantified throughout the brain. b, Quantification of fraction of mGFP+ axons in the indicated brain regions. c, Sample image of mGFP+ axons in the ventral midbrain (scale bar = 500 μm). d, Quantification of fraction of mGFP+ axons in the indicated ventral midbrain brain regions. The schematics of the mouse brain in this figure were adapted from ref. 33.
Extended Data Figure 3. Inhibition of GPe-PV neuron activity modestly affects cocaine-induced locomotion.
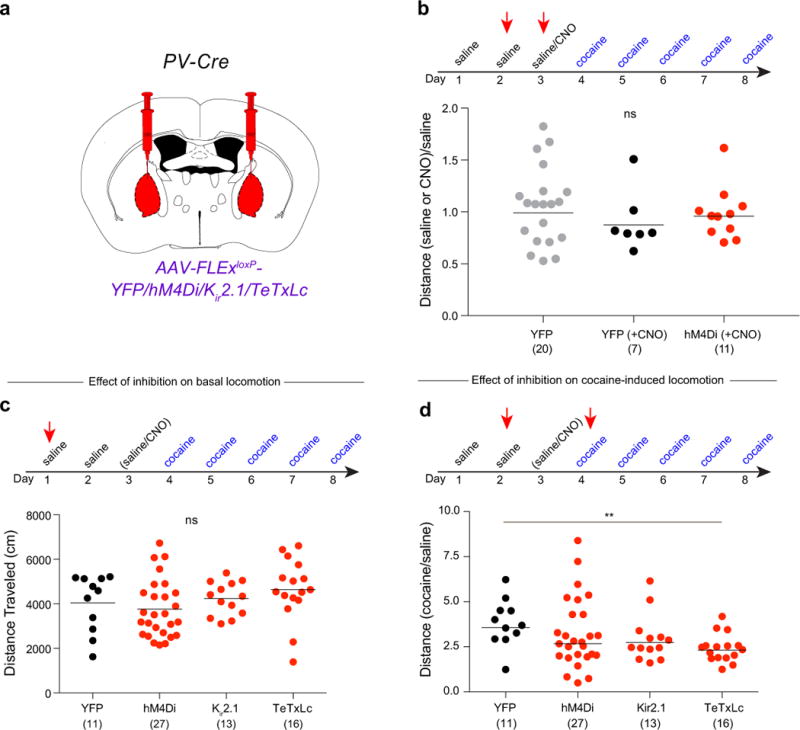
a, Cre-dependent AAVs expressing YFP, hM4Di, Kir2.1, or TeTxLc were injected into the GPe of PV-Cre animals. b, Quantification of effects of CNO on basal locomotion in animals expressing YFP or hM4Di (compared to YFP + saline: YFP + CNO, p = 0.36; hM4Di + CNO, p = 0.59). c, Quantification of basal locomotion during GPe-PV neuron inhibition (hM4Di, p = 0.54; Kir2.1, p = 0.66; TeTxLc, p = 0.27). d, Quantification of cocaine-induced locomotion during GPe-PV neuron inhibition (hM4Di, p = 0.37; Kir2.1, p = 0.12; TeTxLc, p = 0.002). The schematics of the mouse brain in this figure were adapted from ref. 33.
Extended Data Figure 4. Labeled GPe inputs to the VTA correlated with LMS.
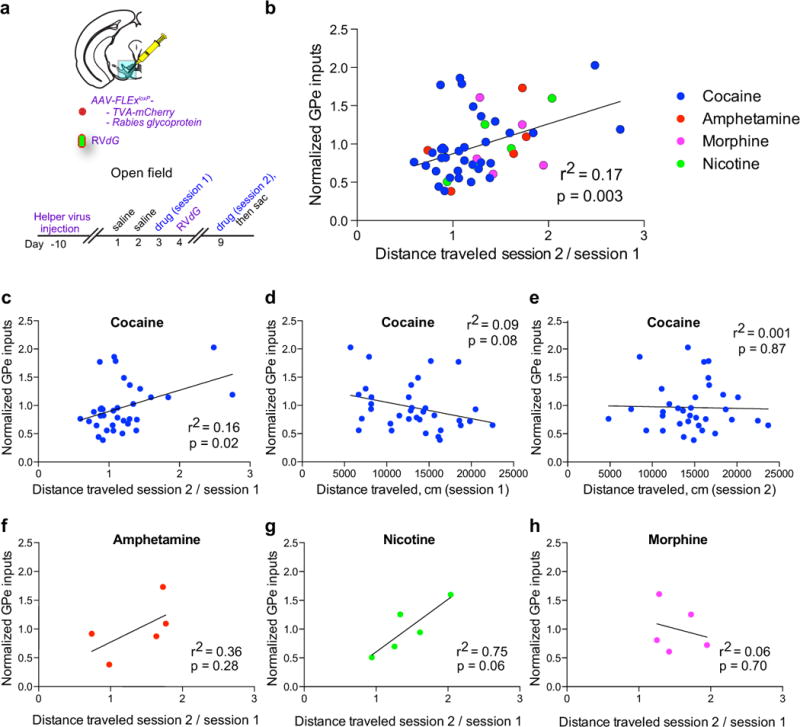
a, AAV-FLExloxP-TC and AAV-FLExloxP-G were injected into the VTA of DAT-Cre mice. Eleven days later, animals were habituated for two days to an open field chamber, and given a drug injection the following day. RVdG was injected one day after the drug. Five days after RVdG injection, the animal was given a second injection of the same drug in the open field. b, Normalized labeled GPe inputs plotted against the relative locomotion in session 2 vs. session 1 for cocaine (n = 34), amphetamine (n = 5), nicotine (n = 5), and morphine (n = 5). Regression line is plotted for all drugs combined. c-e, Labeled GPe inputs after a single dose of cocaine significantly correlated with LMS (c), but not total locomotion after the first (d) or second (e) dose of cocaine. f-h, Plots of labeled GPe inputs vs. LMS for (f) amphetamine (1 mg/kg), (g) nicotine (0.5 mg/kg), or (h) morphine (10 mg/kg). The schematics of the mouse brain in this figure were adapted from ref. 33.
Extended Data Figure 5. Inhibition of the GPe prevents morphine LMS and CPP.
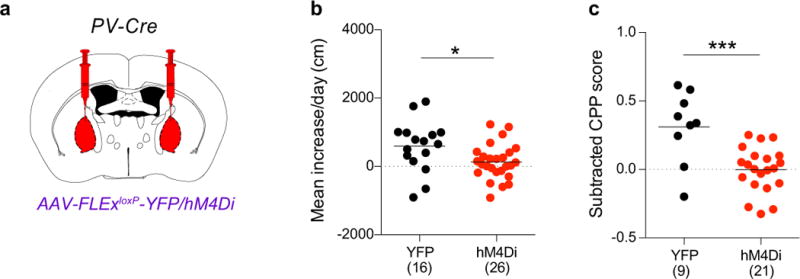
a, A Cre-dependent AAV expressing either YFP or hM4Di was injected into the GPe of PV-Cre animals. b, c, Quantification of LMS (b; p = 0.022) and CPP (c; p = 0.0005) in animals in which YFP or hM4Di (activated by CNO) were expressed in GPe-PV neurons. The schematics of the mouse brain in this figure were adapted from ref. 33.
Extended Data Figure 6. Inhibition of GPe-PV→midbrain projection neurons blocks cocaine CPP and LMS.
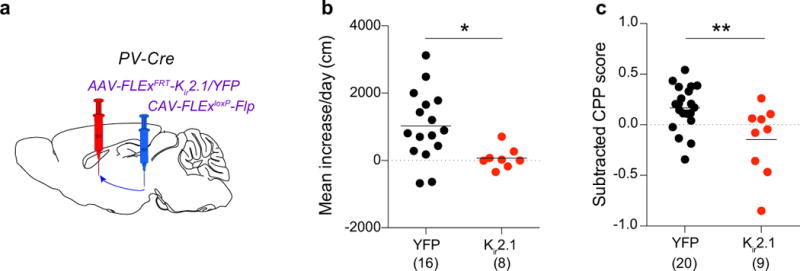
a, CAV-FLExloxP-Flp was injected into the ventral midbrain, and AAV-FLExFRT-Kir2.1 or AAV-FLExFRT-YFP was injected into the GPe of PV-Cre mice. b, c, Quantification of LMS (b; p = 0.019) and CPP (c; p = 0.0067) in animals in which YFP or Kir2.1 were expressed in GPe-PV neurons projecting to the ventral midbrain. The schematics of the mouse brain in this figure were adapted from ref. 33.
Extended Data Figure 7. GPe-PV→midbrain neurons collateralize to multiple subcortical targets.

a, CAV-FLExloxP-Flp was injected into the ventral midbrain, and AAV-FLExFRT-mGFP was injected into in the GPe of PV-Cre mice. b, Representative image of mGFP+ collaterals in the thalamus and subthalamic nucleus (STN) (scale bar = 500 μm). c, Quantification of projection fraction of collaterals to indicated target regions. The schematics of the mouse brain in this figure were adapted from ref. 33.
Extended Data Figure 8. DA neuron activity is required for the development of LMS and CPP.
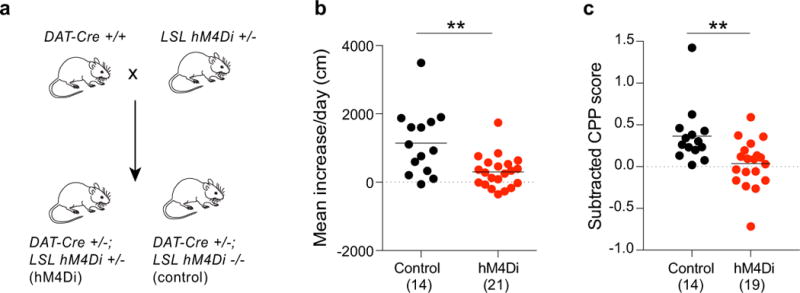
a, Breeding scheme for experiments. LSL = loxP stop loxP. b, c, Quantification of LMS (b; p = 0.001) and CPP (c; p = 0.005) in control animals or animals expressing hM4Di in DA neurons receiving CNO.
Extended Data Figure 9. Map of anatomical location of ventral midbrain cells from which whole cell recordings were made.
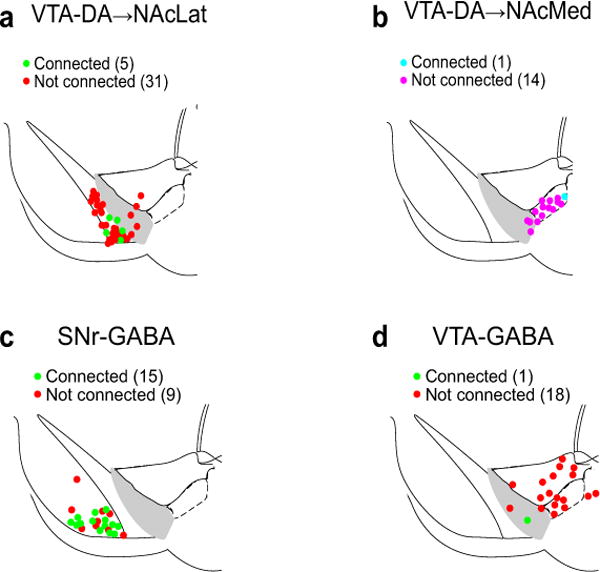
Individual dots indicate location of cells in which ChR2-evoked IPSCs due to ChR2 expression in GPe-PV neurons could be detected (connected) or not (not connected) in NAcLat-projecting (a) or NAcMed-projecting (b) VTA-DA neurons, and SNr-GABA (c) or VTA-GABA (d) cells. The schematics of the mouse brain in this figure were adapted from ref. 33.
Extended Data Figure 10. GPe-PV neurons mediate their effects through SNr-GABA neurons.
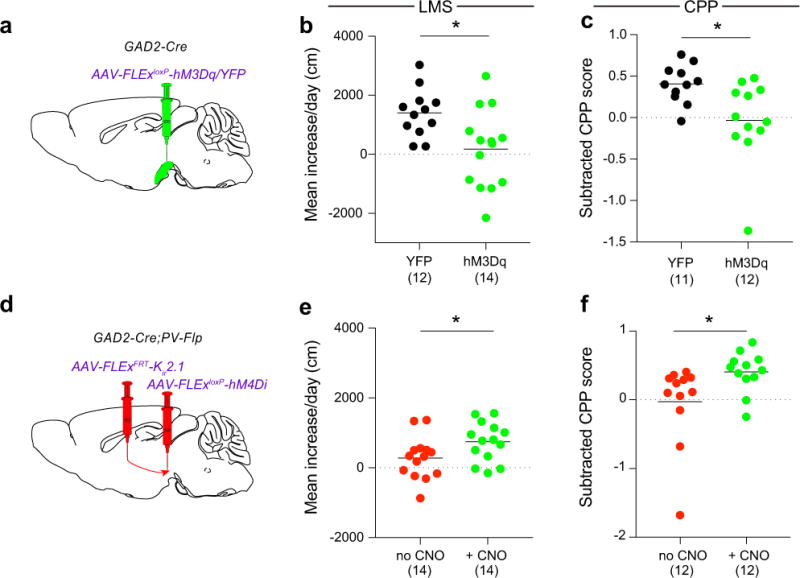
a, Procedure to test LMS and CPP during SNr-GABA activation. b, c, Activating SNr-GABA neurons with CNO prevented LMS (b; p = 0.010) and CPP (c; p = 0.015). d, Injection strategy to test if SNr-GABA neurons are downstream of GPe-PV neurons. e, f, While expression of Kir2.1 in GPe-PV neurons prevented LMS and CPP, this suppression was overcome by concurrent inhibition of SNr-GABA neurons (e; p = 0.035, f; p = 0.036). The schematics of the mouse brain in this figure were adapted from ref. 33.
Supplementary Material
Acknowledgments
This study was supported by grants from HHMI (Hughes Collaborative Innovation Award), NIH (R01-NS50835, TR01-MH099647, F32 DA038913 and K99 DA041445), and the Stanford Neurosciences Institute.
Footnotes
Author Contributions:
K.T.B. performed the majority of experiments and data analysis. C.K.K. assisted with fiber photometry experiments and data analysis with support from K.D., P.H. assisted with electrophysiological recordings and data analysis, L.W.H. performed surgeries for ChR2 stimulation and Fos counting, B.D.H. assisted with terminal inhibition experiments, and T.J.M. assisted with assay design for puncta quantification. K.E.D. and S.N. provided technical support. K.T.B., L.L., and R.C.M. designed the experiments, interpreted the results and wrote the paper that was edited by all authors.
Author Information:
R.C.M. and K.D. are on the scientific advisory board of Circuit Therapeutics, Inc., a biotech dedicated to drug development for brain disorders. All other authors declare no competing financial interests.
References Cited
- 1.Boyden ES, Zhang F, Bamberg E, Nagel G, Deisseroth K. Millisecond-timescale, genetically targeted optical control of neural activity. Nat Neurosci. 2005;8:1263–1268. doi: 10.1038/nn1525. [DOI] [PubMed] [Google Scholar]
- 2.Armbruster BN, Li X, Pausch MH, Herlitze S, Roth BL. Evolving the lock to fit the key to create a family of G protein-coupled receptors potently activated by an inert ligand. Proc Natl Acad Sci U S A. 2007;104:5163–5168. doi: 10.1073/pnas.0700293104. [DOI] [PMC free article] [PubMed] [Google Scholar]
- 3.Lin D, et al. Functional identification of an aggression locus in the mouse hypothalamus. Nature. 2011;470:221–226. doi: 10.1038/nature09736. [DOI] [PMC free article] [PubMed] [Google Scholar]
- 4.Ye L, et al. Wiring and molecular features of prefrontal ensembles representing distinct experiences. Cell. 2016;165:1776–1788. doi: 10.1016/j.cell.2016.05.010. [DOI] [PMC free article] [PubMed] [Google Scholar]
- 5.Watabe-Uchida M, Zhu L, Ogawa SK, Vamanrao A, Uchida N. Whole-brain mapping of direct inputs to midbrain dopamine neurons. Neuron. 2012;74:858–873. doi: 10.1016/j.neuron.2012.03.017. [DOI] [PubMed] [Google Scholar]
- 6.Weissbourd B, et al. Presynaptic partners of dorsal raphe serotonergic and GABAergic neurons. Neuron. 2014;83:645–662. doi: 10.1016/j.neuron.2014.06.024. [DOI] [PMC free article] [PubMed] [Google Scholar]
- 7.Beier KT, et al. Circuit architecture of VTA dopamine neurons revealed by systematic input-output mapping. Cell. 2015;162:622–634. doi: 10.1016/j.cell.2015.07.015. [DOI] [PMC free article] [PubMed] [Google Scholar]
- 8.Schwarz LA, et al. Viral-genetic tracing of the input–output organization of a central noradrenaline circuit. Nature. 2015;524:88–92. doi: 10.1038/nature14600. [DOI] [PMC free article] [PubMed] [Google Scholar]
- 9.Lerner TN, et al. Intact-brain analyses reveal distinct information carried by SNc dopamine subcircuits. Cell. 2015;162:635–647. doi: 10.1016/j.cell.2015.07.014. [DOI] [PMC free article] [PubMed] [Google Scholar]
- 10.Lammel S, et al. Input-specific control of reward and aversion in the ventral tegmental area. Nature. 2012;491:212–217. doi: 10.1038/nature11527. [DOI] [PMC free article] [PubMed] [Google Scholar]
- 11.Kalivas PW, Volkow ND. The neural basis of addiction: a pathology of motivation and choice. Am J Psychiatry. 2005;162:1403–1413. doi: 10.1176/appi.ajp.162.8.1403. [DOI] [PubMed] [Google Scholar]
- 12.Nestler EJ, Carlezon WA. The mesolimbic dopamine reward circuit in depression. Biol Psychiatry. 2006;59:1151–1159. doi: 10.1016/j.biopsych.2005.09.018. [DOI] [PubMed] [Google Scholar]
- 13.Albin RL, Young AB, Penney JB. The functional anatomy of basal ganglia disorders. Trends Neurosci. 1989;12:366–375. doi: 10.1016/0166-2236(89)90074-x. [DOI] [PubMed] [Google Scholar]
- 14.Yin HH, Knowlton BJ. The role of the basal ganglia in habit formation. Nat Rev Neurosci. 2006;7:464–476. doi: 10.1038/nrn1919. [DOI] [PubMed] [Google Scholar]
- 15.Hammond C, Bergman H, Brown P. Pathological synchronization in Parkinson’s disease: networks, models and treatments. Trends Neurosci. 2007;30:357–364. doi: 10.1016/j.tins.2007.05.004. [DOI] [PubMed] [Google Scholar]
- 16.Lüscher C, Malenka RC. Drug-evoked synaptic plasticity in addiction: From molecular changes to circuit remodeling. Neuron. 2011;69:650–663. doi: 10.1016/j.neuron.2011.01.017. [DOI] [PMC free article] [PubMed] [Google Scholar]
- 17.Wickersham IR, et al. Monosynaptic restriction of transsynaptic tracing from single, genetically targeted neurons. Neuron. 2007;53:639–647. doi: 10.1016/j.neuron.2007.01.033. [DOI] [PMC free article] [PubMed] [Google Scholar]
- 18.Smith Y, Bolam JP. The output neurones and the dopaminergic neurones of the substantia nigra receive a GABA-containing input from the globus pallidus in the rat. J Comp Neurol. 1990;296:47–64. doi: 10.1002/cne.902960105. [DOI] [PubMed] [Google Scholar]
- 19.Zhou FM, Lee CR. Intrinsic and integrative properties of substantia nigra pars reticulata neurons. Neuroscience. 2011;198:69–94. doi: 10.1016/j.neuroscience.2011.07.061. [DOI] [PMC free article] [PubMed] [Google Scholar]
- 20.Oliet SHR, Malenka RC, Nicoll RA. Bidirectional control of quantal size by synaptic activity in the hippocampus. Science. 1996;271:1294–1297. doi: 10.1126/science.271.5253.1294. [DOI] [PubMed] [Google Scholar]
- 21.Raab-Graham KF, Radeke CM, Vandenberg CA. Molecular cloning and expression of a human heart inward rectifier potassium channel. Neuroreport. 1994;5:2501–2505. doi: 10.1097/00001756-199412000-00024. [DOI] [PubMed] [Google Scholar]
- 22.Schiavo G, et al. Tetanus and botulinum-B neurotoxins block neurotransmitter release by proteolytic cleavage of synaptobrevin. Nature. 1992;359:832–835. doi: 10.1038/359832a0. [DOI] [PubMed] [Google Scholar]
- 23.Stachniak TJ, Ghosh A, Sternson SM. Chemogenetic synaptic silencing of neural circuits localizes a hypothalamus→midbrain pathway for feeding behavior. Neuron. 2014;82:797–808. doi: 10.1016/j.neuron.2014.04.008. [DOI] [PMC free article] [PubMed] [Google Scholar]
- 24.Lammel S, Ion DI, Roeper J, Malenka RC. Projection-specific modulation of dopamine neuron synapses by aversive and rewarding stimuli. Neuron. 2011;70:855–862. doi: 10.1016/j.neuron.2011.03.025. [DOI] [PMC free article] [PubMed] [Google Scholar]
- 25.Miyamichi K, et al. Dissecting local circuits: Parvalbumin interneurons underlie broad feedback control of olfactory bulb output. Neuron. 2013;80:1232–1245. doi: 10.1016/j.neuron.2013.08.027. [DOI] [PMC free article] [PubMed] [Google Scholar]
- 26.Rajasethupathy P, et al. Projections from neocortex mediate top-down control of memory retrieval. Nature. 2015;526:653–659. doi: 10.1038/nature15389. [DOI] [PMC free article] [PubMed] [Google Scholar]
- 27.Gittis AH, et al. New roles for the external globus pallidus in basal ganglia circuits and behavior. J Neurosci. 2014;34:15178–15183. doi: 10.1523/JNEUROSCI.3252-14.2014. [DOI] [PMC free article] [PubMed] [Google Scholar]
- 28.Pierce RC, Kumaresan V. The mesolimbic dopamine system: The final common pathway for the reinforcing effect of drugs of abuse? Neurosci Biobehav Rev. 2006;30:215–238. doi: 10.1016/j.neubiorev.2005.04.016. [DOI] [PubMed] [Google Scholar]
- 29.Stepien AE, Tripodi M, Arber S. Monosynaptic rabies virus reveals premotor network organization and synaptic specificity of cholinergic partition cells. Neuron. 2010;68:456–472. doi: 10.1016/j.neuron.2010.10.019. [DOI] [PubMed] [Google Scholar]
- 30.Miyamichi K, et al. Cortical representations of olfactory input by trans-synaptic tracing. Nature. 2011;472:191–196. doi: 10.1038/nature09714. [DOI] [PMC free article] [PubMed] [Google Scholar]
- 31.Yonehara K, et al. Spatially asymmetric reorganization of inhibition establishes a motion-sensitive circuit. Nature. 2011;469:407–410. doi: 10.1038/nature09711. [DOI] [PubMed] [Google Scholar]
- 32.Wall NR, De La Parra M, Callaway EM, Kreitzer AC. Differential innervation of direct- and indirect-pathway striatal projection neurons. Neuron. 2013;79:347–360. doi: 10.1016/j.neuron.2013.05.014. [DOI] [PMC free article] [PubMed] [Google Scholar]
- 33.Franklin KBJ, Paxinos G. Edition. (Academic Press; 2012. The Mouse Brain in Stereotaxic Coordinates 4th. [Google Scholar]
- 34.Backman CM, et al. Characterization of a mouse strain expressing Cre recombinase from the 3’ untranslated region of the dopamine transporter locus. Genesis. 2006;44:383–390. doi: 10.1002/dvg.20228. [DOI] [PubMed] [Google Scholar]
- 35.Taniguchi H, et al. A resource of Cre driver lines for genetic targeting of GABAergic neurons in cerebral cortex. Neuron. 2011;71:995–1013. doi: 10.1016/j.neuron.2011.07.026. [DOI] [PMC free article] [PubMed] [Google Scholar]
- 36.Hippenmeyer S, et al. A developmental switch in the response of DRG neurons to ETS transcription factor signaling. PLoS Biol. 2005;3:878–890. doi: 10.1371/journal.pbio.0030159. [DOI] [PMC free article] [PubMed] [Google Scholar]
- 37.Madisen L, et al. Transgenic mice for intersectional targeting of neural sensors and effectors with high specificity and performance. Neuron. 2015;85:942–958. doi: 10.1016/j.neuron.2015.02.022. [DOI] [PMC free article] [PubMed] [Google Scholar]
- 38.Rothwell PE, et al. Autism-associated neuroligin-3 mutations commonly impair striatal circuits to boost repetitive behaviors. Cell. 2014;158:198–212. doi: 10.1016/j.cell.2014.04.045. [DOI] [PMC free article] [PubMed] [Google Scholar]
- 39.Shuen JA, Chen M, Gloss B, Calakos N. Drd1a-tdTomato BAC transgenic mice for simultaneous visualization of medium spiny neurons in the direct and indirect pathways of the basal ganglia. J Neurosci. 2008;28:2681–2685. doi: 10.1523/JNEUROSCI.5492-07.2008. [DOI] [PMC free article] [PubMed] [Google Scholar]
- 40.Krashes MJ, et al. Rapid, reversible activation of AgRP neurons drives feeding behavior in mice. J Clin Invest. 2011;121:1424–1428. doi: 10.1172/JCI46229. [DOI] [PMC free article] [PubMed] [Google Scholar]
- 41.Xue M, Atallah BV, Scanziani M. Equalizing excitation-inhibition ratios across visual cortical neurons. Nature. 2014;511:596–600. doi: 10.1038/nature13321. [DOI] [PMC free article] [PubMed] [Google Scholar]
- 42.Mosca TJ, Luo L. Synaptic organization of the Drosophila antennal lobe and its regulation by the Teneurins. Elife. 2014;3:e03726. doi: 10.7554/eLife.03726. [DOI] [PMC free article] [PubMed] [Google Scholar]
- 43.Gunaydin LA, et al. Natural neural projection dynamics underlying social behavior. Cell. 2014;157:1535–1551. doi: 10.1016/j.cell.2014.05.017. [DOI] [PMC free article] [PubMed] [Google Scholar]
- 44.Petreanu L, Mao T, Sternson SM, Svoboda K. The subcellular organization of neocortical excitatory connections. Nature. 2009;457:1142–1145. doi: 10.1038/nature07709. [DOI] [PMC free article] [PubMed] [Google Scholar]
- 45.Park JS, et al. Synthetic control of mammalian-cell motility by engineering chemotaxis to an orthogonal bioinert chemical signal. Proc Natl Acad Sci U S A. 2014;111:5896–5901. doi: 10.1073/pnas.1402087111. [DOI] [PMC free article] [PubMed] [Google Scholar]
Associated Data
This section collects any data citations, data availability statements, or supplementary materials included in this article.
Supplementary Materials
Data Availability Statement
Numerical data for each figure is included with the manuscript as source data. All other data will be available from the authors upon reasonable request.


