

Abstract
Macrophage activation by bacterial lipopolysaccharide (LPS) leads to induction of a complex inflammatory gene program dependent on numerous transcription factor families. The transcription factor Ikaros has been shown to play a critical role in lymphoid cell development and differentiation, however its function in myeloid cells and innate immune responses is less appreciated. Using comprehensive genomic analysis of Ikaros-dependent transcription, DNA binding, and chromatin accessibility, we describe unexpected dual repressor and activator functions for Ikaros in the LPS response of murine macrophages. Consistent with the described function of Ikaros as transcriptional repressor, Ikzf1−/− macrophages showed enhanced induction for select responses. In contrast, we observed a dramatic defect in expression of many delayed LPS response genes and ChIP-seq analyses support a key role for Ikaros in sustained NF-κB chromatin binding. Decreased Ikaros expression in Ikzf1+/− mice and human cells dampens these Ikaros-enhanced inflammatory responses, highlighting the importance of quantitative control of Ikaros protein level for its activator function. In the absence of Ikaros, a constitutively open chromatin state was coincident with dysregulation of LPS-induced chromatin remodeling, gene expression, and cytokine responses. Together, our data suggest a central role for Ikaros in coordinating the complex macrophage transcriptional program in response to pathogen challenge.
INTRODUCTION
Innate immune cells such as macrophages respond to pathogen associated molecular patterns (PAMPs) through a wide range of pattern recognition receptors (PRRs) (1–3). Among the PRR families, the toll like receptors (TLRs) are perhaps the most intensively studied (3–5), and the TLR4 response to lipopolysaccharide (LPS) in particular has become a widely used model system for the analysis of inflammatory gene regulation, due in part to the number and complexity of the gene classes induced by this ligand-receptor interaction (6–8). LPS-activated genes exhibit differential expression kinetics, leading to their classification as primary and secondary response genes. These two kinetically-defined classes are in turn differentiated by promoter CpG content and the requirements for secondary protein synthesis, epigenetic modifications, and chromatin remodeling (6–8).
Activation of the NF-κB family of transcription factors, and particularly RelA/p65 (9–11), plays a fundamental role in PRR-induced expression of immune response genes (3, 12, 13). While oscillatory nuclear dynamics have been shown to regulate RelA activity (14–17), recent work suggests that in PRR-activated macrophages, RelA exhibits a prolonged phase of nuclear residence, supporting sustained activation of key immune effector genes (18). Considering the pervasive requirement for NF-κB activation in diverse early and late PRR-induced macrophage responses (19), we have an incomplete understanding of how NF-κB activity is coordinated with the function of additional transcription factors to control multiple phases of inflammatory gene expression.
We previously described a role for the transcription factor Ikaros in sustaining RelA nuclear occupancy in response to pathogenic concentrations of LPS, which promoted positive feedback in the NF-κB activation cycle and led to a more robust innate immune response in macrophages (18). Ikaros has a well-studied role in lymphocyte development and differentiation (20, 21), and in lymphoid cells it has been characterized as a repressor of gene expression (22–24). While Ikaros expression is reduced during myeloid cell development, we have shown that this transcription factor is strongly induced in macrophages after LPS challenge (18). Considering the limited understanding of Ikaros function in innate immunity and its putative repressor capacity, elucidating the function of Ikaros in LPS-induced responses was of considerable interest.
To interrogate Ikaros function in the context of temporal control of inflammatory responses, we conducted a comprehensive genomic analysis of Ikaros-dependent gene expression, DNA binding, and chromatin accessibility in LPS-stimulated primary mouse macrophages. We observe dual effects of Ikaros on gene expression. A subset of LPS-induced genes were repressed in the context of Ikaros expression, while a larger proportion of LPS response genes required Ikaros for full activation, particularly among late response genes. This latter effect coincides with a substantial reduction in sustained RelA chromatin binding in Ikzf1−/− cells and altered LPS-induced chromatin accessibility. Our data suggest an unexpected central role for Ikaros in macrophage chromatin regulation and the associated complex transcriptional changes that occur during pathogen challenge.
MATERIALS AND METHODS
Mouse BMDM culture and ligand stimulation
Mice were maintained in specific-pathogen-free conditions and all procedures were approved by the NIAID Animal Care and Use Committee (National Institutes of Health, Bethesda, MD). Bone marrow progenitors from littermate wild type, Ikzf1+/− and Ikzf1−/− mice (20) (generously provided by K. Georgopoulos) were differentiated into BMDM in complete DMEM, 10% FBS, 20 mM Hepes, and 2 mM glutamine culture media containing 60 ng/ml M-CSF (R&D). On day 7 after differentiation, complete DMEM was replaced with 2% DMEM (2% FBS, 20 mM Hepes, and 2 mM glutamine) and 3 hr later cells were treated with 10ng/ml LPS for the indicated time. In cytokine validation experiments, day 6 BMDM were plated 100,000 cell per well of a 96 well plate, and the following day were stimulated with 10ng/ml LPS for the indicated time. The RAW264.7 parental cell line was from ATCC (cat. no. TIB-71; lot no. 2263775), and was acquired from the master stock established by the Alliance for Cell Signaling Consortium. Cells were authenticated by karyotyping and short tandem repeat profiling and were confirmed to be free of mycoplasma contamination. Wild type and Ikzf1−/− RAW264.7 cells were maintained in DMEM, 10% FBS, 20 mM Hepes, and 2 mM glutamine. LPS was from Alexis Biochemicals, Salmonella minnesota R595 TLRgrade, ALX-581-008-L002.
RNA-seq
Total RNA was isolated from approximately 1×10⁶ cells by using an RNAeasy Mini Kit (Qiagen). Sequencing libraries were generated using the Illumina TruSeq V3 protocol and subject to 101 bp paired-end sequencing on an Illumina HiSeq2000. Sample quality, library complexity, and alignment statistics were checked using an established pipeline at the NCI Center for Cancer Research Sequencing Facility. All RNA-seq analyses were performed from two biological replicates. The sequencing reads were aligned against the reference mouse genome mm9 and ensemble v70 transcripts using TopHat (v. 2.0.8). The alignment statistics were greater than 93% for all samples. All short reads were assembled with Cufflinks (v. 2.0.2) with -G option to quantitate against annotated reference transcripts.
Data analysis
Transcripts shorter than 200 bp were discarded. We first compared methods for identification of differentially expressed genes in response to LPS. In the first approach, replicates were combined by taking the mean value for each transcript, and LPS-induced transcripts were classified as having a minimum log2 (FPKM fold) change of ≥1 FPKM from baseline in at least one time point post-LPS stimulation (2 hr, 4 hr, 10 hr). This method identified 2,063 differentially expressed genes. We then compared this approach to edgeR, another widely used RNA-seq analysis method, using an FDR < 0.001, which identified a much larger set of >5000 genes as LPS-induced. EdgeR analysis plots showed that many genes considered differentially expressed at FDR < 0.001 have a low fold change (Fig. S1D). We therefore selected the FPKM method to restrict our analysis to genes with more substantial LPS-induced changes. Genes with multiple transcripts were assigned the transcripts with the largest maximum expression change across all time points post-LPS stimulation. Early, mid, and late-response genes were classified as those genes that reached peak expression change at 2 hr, 4 hr, or 10 hr, respectively. Ikaros-repressed and Ikaros activated were classified as those LPS-induced genes whose basal expression change was increased by at least 2 fold, or decreased by at least 2 fold at any time point in Ikaros KO, respectively. Ikaros neutral genes showed below 2 fold absolute expression change between WT and KO.
ChIP-seq
ChIP assays were performed as described previously (25, 26), with the following modifications. Cells were treated with 10 ng/ml LPS or left untreated for the indicated times. For the RelA and Ikaros ChIP, BMDMs were cross-linked with 1% formaldehyde for 10 min at room temperature. After cross-linking, chromatin was isolated from approximately 2 × 10⁷ cells and processed as follows. The lysis buffer to shear the chromatin contained 0.5% SDS, 10 mM EDTA (pH 8), 50 mM tris-HCl (pH 8), and proteinase inhibitor cocktail. Sonication was performed with a Bioruptor Plus (Diagenode) at medium setting for a total time of 17 min for Ikaros ChIP, 20 min for RelA ChIP, using a 30 sec ON, 30 sec OFF cycle to shear the chromatin to generate DNA fragments with a size range of 200 to 600 base pairs. The sonicated mixture was centrifuged at 14,000 rpm for 10 min. The sheared chromatin samples were diluted 1:5 in dilution buffer [0.01% SDS, 1.1% Triton-X, 1.2 mM EDTA (pH 8), 20 mM tris-HCl (pH 8), 167 mM NaCl, and proteinase inhibitor cocktail]. For the RelA ChIP, 10 μl of a rabbit polyclonal anti-RelA antibody (ab7970, Abcam) was diluted in 1 ml immune complex buffer with Dynabeads protein A (Invitrogen). For the Ikaros ChIP, 10 ul of a goat polyclonal Ikaros antibody (M-20, Santa Cruz) was diluted in 1 ml immune complex buffer with Dynabeads protein G (Invitrogen). 200 μg chromatin DNA was immunoprecipitated with antibody-bead complexes at 4°C overnight. The chromatin-DNA complexes were washed with immune complex buffers (Low salt, High salt, LiCl and TE) and were eluted followed by reverse cross-linking (10 mM Tris-HCl, 300 mM NaCl, 55 mM EDTA, 0.5% SDS). Sequencing libraries were generated using Illumina TruSeq V3 protocol and subjected to 51 bp single-end sequencing on an Illumina HiSeq2000. Sample quality and library complexity were checked using an established pipeline at the NCI Center for Cancer Research Sequencing Facility. All ChIP-seq analyses were performed from two or three biological replicates.
Data analysis
Binary indications of Ikaros and/or RelA binding were determined as a hotspot maximum density (HSMaxD) greater than zero at respective time points. When comparing the distributions of HSMaxD in LPS induced vs. LPS non-induced genes, the median HSMaxD was assigned to each gene. Shifts in the distributions were assigned p-values calculated from a Kolmogorov-Smirnov test. Raw bam files were uploaded to the UCSC genome browser for visualization of genome tracks. Individual gene loci at each time point were categorized as: uniquely bound by Ikaros, uniquely bound by RelA, or co-bound. Enrichment scores of Ikaros/RelA co-bound LPS-induced genes were assessed as FDR-adjusted p-values resulting from Fisher’s Exact test applied to each target gene group comparing a gene’s co-bound status against it’s classification as an early, mid, or late response gene. The background for the Fisher’s Exact test is the entirety of genome-wide bound hotspots at each time point.
ChIP-qPCR
The chromatin immunoprecipitation was performed as described above for ChIP-seq. The purified ChIP products were subjected to qPCR analysis with an IQ SYBR Green Supermix and a MyIQ singlecolor, real-time PCR detection system (Bio-Rad) according to the manufacturer’s instructions. DNA mixtures purified from aliquots of each chromatin sample were also subjected to qPCR analysis as input samples, and the results were presented as the ChIP-qPCR measurements normalized to their respective input levels. The ChIP-qPCR respective forward and reverse primers were: Tnf; CTTGGAGGAAGTGGCTGAAG and GCTGAGTTCATTCCCTCTGG, Rela; GTGGGAGGGGCGTAACTATT and CCACTATGCCAGAAGGAGGA, Rela; CTCATGGCTCTCAGGGACTC and ACGTTTTCCTAAGCGTGCAG, Ccl4; CATGAAGCT CTGCGTGTCT and GCAGCTGGAAGAGTCAACTTA, Lcn2; GTCCAGGAAGCCATGAAG TAAT and CCTTCCTGTTGCTCAACCTT, Negative control; AGGCCTGCACTACCAAACAC and TAATGCCCTTGCAGAAGACC.
DNase-seq
DNase-seq was performed as previously described (27, 28), with the following specific details. After treatment with 10 ng/ml LPS for the indicated times, cells were pelleted at 500 g for 5 min at 4°C followed by nuclei isolation with ice-cold buffer A (15 mM Tris-Cl (pH 8), 15 mM NaCl, 60 mM KCl, 1 mM EDTA (pH 8), 0.5 mM EGTA (pH 8), 0.04% NP-40, 0.5 mM Spermidine), and the nuclei were centrifuged at 500 g for 5 min at 4°C. The isolated nuclei were washed with fresh-cold buffer A and chromatin from 5 million cells were digested with 80 U/ml DNase I (Sigma) for 3 min at 37ºC followed by termination of the reaction with an equal volume of Stop buffer (50 mM Tris-Cl, pH 8, 100 mM NaCl, 0.1% SDS, 100 mM EDTA, pH 8). The DNase I digested nuclei were deproteinized at 55ºC overnight with 10 μg/ml of RNaseA (Invitrogen) and Proteinase K (Ambion). Digested DNA fragments were purified using phenol-chloroform and enriched by size selection over a sucrose gradient. DNA fragments between 100 bp and 500 bp were precipitated and dissolved in nuclease free water (Ambion). DNase digestion was validated by qPCR with the following forward and reverse primer pairs. High sensitivity (Chr2); GGATTCCTTTCTGCTCGAAG and CGGTTCGGTTTTTCCTTGTA, Medium sensitivity (Chr7); GCAGGACGAAGAAAACAAGC and TTCCCTTTTCACCATTTCCA, Weak sensitivity (Chr1); GACCTAGCCCCGGAACTAAC and CAGCCCTTCTCGAGACACTT, and Insensitive negative control (Chr8); TAGCGGAGAGCAAAGAAAGG and ACTCAACTTAGGGCCCACCT. Two biological replicate samples per treatment group were prepared separately for high throughput sequencing. Sequencing libraries were generated using Illumina TruSeq V3 protocol and subject to 51 bp single-end sequencing on Illumina HiSeq2000. Sample quality and library complexity were checked using an established pipeline at the NCI Center for Cancer Research Sequencing Facility.
Data analysis
Analysis was restricted to intra-genic gene loci (promoters, introns, exons). Density values were log2 transformed. Accessible loci were defined as any hotspot with a maximum density (MaxD) greater than 0. When comparing sample standard deviation across time points, error bars, representing 95% confidence intervals, were calculated using a basic bootstrap of the population using 1000 iterations of resampling. Shifts in distributions of MaxD values were assigned p-values calculated from a Kolmogorov-Smirnov test.
ChIP-seq & DNase-seq peak analysis
Peak hotspots were defined as statistically enriched regions of mapped reads, gauged by a binomial test, of a 250 bp target window in comparison to a 200kb background window. Coordinates for overlapping hotspots were taken to be the union of each overlapping hotspot. Master hotspot coordinates were taken to be the union of hotspot coordinates across all DNase-seq/ChIP experiments. Each of these coordinates, along with annotation, define each individual gene locus. Annotation of each gene locus categorized each locus as one of: promoter, exon, intron, downstream, upstream. Average density (AveD) was calculated as the total number of overlapping fragments normalized by the number of spanning nucleotides. Max density (MaxD) was calculated as the maximum number of overlapping fragments. Hotspot max density (HSMaxD) was calculated as the max density for a given hotspot confined to the nearest master hotspot coordinate. For comparisons of total DNase signal between different conditions (Fig. 4J), the HS MaxD was summed for all the intragenic sites associated with a given gene. All density values were normalized to the sequencing depth of 10 million fragments (29). Replicates were combined by averaging density values of overlapping peaks, and taking the union of non-overlapping peaks.
Transcription regulatory element analysis
Sequences from the center 500 bp of the original ChIP-seq peaks were used as input into the DREME (30) and MEME (31) algorithms. Sequence inputs were stratified into High, Mid, and Low density sets. The enrichment of each of the top ranked motifs output from MEME and DREME (High and Mid Density sequences) was further assessed by computing an average affinity score for that motif against the full set of hotspot sequences for a given experiment (e.g. Cobound 0 hr, Unique Ikaros 8 hr, etc.). This average affinity score was assigned a p-value by comparing it against a lognormal affinity background distribution created using a custom set of pooled sequences 1.5 – 2 kb long (upstream, downstream, intronic, exonic, promoter) gathered for each gene across the entire mm9 genome. Background sequences were downloaded from the UCSC genome browser. Lognormal enrichment was computed with the aid and slight modification of the following R packages: PWMEnrich, BSgenome.Mmusculus.UCSC.mm9, Biostrings, and seqLogo. Motif comparison was computed using TomTom. Consensus motifs for Ikaros and RelA gathered by the SELEX method were downloaded from TRANSFAC. We also used DiRE (32) to examine potential regulatory elements in gene classes with different Ikaros dependency. Analysis was performed using default DiRE settings on a given gene list either with a background of 5000 random genes, or with a background of all other LPS-induced genes not within the gene set being analyzed. Enriched transcription factors were ranked by an Importance parameter defined as the product of TF occurrence and weight relative to the background gene set (33).
Bacterial infection
Day 6 BMDM were plated at 100,000 cells per well of a 96 well plate and the following day were infected with Salmonella typhimurium (ATCC 14028) at an MOI of 1. After 30 minutes, media was removed and replaced with media containing 50μg/ml Gentamicin for 30 minutes, before being replaced again with 10μg/ml Gentamicin containing media for the remainder of the stimulation period. The B. cenocepacia J2315 strain was grown on blood agar plates at 37°C for 3 days. Colonies were incubated in 25mL of Luria–Bertani (LB) broth at 37°C with shaking for 16–18 hrs to grow bacteria to the mid log phase. Formalin killed (FK) bacteria were prepared by treatment with 4% formaldehyde for 30 min at room temperature. Both wild type and Ikzf1 KO RAW264.7 cells were infected with bacteria at MOI 1 and incubated for 20 hr. The supernatant was collected and stored at −30°C until ready for cytokine measurement using CBA.
Human monocyte stimulation
After written informed consent was provided, human donor blood was obtained at the National Institutes of Health (NIH) Clinical Center under Institutional Review Board (IRB)–approved protocols. PBMCs were purified from blood by Ficoll (Fisher Scientific) density gradient centrifugation, washed with RPMI 1640 plus penicillin, streptomycin, and L-glutamine (Gibco) along with 10% FBS (Sigma-Aldrich). Cells were resuspended to a concentration of 1 × 10⁶ cells/ml and aliquoted (1 ml/well) into 48-well plates. LPS (0.5 μg/ml Sigma-Aldrich) and brefeldin A (5 μg/ml, Sigma-Aldrich) were added before incubation at 37 °C overnight. After incubation, cells were washed with FACS buffer and stained with LIVE/DEAD Blue (Life Technologies). Cells were then fixed in 1.6% paraformaldehyde for 10 min at room temperature, spun down, resuspended in 100% cold methanol, and incubated overnight at −20 °C. Cells were then washed and stained with fluorochrome-conjugated antibodies: CD14 (MφP9, BD Biosciences), CD11c (B-ly6, BD Biosciences), Ikaros (R32-1149, BD Biosciences), IL-1β (AS10, BD Biosciences), TNF-α (MAb11, BD Biosciences), and IL-6 (MQ2-13A5, eBioscience). The data were gated on CD11c+CD14+ monocytes.
Human MDM culture, siRNA knockdown, and stimulation
Elutriated monocytes from healthy human donors were obtained from the NIH blood bank. The monocytes were cultured in cRPMI (RPMI 1640 medium containing 10% FBS, 10 mM Hepes, 0.1% b-mercaptoethanol, and 2 mM glutamine) with granulocyte macrophage colony-stimulating factor (GM-CSF; 10 ng/ml, R&D Systems, 215-GM-010) for 7 days to differentiate into human MDM. The MDM were harvested to perform siRNA knock down using the Amaxa human macrophage nucleofector kit (Lonza, VPA-1008) following the manufacture’s protocol. The non-targeting control siRNA NTC5 was from GE Dharmacon (D-001210-05), the siRNA targeting human IKZF1 were Ambion Silencer Select siRNA. The sense siRNA sequences were siIKZF1_A:UGUGCUCAUGGUUCACAAAtt, siIKZF1_B: GCGAAGCUCUUUAGAGGAAtt, and siIKZF1_C: UGAUAUCUGUGGGAUCAUUtt. At 48 hr after knock down, cells were stimulated with 20 ng/ml LPS (Alexis Biochemicals, ALX-581-008-L002) for 6 hr and supernatants were collected for cytokine detection. In parallel MDM from each siRNA treatement were lysed in RLT buffer (Qiagen, RNAeasy mini kit, 74104) for IKZF1 mRNA quantification by qPCR.
Cytokine measurement
Mouse BMDM or human MDM were stimulated with LPS or S. typhimurium for the indicated times. In BMDM timecourse experiments, at the indicated time after LPS addition, supernatant was removed and replaced with new complete DMEM. Thus, 2.5h, 6h, and 12h represent 0-2.5, 2.5-6, and 6-12 hr of stimulation, respectively. Supernatant samples were diluted to appropriate concentration ranges and cytokines were detected using cytometric bead array (BD Biosciences). Peritoneal lavage fluid was not diulated prior to cytokine measurement. Bead array data were collected on a BD Fortessa, median fluoresce intensity was derived using FlowJo, and Microsoft excel was used to calculate concentrations using a standard curve.
CRISPR/Cas9 gene editing
Gene specific gRNA sequences were selected for high score and low off-target activity using the design rules at http://crispr.mit.edu/, and cloned as annealed oligonucleotide cassettes into BbsI digested pX330-puro plasmid (expressing Cas9 and all guide and tracr RNA sequences required for CRISPR/Cas9 gene editing). RAW264.7 cells were co-transfected with 5 μg of the pX330-puro gene editing plasmid and 1 μg of pMax-GFP by nucleofection following the manufacturer’s protocol (Cell Line Nucleofector Kit V, Lonza). The murine Ikzf1 gene locus was targeted using the following gRNA sequence: 5’-CAGCAGAACTCCAAGAGTGATCGAGG-3’ (Fig. 6B). Cells were allowed to recover for 18 hr in 6-well plates before being FACS sorted for GFP expression. Single cell clones were expanded and sequenced to characterize gene editing as previously described (34). Ikaros protein ablation was confirmed by western blot using a rabbit polyclonal Ikaros antibody (ab26083, Abcam).
RESULTS
Ikaros is required to sustain the LPS-induced gene program
Macrophage TLR stimulation drives induction of diverse immune mediator mRNAs and their expression dynamics are characterized by multiple phases of gene induction (6–8). We measured gene expression by RNA-seq in primary bone marrow-derived macrophages (BMDM) stimulated with LPS across a 10 hr time course (Fig. S1, Supplementary file S1), and classified LPS-responsive genes based on the timing of their highest expression level as early, mid or late peaking response genes (Fig. S2). The early peaking response gene set contains important pro-inflammatory genes such as Tnf, Il1a and Ifnb1, as well as negative feedback regulators of LPS-activated NF-κB (Nfkbia and Nfkbie) and MAPK (Dusp1 and Dusp2) signaling pathways (Fig. S2A). Additional inflammatory interleukins and interferon-induced genes (Il6, Ccl4, Il12b, Ifit1-3) and inflammasome pathway components (Casp1, Casp4, Nlrp3, Nlrc4 and Il1b) are found in the mid peaking genes (Fig. S2B), while late peaking genes include immune mediators with sustained LPS-induced expression characteristics such as Ccl2, IL12a and Irf7, as well as feedback regulators with important roles in resolving the inflammatory response (Irak3, Il18bp and Il1rn) (Fig. S2C).
It has been shown previously that LPS induces increased expression of the transcription factor Ikaros in macrophages and that this induction supports positive feedback in the NF-κB response (18). Consistent with this prior observation, we find that the gene coding for Ikaros (Ikzf1) is a mid peaking LPS-induced gene (Fig. S2B). To evaluate the role of Ikaros in supporting the different phases of the LPS-induced gene program, we compared the LPS response of the same temporally defined gene classes in Ikzf1−/− BMDM using RNA-seq (Fig. 1, Fig. S1, Supplementary file S1). While Ikzf1−/− mice are severely runted and fail to thrive (20), in vitro differentiated BMDM from these animals appear phenotypically normal and display levels of CD11b, F4/80 and CD14 comparable to WT (Fig. S3). Within the early, mid and late response groups, we considered genes to be Ikaros-regulated if their expression increased (‘Ikaros-repressed’) or decreased (‘Ikaros-enhanced’) greater than 2-fold relative to wild-type (WT) macrophages. Remaining genes were classified as ‘Ikaros Independent’. Consistent with the well-characterized function of Ikaros as a transcriptional repressor in lymphocytes, we found a proportion of LPS-induced genes to be Ikaros-repressed (Fig. 1A). However, a greater proportion of LPS-induced genes were dependent on Ikaros for their activation, a pattern that was most evident among mid and late response genes, of which 56% and 40% respectively were Ikaros-enhanced (Fig. 1B). The proportion of Ikaros-independent LPS activated genes remained relatively constant at 50%, 37% and 47% across the early, mid and late response gene classes respectively (Fig. 1C). These data suggest that Ikaros has dual repressive and positive regulatory roles in the LPS-induced gene program. The observation that peak induction of most Ikaros-enhanced genes was detected coincident with or following increased Ikzf1 gene expression suggests that quantitative control of Ikaros protein level could be important for its activator function.
Figure 1. Ikaros is required to sustain the LPS-induced gene program.
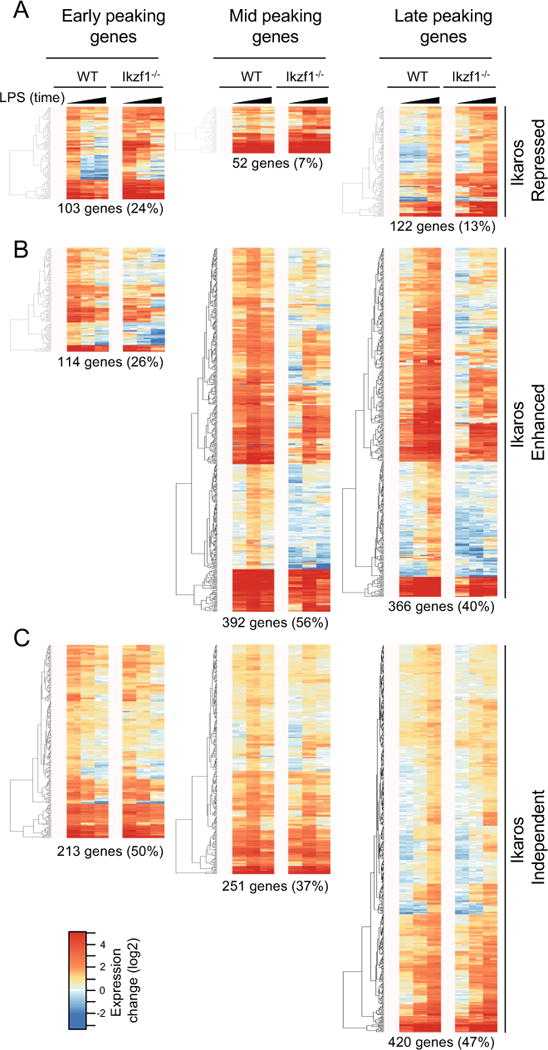
WT and Ikzf1−/− BMDMs were stimulated with 10 ng/ml LPS for 2, 4 and 10 hr and RNA expression levels (fold change log2 FPKM from baseline) were compared by RNA-seq. (A) Genes whose expression is repressed by Ikaros (2 fold minimum increase in Ikzf1−/− versus WT in at least one time point). (B) Genes whose expression is enhanced by Ikaros (2 fold minimum decrease in Ikzf1−/− versus WT in at least one time point). (C) Genes whose expression is unaffected by Ikaros. Data were averaged from two independent experiments (see also Supplementary file S1 and Methods).
Ikaros exhibits LPS-dependent chromatin binding at RelA occupied sites
Considering the prior evidence that Ikaros supports sustained RelA nuclear occupancy in LPS-stimulated macrophages (18), we used ChIP-seq to investigate steady state and LPS-activated Ikaros and RelA chromatin binding in BMDM (Supplementary file S2). Utilizing empirical cumulative distribution functions to compare Ikaros and RelA binding at LPS-induced and non-induced genes, we see a highly significant enrichment of binding of both RelA and Ikaros at LPS-induced gene loci (red curves) (Fig. 2A).
Figure 2. Ikaros exhibits LPS-dependent chromatin binding at RelA occupied sites.

Comparison of Ikaros and RelA chromatin binding in LPS-stimulated macrophages by ChIP-seq. (A) Comparison of empirical cumulative distribution functions of Ikaros and RelA bound hotspot maximum density between LPS induced and LPS non-induced genes at each time point post LPS-stimulation. Values > 0, Kolmogorov-Smirnov test p-values < 0.05. Shift in distributions suggest LPS-induced genes have greater affinity for Ikaros and RelA than LPS-non-induced genes throughout the LPS response. (B) Proportion of RelA bound hotspots that overlap with Ikaros bound hotspots during the LPS response. (C) Overlap of Ikaros and RelA bound hotspot regions throughout the LPS response both at whole genome level and at LPS-induced gene loci. (D) Comparison of average Ikaros ChIP-seq density between sites bound uniquely by Ikaros and sites co-bound with RelA. (E) Comparison of average RelA ChIP-seq density between sites bound uniquely by RelA and sites co-bound with Ikaros. (F) Genome browser images of Ikaros and RelA co-bound intragenic hotspots at Tnfaip2, Ccl4, and Lcn2 gene loci. Data in panels A-C were averaged from two independent experiments, data in panels D-E were averaged from replicate experiments (mean + s.d.) ****P < 0.0001 (two-tailed t test), while panel D shows browser tracks from a representative ChIP-seq experiment (See also Supplementary file S2).
We observed 883 Ikaros bound sites in the basal state, consistent with nuclear localization of Ikaros in untreated BMDM (18), and observed a dramatic increase in Ikaros-occupied sites in response to LPS stimulation over time, to 6506 and 12359 sites at 3 hr and 8 hr, respectively (Fig. 2B). Compared to Ikaros, we observed less binding of RelA in the steady state and a more transient LPS-induced maximal increase, with RelA binding peaking at 3 hr, with 5432 sites, and dropping to 2115 sites at 8 hr (Fig 2B). These RelA binding dynamics are consistent with shuttling of the transcription factor back to the cytosol by IκB proteins after initial activation, but with a substantial proportion of RelA protein showing sustained nuclear occupancy in response to this high dose of LPS, dependent on an Ikaros-mediated increase in RelA expression (18). The significant overlap between RelA and Ikaros bound sites after LPS treatment, particularly at 8 hr LPS-induced gene loci (Fig. 2B, C), could suggest a specific role for Ikaros in maintaining RelA chromatin binding, beyond its enhancement of RelA expression. Furthermore, we observed increased ChIP-seq signal magnitude for both Ikaros and RelA at their co-bound loci, compared to loci bound uniquely by either transcription factor (Fig. 2D, E). Robust recruitment of both Ikaros and RelA is shown at gene loci for representative early (Tnfaip2), mid (Ccl4) and late (Lcn2) LPS response genes (Fig. 2F).
We went on to assess the sequence characteristics of the chromatin regions bound by Ikaros and RelA by conducting de novo motif analysis using the MEME (31) and DREME (30) algorithms, comparing sequences either uniquely bound or co-bound by the two transcription factors (Fig. S5). Ikaros and RelA bound sites show strong enrichment for short GGAA sequences (Fig. S4A, Cluster 1), consistent with the presence of this core sequence in the consensus sites for both transcription factors (Fig. S4B); significance of this overlap was confirmed by TomTom analysis (p-value: 8.37e-03). DREME analysis also identified longer (~30bp) CACA repeat sequences showing a preferential enrichment for Ikaros/RelA cobound sites post LPS stimulation (Fig. S4A, Cluster 3), while long A repeat sequences appear moderately enriched among uniquely bound RelA sites (Fig. S4A, Cluster 2). Thus, a common short motif may support Ikaros and RelA recruitment to specific chromatin sites after LPS treatment, while longer more weakly enriched sequences may be related to whether sites are uniquely or co-bound by these transcription factors.
Sustained RelA binding is diminished in Ikaros-deficient macrophages
To determine if co-binding of Ikaros and RelA was associated with Ikaros negative or positive regulatory function, we used the Fisher’s exact test to quantify enrichment of Ikaros and RelA co-bound hotspots at genes repressed or enhanced by Ikaros. We find that co-binding is more prevalent at Ikaros-enhanced gene loci (Fig. 3A), with the strongest Ikaros/RelA co-binding enrichment being observed for Ikaros-enhanced late response genes, 8 hr after LPS stimulation (p < 9E-14). This suggests that Ikaros may be particularly important to support and sustain RelA binding at these loci, maintaining robust, long-lasting transcriptional responses to LPS challenge. Comparison of the Ikaros/RelA co-bound sites occupied across the LPS time course shows that a substantial proportion (545 of 732 (74%)) of the hotspots occupied at 8 hr are already bound by RelA and Ikaros at 3 hr (Fig. 3B), indicating a pattern of sustained RelA occupancy at these sites several hours after LPS challenge.
Figure 3. Ikaros/RelA co-bound hotspots are enriched among Ikaros activated genes and Ikaros is required for sustained RelA binding.

(A) Adjusted p-values (FDR) from Fisher’s exact test, assessing the significance for enrichment of Ikaros and RelA co-bound hotspots. Each box corresponds to a specific time point, for each of the Ikaros-dependent, LPS-induced gene expression classes. (B) Number of Ikaros and RelA co-bound hotspots overlapping at each time point in LPS-induced genes. (C) ChIP-qPCR of RelA binding at Rela and Tnf loci in WT and Ikzf1−/− BMDM stimulated with 10 ng/ml LPS for 8 hr. Data were averaged from two independent experiments. Panel C (mean + s.d.). **P < 0.01, ***P < 0.001 (two-tailed t test) (See also Supplementary file S2).
To determine if Ikaros is necessary to sustain this long-term RelA binding on LPS activated chromatin, we conducted RelA ChIP-PCR in WT and Ikaros deficient (Ikzf1−/−) BMDM treated with LPS for 8 hr. We observe a significant reduction in RelA binding at the Tnf and Rela promoters in the absence of Ikaros (Fig. 3C).
Dysregulated basal and LPS-induced chromatin accessibility in Ikzf1−/− macrophages
Ikaros has been implicated in chromatin regulation in lymphoid cells. Thus, to investigate whether the cooperative Ikaros and RelA function that we observed in LPS-induced gene regulation relates to the macrophage chromatin state, we conducted DNase-seq to measure genome-wide chromatin accessibility in LPS-stimulated macrophages (Fig. S5, Supplementary file S3). LPS stimulation of WT BMDM resulted in a global increase in chromatin accessibility at the 8 hr time point (Fig. 4A,B and Fig. S5B). Although 3 hr of LPS treatment appeared to induce modest effects on the genome-wide chromatin state, assessing the variance of intragenic (promoter+exon+intron) DNase-seq signal highlighted a selective increase in variance at LPS-induced loci at this time point, followed by a more striking increase after 8 hr of stimulation (Fig. 4C,D). We assessed the basal promoter DNase-seq density at the most strongly induced genes, and found that the expression level of these genes after 10 hr of LPS treatment was inversely correlated with the basal accessibility of the promoter region (Fig. 4E). Together, these data and previous studies suggest that LPS-induced gene expression is associated with dynamic opening of chromatin that is inaccessible in the basal state, particularly for late or secondary response genes (6–8).
Figure 4. Dysregulated basal and LPS-induced chromatin accessibility changes in Ikzf1−/− macrophages.

DNase-seq analysis of chromatin accessibility in LPS stimulated WT and Ikzf1−/− macrophages. (A and B) Smoothed scatterplots of maximum DNase-seq peak density in each given DNase-seq hotspot between different LPS treatment conditions. Larger density values correspond to greater chromatin accessibility. All values > 0. (C and D) Variance in maximum DNase-seq peak density across LPS time course at either (C) all gene loci or (D) LPS responsive genes. (E) Correlation between maximum density of basal DNase-seq promoter hotspots and the 10 hr LPS induced expression of the 95th percentile of expressed genes. Red dashed line is a non-linear fit of the curve: Y = a/(x + b), where a and b are parameters, Y := DNase-seq data shown in scatterplot, x := RNAseq data shown in scatterplot. R-squared = 0.2397542, Spearman Rank Correlation = −0.6355441, Pearson Rank Correlation = −0.5200625. (F) Smoothed scatterplots of maximum DNase-seq peak density in each given DNase-seq hotspot comparing Ikzf1−/− to WT macrophages for each LPS treatment condition (See also Fig. S4B). (G) Violin plots of maximum density of DNase-seq intragenic hotspots at 0h, 3h, 8h post-LPS stimulation in WT versus Ikzf1−/− macrophages. Black dots represent median value. (H) Comparison of basal gene expression levels in WT and Ikzf1−/− macrophages. (I) Smoothed scatterplots of maximum DNase-seq peak density in each given DNase-seq hotspot between different LPS treatment conditions in Ikzf1−/− macrophages. (J) Change in distributions of total DNase density per gene between time points post-LPS stimulation in WT versus Ikzf1−/− macrophages. (K) Proportion of all detected DNase-seq sites accessible under different ligand stimulation conditions at both LPS responsive and non-responsive gene loci in WT and Ikzf1−/− macrophages. Dnase-seq data shown were averaged from 3 (WT) or 2 (Ikzf1−/−) independent experiments. Panels C+D (mean + s.d. ****P < 0.0001 (two-tailed unpaired t test)), K (mean + 95%CI). See also Supplementary file S3.
We went on to assess Ikaros-deficient BMDM using DNase-seq (Fig. S5C, Supplementary file S3) and found that chromatin was in a constitutively open state in the absence of Ikaros, to the extent similar as observed in WT BMDM after 8 hr of LPS treatment (Fig. 4F and Fig. S5B). This is reflected in both the median and variance of the DNase-seq peak density, with all Ikzf1−/− conditions being comparable to the WT 8 hr LPS stimulation condition (Fig. 4G). Representative Ikaros repressed (Cxcl1) and Ikaros enhanced (Irf7) gene loci also demonstrate broadly enhanced chromatin accessibility in all Ikzf1−/− conditions (Fig. S6; compare panels B and D to A and C respectively). These data suggest that Ikaros may be required to maintain a basal ‘closed’ chromatin state, consistent with its described repressor functions. However, they present an apparent paradox where, despite having a seemingly more open chromatin state, the induction of many LPS-responsive genes is substantially diminished (Fig. 1B). This diminished LPS-induced expression is not due to a constitutively higher basal level of gene expression (which could result in a reduced relative increase in mRNA expression), since gene expression levels in unstimulated WT and Ikzf1−/− BMDM were not significantly different (Fig. 4H and Fig. S5D-E).
Temporal DNase-seq analysis indicated dysregulation of LPS-induced changes in chromatin accessibility in Ikzf1−/− BMDM (Fig. 4I and Fig. S5B). In contrast to WT macrophages where chromatin opening was most striking during the late response, Ikzf1−/− cells showed detectable increased chromatin accessibility only between 0 and 3 hr of LPS treatment (Fig. 4J), primarily contributed by LPS-responsive gene loci (Fig. 4K), without further increases between 3 and 8hr. These aberrant chromatin alterations in Ikzf1−/− cells are also reflected in genome browser shots of representative Ikaros repressed (Cxcl1; Fig S5A-B) and Ikaros enhanced (Irf7; Fig S5C-D) LPS-responsive genes. To further assess the role of known Ikaros-associated chromatin remodeling factors at these gene loci, we measured binding of the Chd4 NuRD component (35, 36). Consistent with a primary role for NuRD in maintaining a closed chromatin state in resting cells, we observed basal Chd4 binding at these loci, which was substantially reduced in response to LPS (Fig. S7A). In contrast, we observed a robust increase in Ikaros binding in response to LPS, consistent with a principal role for Ikaros in facilitating chromatin opening for binding of stimulus-induced transcription factors such as RelA (Fig. S7B-E). Together these data suggest that appropriate LPS-induced chromatin accessibility may contribute to Ikaros-dependent positive regulation of mid and late LPS response genes requiring chromatin remodeling.
Ikaros expression level is critical for robust production of Ikaros-enhanced inflammatory mediators
Our RNA-seq, ChIP-seq and DNase-seq analyses suggest that Ikaros performs dual roles in macrophages. It negatively regulates expression of select genes, potentially through previously described interactions with transcriptional repressors (24, 35–38), while enhancing expression of a large proportion of the LPS gene program, coincident with regulation of chromatin accessibility and sustained NF-κB binding. We compared enriched transcriptional regulatory elements between Ikaros repressed and enhanced genes using DiRE (32), and noted that with a genome-wide gene background, the enriched motifs for both gene groups are dominated by the known LPS activated transcription factors NF-kB, AP1 and IRF (Fig. S8A). However, when compared against an LPS induced gene background to exclude these shared motifs, the enriched transcription factors at Ikaros-repressed and Ikaros-enhanced genes are distinct, with the Ikaros-repressed group showing enrichment of motifs for known repressive factors (39–41) (Fig. S8B).
To validate the dual roles of Ikaros at the level of LPS-induced cytokine secretion, we stimulated WT and Ikzf1−/− BMDM and assayed supernatant protein levels at varying times. Consistent with the RNA-seq data (Fig. 5A), we observed increased secretion of the Ikaros-repressed cytokines GCSF and CXCL1 in Ikzf1−/− cells, but substantially diminished responses for Ikaros-enhanced CCL4, CCL3, TNF and IL6 (Fig. 5B, C). Interestingly, the impact of Ikaros heterozygousity varied according to cytokine class. Ikzf1+/− BMDM (42) show diminished LPS-induced production of Ikaros-enhanced cytokines, comparable to Ikaros deficient cells (Fig. 5C, right). In contrast, the heterozygous phenotype for Ikaros-repressed cytokines was more similar to WT cells (Fig. 5C, left). Considering that induction of Ikaros expression by LPS precedes the peak of Ikaros-enhanced genes, together these data support a model whereby the level of Ikaros protein is particularly important to support its role as an activator of sustained gene expression. Production of Ikaros-enhanced inflammatory mediators was also diminished in response to gram-negative bacterial infection, in Ikzf1+/− BMDM infected with S. typhimurium (Fig. 6A), and in Ikzf1−/− RAW264.7 cells (Fig. 6B, C) infected with B cenocepacia (Fig. 6D).
Figure 5. Ikaros has dual negative and positive regulatory roles in immune effector production in response to LPS.
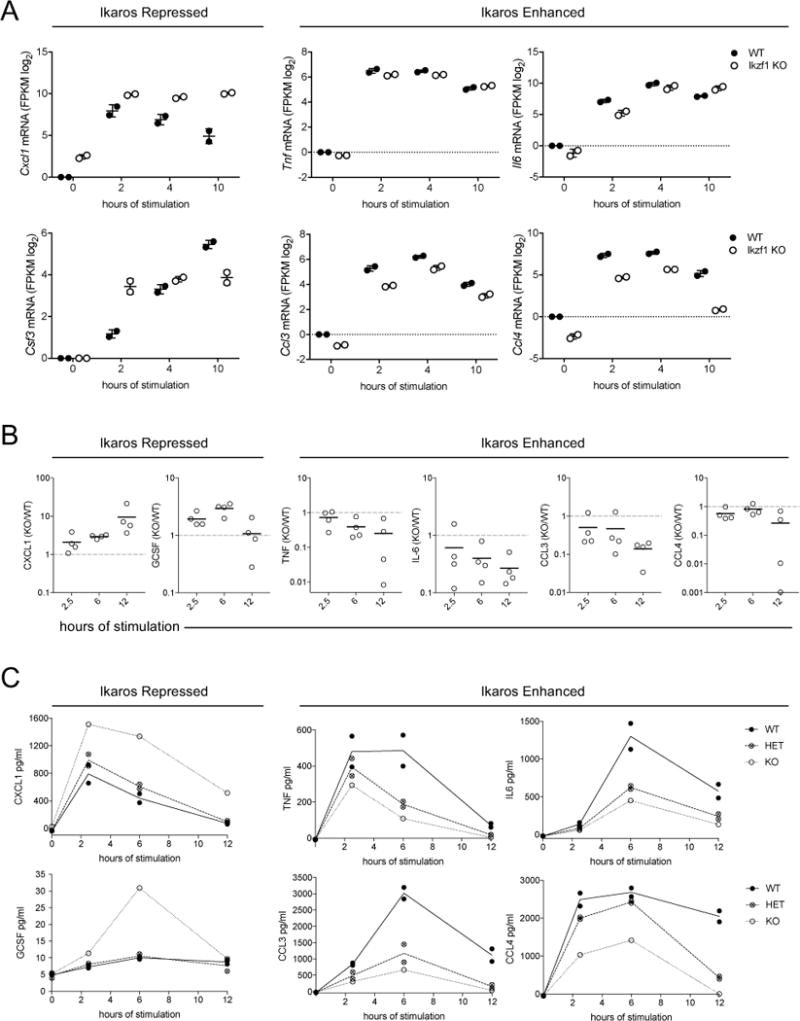
(A) WT and Ikzf1−/− BMDMs were stimulated with 10 ng/ml LPS for 2, 4 and 10 hr and RNA expression levels (fold change log2 FPKM from baseline) were determined by RNA-seq (See also Supplementary file S1). Expression values from replicate samples are shown for select cytokine genes. (B and C) WT, Ikzf1−/−, or Ikzf1+/− BMDM were stimulated with 10 ng/ml LPS for the times indicated and secreted cytokines were quantified by cytometric bead array. (B) Each data point represents one independent experiment (of four total) using cells from an experimentally matched pair of WT and KO mice, with data presented as the cytokine output ratio for KO/WT. (C) One representative experiment from pooled data in panel B, each point representing the average of replicate wells for BMDM from an individual mouse.
Figure 6. Ikaros has dual negative and positive regulatory roles in immune effector production in response to bacterial infection.

(A) WT or Ikzf1+/− BMDM were stimulated with 10 ng/ml LPS or infected with S. typhimurium (S. Tm.) and secreted cytokines were quantified by cytometric bead array. Box plots represent BMDM from 4 WT mice and 5 HET mice, pooled from two independent experiments, and are representative of three experiments. (B) Schematic is shown to indicate the exon targeted for genome editing at the Ikzf1 mouse gene locus in RAW264.7 cells. The guide RNA (gRNA) target sequence is shown with the 3’ NGG PAM sequence, and the resulting genome edit within the gRNA is indicated. (C) Western blot showing ablated Ikaros protein expression in the Ikzf1−/− RAW264.7 cell line. (D) WT and Ikzf1−/− RAW264.7 cells were infected with formalin killed (FK) B. cenocepacia at an MOI of 1 for 24 hr and secreted cytokines were quantified by cytometric bead array. Data are representative of two or more independent experiments.
Considering the substantial effect of Ikaros heterozygosity in the mouse macrophage response, we sought to examine effects of Ikaros expression variation in human myeloid cells . LPS-stimulated monocytes from a specific NIH Clinical Center subject were noted to express lower levels of Ikaros compared to three other healthy donors (Fig. 7A), and this decreased Ikaros expression was coincident with impaired production of the Ikaros-enhanced inflammatory mediators IL-6, TNF, and IL-1b (Fig. 7B). The molecular mechanisms responsible for altered Ikaros regulation in this individual’s family is the subject of ongoing investigation. Heterogeneity in the cytokine response also allowed us to observe a correlation between Ikaros expression and cytokine production at the single cell level. Compared to cytokine negative cells, monocytes producing IL-6, TNF, and IL-1b displayed a higher mean flourescence intensity (MFI) for Ikaros in all subjects tested (Fig. 8A, B). To further address the causal nature of Ikaros expression variation in human cells, we performed siRNA knockdown in human monocyte derived macrophages (MDM). For three independent siRNA tested, we found that IKZF1 knockdown resulted in decreased IL-6 and TNF production, and that the efficiency of knockdown for these siRNA correlated with the degree of cytokine reduction (Fig. 8C). These data from human monocytes and macrophages highlights the importance of this transcription factor, and suggest an important role for Ikaros in regulation of human inflammatory responses in myeloid cells. Together, our mouse and human data are consistent with a model in which quantitative control of Ikaros expression level supports its dichotomous regulatory function.
Figure 7. Ikaros expression level determines inflammatory cytokine output in human monocytes.

Total human PBMC from 1 ‘Ikaros low’ subject and 3 other healthy donors were stimulated with 0.5 μg/ml of LPS for 24 hr in the presence of 5 μg/ml Brefeldin A. Samples were stained intracellularly for (A) Ikaros, and (B) IL-6, TNF and IL-1β, analyzed by flow cytometry, and gated on CD11c+CD14+ monocytes. Shaded histograms in panel B represent unstimulated cells from the same individuals.
Figure 8. Ikaros expression correlates with inflammatory cytokine production at both the person and single cell level.
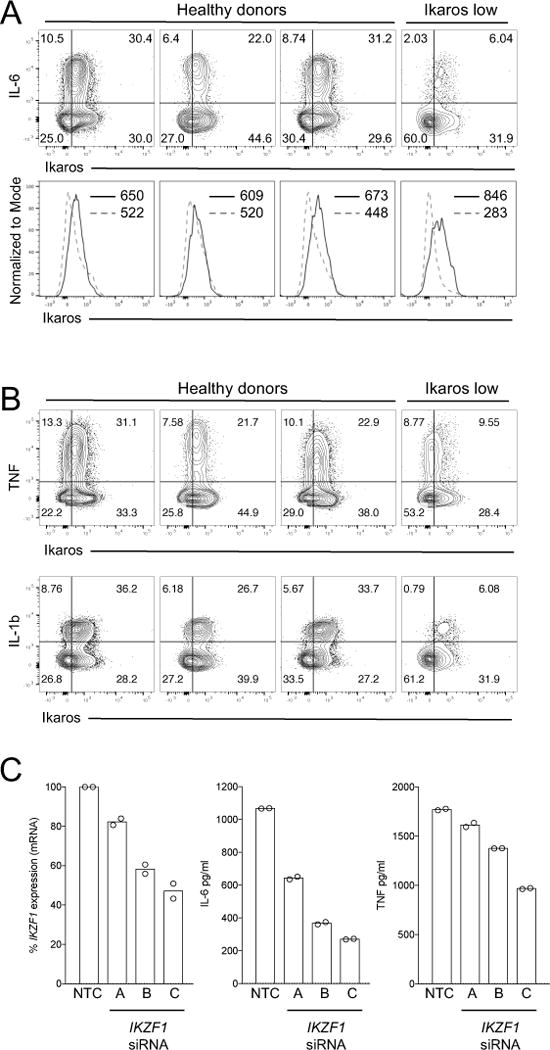
Total human human PBMC from 1 ‘Ikaros low’ subject and 3 other healthy donors were stimulated with 0.5 μg/ml of LPS for 24 hr in the presence of 5 μg/ml Brefeldin A. Samples were stained intracellularly for Ikaros, (A) IL-6 and (B) TNF and IL-1β, analyzed by flow cytometry, and gated on CD11c+CD14+ monocytes. Gating for contour plots in A and B was determined using unstimulated cells. The upper-right quadrants represent cytokine production by Ikaros+ monocytes, with the percentage of cells in each quadrant indicated on the plots. Histograms in panel A represent IL-6 positive cells (solid line histograms) and IL-6 negative cells (dashed line histograms), with the Ikaros MFI for each population shown within the plots. (C) Human MDM were treated with non-targeting control (NTC) siRNA or one of three distinct IKZF1 siRNA for 48 hr prior to IKZF1 quantification or LPS stimulation. Data points represent percent IKZF1 expression from two experiments or the concentration of cytokine detected in replicate wells from one of three representative experiments.
DISCUSSION
We have conducted broad transcriptomic and epigenetic analyses of Ikaros function in primary macrophages during an LPS response time course. This approach has illuminated a dual role for Ikaros in orchestrating the macrophage gene expression response to microbial stimuli; a subset of genes are Ikaros-repressed, while a larger group of genes with late sustained expression characteristics are Ikaros-activated. While there are prior reports of both negative and positive effects of Ikaros on gene expression (23, 24, 37, 38, 43), Ikaros’ mechanisms of action have mostly been characterized in the context of its transcriptional repressor role: in stimulated lymphocytes, Ikaros is found in large repressor complexes associated with chromatin remodeling activities (21). For the subset of LPS-induced genes showing enhanced expression in Ikzf1−/− macrophages, filtering out motifs of the core LPS-activated TF families reveals distinct motifs enriched for known transcriptional repressors. As described in lymphocytes, Ikaros may therefore cooperate with established repressive factors to attenuate expression of specific gene loci during the LPS response.
Considering the established function of Ikaros in transcriptional suppression, we were surprised that a larger proportion of LPS responsive genes were enhanced in the presence of Ikaros. This positive regulatory effect of Ikaros in supporting efficient expression of many LPS-induced immune effector genes was most prominent among late response genes. Furthermore, we demonstrated both enrichment of Ikaros and RelA co-binding at sustained response gene loci and a requirement for Ikaros for long-term LPS-induced RelA chromatin association. These findings are consistent with our prior observation that Ikaros promotes NF-κB positive feedback and sustained NF-κB nuclear occupancy, at least in part through increased RelA protein expression, allowing DNA binding and transcriptional function of NF-κB at late timepoints in the face of induced negative feedback regulators (18). Together, our studies suggest that after macrophages encounter high concentrations of LPS, Ikaros has a prominent role in supporting sustained transcription and NF-κB binding at numerous innate immune response genes. Failure of Ikaros deficient cells to support and sustain late gene expression is also coincident with loss of late LPS-activated chromatin opening. Considering our observations that strongly induced genes have ‘closed’ basal-state promoters and that accessibility increases dramatically after LPS stimulation, together with evidence that secondary response genes require chromatin modification (6, 7), dysregulation of chromatin opening in the absence of Ikaros likely contributes to diminished induction of mid and late LPS response genes. Thus, a constitutively open chromatin state in Ikzf1−/− cells is not in itself sufficient to support robust and late gene expression. Since these cells show diminished or absent RelA binding at LPS-responsive genes, this suggests that the substantial loss of association of important regulatory transcription factors such as NF-κB reflects a defect in a coordinated LPS-induced gene regulatory program that requires both chromatin state change and sustained transcriptional regulator activity.
A role for Ikaros in macrophage chromatin regulation is consistent with the previously reported association of Ikaros with typically repressive chromatin complexes such as NuRD (35, 36) and the polycomb repressive complex 2 (38, 44). Considering that Ikaros interactions with NuRD and the P-TEFb transcriptional elongation complex influence its repressive and activating effects on gene expression (45), Ikaros-NuRD interactions in macrophages may limit gene expression in the basal state, while Ikaros-P-TEFb interactions induced by LPS support activation of transcriptional elongation and facilitate recruitment of critical stimulus-dependent transcription factors such as NF-κB. This is supported by our observation of reduced NuRD binding at LPS-responsive gene loci after ligand activation, with concomitant increases in Ikaros and NF-κB binding. While it remains unclear why constitutively open chromatin that is accessible to transcription factors would not support effective gene induction, it is possible that dysregulation of P-TEFb in Ikzf1−/− cells could underlie suboptimal LPS-induced gene expression. Another possible explanation for the dual roles of Ikaros is suggested by the observation that, similar to several chromatin remodeling enzymes (27), NuRD exhibits both chromatin closing and opening enzymatic activities (46, 47). Since Ikaros constitutively associates with NuRD (35) and has been shown to tightly control its nucleosome-remodeling functions in lymphocytes (48), it is conceivable that NuRD interactions and activities could underlie both of the dual roles we observe for Ikaros during the macrophage response to LPS.
Intriguingly, it has been proposed that the balance between the transcriptionally repressive and activating functions of Ikaros depends on the level of Ikaros expression (45), with higher Ikaros levels favoring activation of P-TEFb, which promotes gene expression. This model is consistent with our observation of increased Ikaros mRNA expression and chromatin occupancy in response to LPS and with our previous finding that Ikaros-mediated NF-κB positive feedback and sustained nuclear occupancy was highly dependent on increased Ikaros expression (18). The model is further supported by the dramatically impaired production of Ikaros-enhanced cytokines in Ikzf1+/− macrophages responding to LPS or S. typhimurium, in contrast to the minimal impact of Ikaros heterozygosity on the Ikaros-repressed cytokines examined. The dose-dependent nature of Ikaros function is particulary interesting in light of the natural human variation we observed. Reduced human Ikaros expression was coincident with impaired LPS-induced production of Ikaros-enhanced inflammatory mediators. We speculate that the repressive function remains intact in individuals with reduced Ikaros expression and this is the subject of ongoing investigation.
In summary, using comprehensive genomic analyses, we have identified a central role for Ikaros in regulation of macrophage chromatin and gene expression in response to LPS. While previous studies have focused on Ikaros function in the lymphoid lineage, we now show that Ikaros deficiency also has a dramatic effect on myeloid cell transcriptional control, where the induced expression of Ikaros in response to LPS and bacteria is vital for robust and sustained expression of numerous inflammatory mediators. Furthermore, our findings suggest that the multi-faceted functions of Ikaros orchestrate multiple phases of gene induction, thus tuning dynamic immune effector expression for appropriate responses to pathogen infection.
Supplementary Material
Acknowledgments
We thank Ron Germain and colleagues in the Laboratory of Systems Biology for helpful discussions and critical reading of the manuscript, Katia Georgopoulos for generously providing the Ikzf1−/− mice, Lars Grøntved and Louis Schiltz for technical support and advice regarding the chromatin assays and Sohyoung Kim for handling the shipment and tracking of the chromatin and RNA samples. All high throughput sequencing was performed at the NCI Center for Cancer Research sequencing facility, Frederick, MD.
Funding
The research reported in this study was generously supported by the Intramural Research Program of the National Institute of Allergy and Infectious Diseases, the National Cancer Institute, and the National Institute on Aging.
Footnotes
Author contributions
Study design and conceptualization, K.S.O., R.A.G., M.H.S. and I.D.C.F; experimental investigation, K.S.O., R.A.G., J.S., M.G.D., G.S., Z.W. and K.S.K.; data analysis and visualization, N.W.L., R.A.G., M.H.S., S.B., and I.D.C.F.; writing – initial draft, I.D.C.F., R.A.G. and N.W.L.; writing – review and editing, M.H.S., K.S.O., R.A.G. and I.D.C.F; supervision, J.D.M., B.D., G.L.H., M.H.S. and I.D.C.F.
Availability of data and materials
The datasets generated and analyzed during the current study are available in the GEO repository (Series GSE93602):
https://www.ncbi.nlm.nih.gov/geo/query/acc.cgi?token=axeryaeennwznkj&acc=GSE93602
Competing interests
The authors declare that they have no competing interests.
References
- 1.Medzhitov R, Preston-Hurlburt P, Janeway CA., Jr A human homologue of the Drosophila Toll protein signals activation of adaptive immunity. Nature. 1997;388:394–397. doi: 10.1038/41131. [DOI] [PubMed] [Google Scholar]
- 2.Poltorak A, He X, Smirnova I, Liu MY, Van Huffel C, Du X, Birdwell D, Alejos E, Silva M, Galanos C, Freudenberg M, Ricciardi-Castagnoli P, Layton B, Beutler B. Defective LPS signaling in C3H/HeJ and C57BL/10ScCr mice: mutations in Tlr4 gene. Science. 1998;282:2085–2088. doi: 10.1126/science.282.5396.2085. [DOI] [PubMed] [Google Scholar]
- 3.Akira S, Uematsu S, Takeuchi O. Pathogen recognition and innate immunity. Cell. 2006;124:783–801. doi: 10.1016/j.cell.2006.02.015. [DOI] [PubMed] [Google Scholar]
- 4.Beutler BA. TLRs and innate immunity. Blood. 2009;113:1399–1407. doi: 10.1182/blood-2008-07-019307. [DOI] [PMC free article] [PubMed] [Google Scholar]
- 5.Foster SL, Medzhitov R. Gene-specific control of the TLR-induced inflammatory response. Clinical immunology. 2009;130:7–15. doi: 10.1016/j.clim.2008.08.015. [DOI] [PMC free article] [PubMed] [Google Scholar]
- 6.Hargreaves DC, Horng T, Medzhitov R. Control of inducible gene expression by signal-dependent transcriptional elongation. Cell. 2009;138:129–145. doi: 10.1016/j.cell.2009.05.047. [DOI] [PMC free article] [PubMed] [Google Scholar]
- 7.Ramirez-Carrozzi VR, Braas D, Bhatt DM, Cheng CS, Hong C, Doty KR, Black JC, Hoffmann A, Carey M, Smale ST. A unifying model for the selective regulation of inducible transcription by CpG islands and nucleosome remodeling. Cell. 2009;138:114–128. doi: 10.1016/j.cell.2009.04.020. [DOI] [PMC free article] [PubMed] [Google Scholar]
- 8.Escoubet-Lozach L, Benner C, Kaikkonen MU, Lozach J, Heinz S, Spann NJ, Crotti A, Stender J, Ghisletti S, Reichart D, Cheng CS, Luna R, Ludka C, Sasik R, Garcia-Bassets I, Hoffmann A, Subramaniam S, Hardiman G, Rosenfeld MG, Glass CK. Mechanisms establishing TLR4-responsive activation states of inflammatory response genes. PLoS genetics. 2011;7:e1002401. doi: 10.1371/journal.pgen.1002401. [DOI] [PMC free article] [PubMed] [Google Scholar]
- 9.Smale ST. Dimer-specific regulatory mechanisms within the NF-kappaB family of transcription factors. Immunological reviews. 2012;246:193–204. doi: 10.1111/j.1600-065X.2011.01091.x. [DOI] [PubMed] [Google Scholar]
- 10.Karin M, Ben-Neriah Y. Phosphorylation meets ubiquitination: the control of NF-[kappa]B activity. Annual review of immunology. 2000;18:621–663. doi: 10.1146/annurev.immunol.18.1.621. [DOI] [PubMed] [Google Scholar]
- 11.Hoffmann A, Baltimore D. Circuitry of nuclear factor kappaB signaling. Immunological reviews. 2006;210:171–186. doi: 10.1111/j.0105-2896.2006.00375.x. [DOI] [PubMed] [Google Scholar]
- 12.Sen R, Baltimore D. Inducibility of kappa immunoglobulin enhancer-binding protein Nf-kappa B by a posttranslational mechanism. Cell. 1986;47:921–928. doi: 10.1016/0092-8674(86)90807-x. [DOI] [PubMed] [Google Scholar]
- 13.Ghosh S, May MJ, Kopp EB. NF-kappa B and Rel proteins: evolutionarily conserved mediators of immune responses. Annual review of immunology. 1998;16:225–260. doi: 10.1146/annurev.immunol.16.1.225. [DOI] [PubMed] [Google Scholar]
- 14.Nelson DE, Ihekwaba AE, Elliott M, Johnson JR, Gibney CA, Foreman BE, Nelson G, See V, Horton CA, Spiller DG, Edwards SW, McDowell HP, Unitt JF, Sullivan E, Grimley R, Benson N, Broomhead D, Kell DB, White MR. Oscillations in NF-kappaB signaling control the dynamics of gene expression. Science. 2004;306:704–708. doi: 10.1126/science.1099962. [DOI] [PubMed] [Google Scholar]
- 15.Sung MH, Salvatore L, De Lorenzi R, Indrawan A, Pasparakis M, Hager GL, Bianchi ME, Agresti A. Sustained oscillations of NF-kappaB produce distinct genome scanning and gene expression profiles. PLoS One. 2009;4:e7163. doi: 10.1371/journal.pone.0007163. [DOI] [PMC free article] [PubMed] [Google Scholar]
- 16.Werner SL, Kearns JD, Zadorozhnaya V, Lynch C, O’Dea E, Boldin MP, Ma A, Baltimore D, Hoffmann A. Encoding NF-kappaB temporal control in response to TNF: distinct roles for the negative regulators IkappaBalpha and A20. Genes & development. 2008;22:2093–2101. doi: 10.1101/gad.1680708. [DOI] [PMC free article] [PubMed] [Google Scholar]
- 17.Tay S, Hughey JJ, Lee TK, Lipniacki T, Quake SR, Covert MW. Single-cell NF-kappaB dynamics reveal digital activation and analogue information processing. Nature. 2010;466:267–271. doi: 10.1038/nature09145. [DOI] [PMC free article] [PubMed] [Google Scholar]
- 18.Sung MH, Li N, Lao Q, Gottschalk RA, Hager GL, Fraser ID. Switching of the relative dominance between feedback mechanisms in lipopolysaccharide-induced NF-kappaB signaling. Sci Signal. 2014;7:ra6. doi: 10.1126/scisignal.2004764. [DOI] [PMC free article] [PubMed] [Google Scholar]
- 19.Dev A, Iyer S, Razani B, Cheng G. NF-kappaB and innate immunity. Curr Top Microbiol Immunol. 2011;349:115–143. doi: 10.1007/82_2010_102. [DOI] [PubMed] [Google Scholar]
- 20.Georgopoulos K, Bigby M, Wang JH, Molnar A, Wu P, Winandy S, Sharpe A. The Ikaros gene is required for the development of all lymphoid lineages. Cell. 1994;79:143–156. doi: 10.1016/0092-8674(94)90407-3. [DOI] [PubMed] [Google Scholar]
- 21.Rebollo A, Schmitt C. Ikaros, Aiolos and Helios: transcription regulators and lymphoid malignancies. Immunol Cell Biol. 2003;81:171–175. doi: 10.1046/j.1440-1711.2003.01159.x. [DOI] [PubMed] [Google Scholar]
- 22.Georgopoulos K. Haematopoietic cell-fate decisions, chromatin regulation and ikaros. Nature reviews Immunology. 2002;2:162–174. doi: 10.1038/nri747. [DOI] [PubMed] [Google Scholar]
- 23.Koipally J, Heller EJ, Seavitt JR, Georgopoulos K. Unconventional potentiation of gene expression by Ikaros. J Biol Chem. 2002;277:13007–13015. doi: 10.1074/jbc.M111371200. [DOI] [PubMed] [Google Scholar]
- 24.Koipally J, Renold A, Kim J, Georgopoulos K. Repression by Ikaros and Aiolos is mediated through histone deacetylase complexes. The EMBO journal. 1999;18:3090–3100. doi: 10.1093/emboj/18.11.3090. [DOI] [PMC free article] [PubMed] [Google Scholar]
- 25.Miranda TB, Voss TC, Sung MH, Baek S, John S, Hawkins M, Grontved L, Schiltz RL, Hager GL. Reprogramming the chromatin landscape: interplay of the estrogen and glucocorticoid receptors at the genomic level. Cancer Res. 2013;73:5130–5139. doi: 10.1158/0008-5472.CAN-13-0742. [DOI] [PMC free article] [PubMed] [Google Scholar]
- 26.Nelson JD, Denisenko O, Bomsztyk K. Protocol for the fast chromatin immunoprecipitation (ChIP) method. Nature protocols. 2006;1:179–185. doi: 10.1038/nprot.2006.27. [DOI] [PubMed] [Google Scholar]
- 27.Morris SA, Baek S, Sung MH, John S, Wiench M, Johnson TA, Schiltz RL, Hager GL. Overlapping chromatin-remodeling systems collaborate genome wide at dynamic chromatin transitions. Nat Struct Mol Biol. 2014;21:73–81. doi: 10.1038/nsmb.2718. [DOI] [PMC free article] [PubMed] [Google Scholar]
- 28.John S, Sabo PJ, Thurman RE, Sung MH, Biddie SC, Johnson TA, Hager GL, Stamatoyannopoulos JA. Chromatin accessibility pre-determines glucocorticoid receptor binding patterns. Nat Genet. 2011;43:264–268. doi: 10.1038/ng.759. [DOI] [PMC free article] [PubMed] [Google Scholar]
- 29.Baek S, Sung MH. Genome-Scale Analysis of Cell-Specific Regulatory Codes Using Nuclear Enzymes. Statistical Genomics: Methods and Protocols. 2016;1418:225–240. doi: 10.1007/978-1-4939-3578-9_12. [DOI] [PMC free article] [PubMed] [Google Scholar]
- 30.Bailey TL. DREME: motif discovery in transcription factor ChIP-seq data. Bioinformatics. 2011;27:1653–1659. doi: 10.1093/bioinformatics/btr261. [DOI] [PMC free article] [PubMed] [Google Scholar]
- 31.Bailey TL, Boden M, Buske FA, Frith M, Grant CE, Clementi L, Ren J, Li WW, Noble WS. MEME SUITE: tools for motif discovery and searching. Nucleic acids research. 2009;37:W202–208. doi: 10.1093/nar/gkp335. [DOI] [PMC free article] [PubMed] [Google Scholar]
- 32.Gotea V, Ovcharenko I. DiRE: identifying distant regulatory elements of co-expressed genes. Nucleic acids research. 2008;36:W133–139. doi: 10.1093/nar/gkn300. [DOI] [PMC free article] [PubMed] [Google Scholar]
- 33.Pennacchio LA, Loots GG, Nobrega MA, Ovcharenko I. Predicting tissue-specific enhancers in the human genome. Genome research. 2007;17:201–211. doi: 10.1101/gr.5972507. [DOI] [PMC free article] [PubMed] [Google Scholar]
- 34.Schmid-Burgk JL, Schmidt T, Gaidt MM, Pelka K, Latz E, Ebert TS, Hornung V. OutKnocker: a web tool for rapid and simple genotyping of designer nuclease edited cell lines. Genome research. 2014;24:1719–1723. doi: 10.1101/gr.176701.114. [DOI] [PMC free article] [PubMed] [Google Scholar]
- 35.Kim J, Sif S, Jones B, Jackson A, Koipally J, Heller E, Winandy S, Viel A, Sawyer A, Ikeda T, Kingston R, Georgopoulos K. Ikaros DNA-binding proteins direct formation of chromatin remodeling complexes in lymphocytes. Immunity. 1999;10:345–355. doi: 10.1016/s1074-7613(00)80034-5. [DOI] [PubMed] [Google Scholar]
- 36.Sridharan R, Smale ST. Predominant interaction of both Ikaros and Helios with the NuRD complex in immature thymocytes. J Biol Chem. 2007;282:30227–30238. doi: 10.1074/jbc.M702541200. [DOI] [PubMed] [Google Scholar]
- 37.Sabbattini P, Lundgren M, Georgiou A, Chow C, Warnes G, Dillon N. Binding of Ikaros to the lambda5 promoter silences transcription through a mechanism that does not require heterochromatin formation. The EMBO journal. 2001;20:2812–2822. doi: 10.1093/emboj/20.11.2812. [DOI] [PMC free article] [PubMed] [Google Scholar]
- 38.Ross J, Mavoungou L, Bresnick EH, Milot E. GATA-1 utilizes Ikaros and polycomb repressive complex 2 to suppress Hes1 and to promote erythropoiesis. Molecular and cellular biology. 2012;32:3624–3638. doi: 10.1128/MCB.00163-12. [DOI] [PMC free article] [PubMed] [Google Scholar]
- 39.Gowri PM, Yu JH, Shaufl A, Sperling MA, Menon RK. Recruitment of a repressosome complex at the growth hormone receptor promoter and its potential role in diabetic nephropathy. Molecular and cellular biology. 2003;23:815–825. doi: 10.1128/MCB.23.3.815-825.2003. [DOI] [PMC free article] [PubMed] [Google Scholar]
- 40.Prada I, Marchaland J, Podini P, Magrassi L, D’Alessandro R, Bezzi P, Meldolesi J. REST/NRSF governs the expression of dense-core vesicle gliosecretion in astrocytes. J Cell Biol. 2011;193:537–549. doi: 10.1083/jcb.201010126. [DOI] [PMC free article] [PubMed] [Google Scholar]
- 41.Takeda M, Mizuide M, Oka M, Watabe T, Inoue H, Suzuki H, Fujita T, Imamura T, Miyazono K, Miyazawa K. Interaction with Smad4 is indispensable for suppression of BMP signaling by c-Ski. Mol Biol Cell. 2004;15:963–972. doi: 10.1091/mbc.E03-07-0478. [DOI] [PMC free article] [PubMed] [Google Scholar]
- 42.Winandy S, Wu P, Georgopoulos K. A dominant mutation in the Ikaros gene leads t rapid development of leukemia and lymphoma. Cell. 1995;83:289–299. doi: 10.1016/0092-8674(95)90170-1. [DOI] [PubMed] [Google Scholar]
- 43.Zarnegar MA, Rothenberg EV. Ikaros represses and activates PU.1 cell-type-specifically through the multifunctional Sfpi1 URE and a myeloid specific enhancer. Oncogene. 2012;31:4647–4654. doi: 10.1038/onc.2011.597. [DOI] [PMC free article] [PubMed] [Google Scholar]
- 44.Reynolds N, Salmon-Divon M, Dvinge H, Hynes-Allen A, Balasooriya G, Leaford D, Behrens A, Bertone P, Hendrich B. NuRD-mediated deacetylation of H3K27 facilitates recruitment of Polycomb Repressive Complex 2 to direct gene repression. The EMBO journal. 2012;31:593–605. doi: 10.1038/emboj.2011.431. [DOI] [PMC free article] [PubMed] [Google Scholar]
- 45.Bottardi S, Mavoungou L, Pak H, Daou S, Bourgoin V, Lakehal YA, Affarel B, Milot E. The IKAROS interaction with a complex including chromatin remodeling and transcription elongation activities is required for hematopoiesis. PLoS genetics. 2014;10:e1004827. doi: 10.1371/journal.pgen.1004827. [DOI] [PMC free article] [PubMed] [Google Scholar]
- 46.Tong JK, Hassig CA, Schnitzler GR, Kingston RE, Schreiber SL. Chromatin deacetylation by an ATP-dependent nucleosome remodelling complex. Nature. 1998;395:917–921. doi: 10.1038/27699. [DOI] [PubMed] [Google Scholar]
- 47.Zhang Y, LeRoy G, Seelig HP, Lane WS, Reinberg D. The dermatomyositis-specific autoantigen Mi2 is a component of a complex containing histone deacetylase and nucleosome remodeling activities. Cell. 1998;95:279–289. doi: 10.1016/s0092-8674(00)81758-4. [DOI] [PubMed] [Google Scholar]
- 48.Zhang J, Jackson AF, Naito T, Dose M, Seavitt J, Liu F, Heller EJ, Kashiwagi M, Yoshida T, Gounari F, Petrie HT, Georgopoulos K. Harnessing of the nucleosome-remodeling-deacetylase complex controls lymphocyte development and prevents leukemogenesis. Nat Immunol. 2011;13:86–94. doi: 10.1038/ni.2150. [DOI] [PMC free article] [PubMed] [Google Scholar]
Associated Data
This section collects any data citations, data availability statements, or supplementary materials included in this article.