Abstract
Background:
In the US, obesity is an epidemiologic challenge and the population fails to comprehend this complex public health issue. To evaluate underlying obesity-impact patterns on mortality rates, we data-mined the 1999–2016 Center for Disease Control WONDER database’s vital records.
Methods:
Adopting SAS programming, we scrutinized the mortality and population counts. Using ICD-10 diagnosis codes connected to overweight and obesity, we obtained the obesity-related crude and age-adjusted causes of death. To understand divergent and prevalence trends we compared and contrasted the tabulated obesity-influenced mortality rates with demographic information, gender, and age-related data.
Key Results:
From 1999 to 2016, the obesity-related age-adjusted mortality rates increased by 142%. The ICD-10 overweight and obesity-related death-certificate coding showed clear evidence that obesity factored in the male age-adjusted mortality rate increment to 173% and the corresponding female rate to 117%. It also disproportionately affected the nation-wide minority population death rates. Furthermore, excess weight distributions are coded as contributing features in the crude death rates for all decennial age-groups.
Conclusions:
The 1999–2016 data from ICD-10 death certificate coding for obesity-related conditions indicate that it is affecting all segments of the US population.
Keywords: obesity, overweight, mortality rates, ICD-10
1. Introduction
The span of the United States (US) adult obesity rate has arrived at a point where its colossal consequential risks are associated with burdensome public health concerns (Abarca-Gómez et al., 2017; Wyatt et al., 2006). Major peer-reviewed articles have documented that the US population has basic understanding and awareness of obesity’s incidence rate and its proportional detrimental health prevalence (Rosenthal et al., 2017). What’s more, the cost of managing obesity within the overall economy is well cited and understood (Colditz, 1999; Guarneri, 2017).
Several longitudinal studies have directly correlated the adverse obesity impacts on human health (Chang et al., 2017; Fitzmaurice et al., 2017; Probst et al., 2004). Body-mass index (BMI) assessments are shown to be both, consequential (Klatsky et al., 2017; Preston et al., 2018), and as being less important (Chang et al., 2017; Kennedy et al., 2018). However, several extensive investigations have made clear that obesity does lead to persistent, long-standing, non-communicable health conditions that require sustained medical interventions (Després et al., 2001; Katz et al., 2000; Poulain et al., 2008; Wahba et al., 2007).
For official morbidity and mortality statistics, the Center for Disease Control (CDC) Wide-ranging Online Data for Epidemiologic Research (WONDER) database (Friede et al., 1993), presents descriptive tabulations of the US populations vital information incorporating the International Classification of Diseases 10th Revision (ICD-10) coding (Bowman, 2008; Weiner, 2018). Due to healthcare’s cumbersome workflow nature, inaccuracies in ICD-10 coding with misrepresentation in patient data (Lebovitz et al., 2018) are known to occur. Nonetheless, sensitivities of ICD-10 coding for overweight and obesity have proven to be reasonably accurate and helpful (George et al., 2018; Flegal et al., 2007; Keller et al., 2018; Yang et al., 2017). In addition, studies that assessed the accuracy of the ICD-diagnostic codes determined their conspicuous usefulness in empirical research (O’Malley et al., 2005), and in chronic disease management programs (Krueger et al., 2001; Vandyk et al., 2015).
To seek viable solutions that tackle the various aspects of adult obesity, big-data approaches are being employed (Barrett et al., 2013; Cutler et al., 2003; Jin et al., 2016; Wang et al., 2007). This real-time data-abundance revolution has positively impacted public health (Khoury et al., 2014; Murdoch et al., 2013) and public health policy (Athey, 2017; Beam et al., 2018). As a result, the university community has escalated its graduate and undergraduate data-science curriculum to include big-data analysis tools to advance the understanding of the trends in social lifestyle diseases (Elgin et al., 2017; De Veaux et al., 2017).
Through a self-reported BMI survey-study (D’Souza et al., 2015), Delaware’s minority-serving, predominantly undergraduate, Wesley College (Wesley), found that 49.3% of its student body was either overweight (29.5%) or obese (19.8%). To further educate its students on human-health issues, the College revised its liberal arts core-curriculum (D’Souza et al., 2016) to incorporate experiential experiences in public health topics, and introduced course-embedded Statistical Analysis System (SAS) data-mining and geo-spatial analysis (using ArcGIS) training, available to all undergraduate majors (D’Souza et al., 2017; D’Souza et al., 2015; D’Souza et al., 2017). To accommodate such ongoing curricula changes and accessibility to dynamic undergraduate research projects within an all-encompassing umbrella, the College in 2017, launched the Undergraduate Center for Analytics, Talent, and Success (UR-CATS).
Using open-source data coupled with ArcGIS and SAS techniques, Wesley undergraduates have shown (D’Souza et al., 2015) that US obesity rates were directly associated with the social inequalities of income and education. This same study also showed that age and education were key obesity risk factors within the State of Delaware. Furthermore, a senior honors capstone project (D’Souza et al., 2017) analyzed the 1999–2014 CDC WONDER Delaware death records where an ICD-10 code for overweight and obesity was listed as a contributing factor and found that the 2014 age-adjusted Delaware obesity-related mortality rates increased by 28.7%.
Acknowledging the ICD-10 coding limitations (Lebovitz et al., 2018), but spurred on by its merits in obesity reports and studies (D’Souza et al., 2017; George et al., 2018, Flegal et al., 2007; Keller et al., 2018; O’Malley et al., 2005; Yang et al., 2017), this observational retrospective undertaking, uses the CDC WONDER database (Friede et al., 1993), to evaluate the 1999–2016 multiple causes of death information, to pursue important insights, associations, and shifting trends in the US death rates where there was any mention of overweight and obesity on the death certificate. Information from such a study is helpful as it can enhance public perceptions on body fat for inducing positive, individual, behavioral change.
2. Methods
For all US residents, the CDC WONDER compressed mortality files (Friede et al., 1993) lists population counts, numbers of deaths, age-adjusted and crude death rates (at 95% confidence intervals), manner-of-death (4-digit ICD-10 code or group of codes), age groups, gender, and demographic data. To gain access to this query-based database, requires a signed consent form. The entry to this rich source of statistical research data is described (in detail) elsewhere (D’Souza et al., 2017), and is through search/browse variables and the structured query language (SQL). For all 50 US States, the entire mortality dataset, pre-constructed subsets, or customized subsets of the data were downloaded into MS Excel and SAS files. The age-adjusted mortality rates per 100,000 are available in CDC WONDER and are calculated using Equation 1 (D’Souza et al., 2017).
The age-adjusted mortality rates are statistical processes that are used to compare death rates in populations with differing age groups, while the annual crude death rates are ratio of deaths for any given age group. In this extensive 1999–2016 investigation of ICD-10 coded overweight and obesity-related counting of deaths, a total of 459,528 mortality records were compiled, of which 231,431 were male and 228,097 were female. Additionally, for our analyses on race and ethnicity, the numbers of deceased for the White, Black or African-American, Asian, and American Indian or Alaskan Native populations were, 369,859, 80,517, 4,034, and 5,118, respectively.
3. Results and Discussion
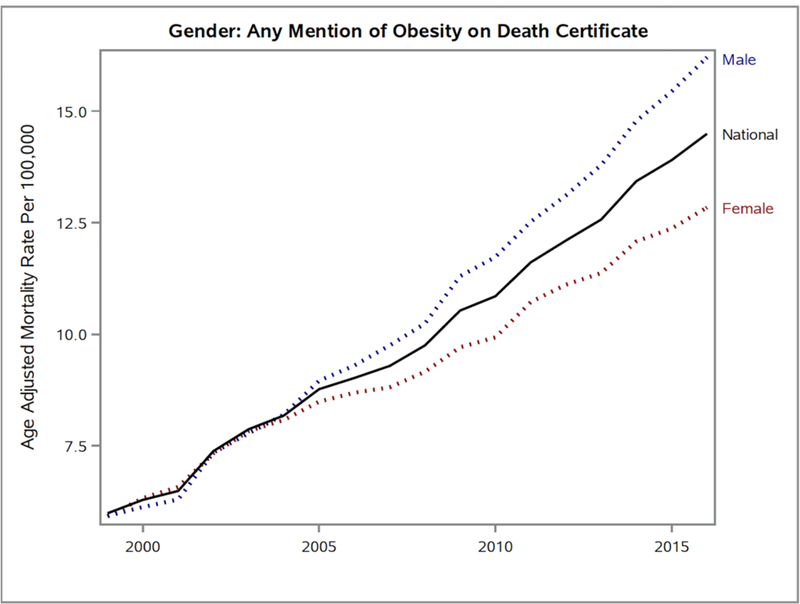
Figure 1 provides a 1999–2016 national baseline comparison for race and ethnicity, while Figure 2 depicts the nation-wide combined effects of gender variation in the obesity-mortality relationship. Both Figures 1 and 2, show dramatic rises in mortality rates where an ICD-10 code for overweight and obesity mentioned excess weight as a contributory factor on the death certificate.
Figure 1. A SAS Generated Line Graph Showing the Disparities Due to Race, on Age-Adjusted Mortality Rates, Where There Was Any Mention of Obesity on the Death Record.
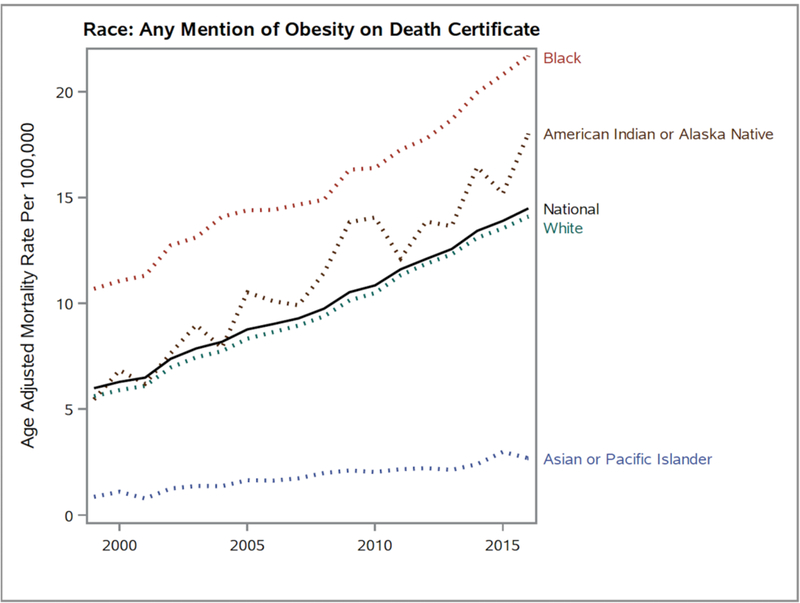
Figure 2. A 1999–2016 SAS Generated Line Graph Indicating Gender Differences from the National Age-Adjusted Mortality Rates Where Obesity Was Mentioned on the Death Record.
In Figure 1, the 1999 average age-adjusted mortality rate rose from 5.99 (95% confidence interval [CI], 5.89–6.1) to 14.49 (95% CI, 14.35–14-64) in 2016. This very significant 141.90% mortality rate increase was due to conditions that were linked to being obese or overweight as noted by an ICD-10 code on the 1999–2016 death records.
For the White race (Figure 1), the distribution of the age-adjusted mortality rates where there was an ICD-10 overweight and obesity code on the death record, comprehensively mimicked the national average. It rose from 5.61 (95% CI, 5.5–5.72) in 1999 to 14.1 (95% CI, 13.94–14.26) in 2016, which is a staggering 151.34% increase. Factors that contribute to such national mortality rate similarity are consistent with chronicled acute obesity-related health data and are coupled with the US society’s poor eating and sleep habits, increased screen-time, and physical inactivity (Abarca-Gómez et al., 2017; Chang et al., 2017; Cutler et al., 2003; Després et al., 2001; Flegal et al., 2007; Jin et al., 2016; Kennedy et al., 2018; Klatzy et al., 2017; Poulain et al., 2008; Wahba et al., 2007; Wang et al., 2007; Wyatt et al., 2006).
Prior published data has showed that American Indian or Alaska Native adults have less access to public health resources and generally do not take part in leisure-time activities (Probst et al., 2004). Amongst the four major racial groups profiled in Figure 1, the American Indian or Alaska Native group, at 230.04%, had the highest 17-year change in age-adjusted mortality rate, where an ICD-10 overweight and obesity code was recorded on the death certificate. In 1999, its mortality rate was 5.46 (95% CI, 4.22–6.95) and through 2016, in a vacillating ascent, the rate rose to 18.02 (95% CI, 16.48–19.56).
On the other hand, for the Black or African-American population, there is a serious consistent above-average annual deviation from the Figure 1 median (national rate) curvature for the age-adjusted mortality rates where excess abdominal fat was a contributing factor. The mortality rate jumped from a very high 10.69 (95% CI, 10.25–11.12) in 1999, to 21.7 (95% CI, 21.19–22.2) in 2016. Overall, the 102.99% 17-year increase does not seem powerful as the escalated numbers observed for the other races, but the Black or African-American 1999–2016 mortality-rate milestones are persistently several points higher than the national average. For this population, such troubling indicators are (unfortunately) in line with expectations as nationally, we have continually failed to stem this groups economic instability and healthcare disparities (Chang et al., 2017; D’Souza et al., 2017; Flegal et al., 2007; Katz et al., 2000; Poulain et al., 2008; Preston et al., 2018; Probst et al., 2004; Rosenthal et al., 2017; Wang et al., 2007; Wyatt et al., 2006).
The exceedingly lower-than-average orientation from the national reference (Figure 1) in overweight and obesity-related age-adjusted mortality rates for Asian or Pacific Islanders is not unexpected and can be rationally explained by existing epidemiological obesity-specific data and the consequential cultural differences between Asian-Americans (Wang et al., 2007). However, the realities of suffering from the complications of being overweight or obese in this citizenry is reflected in the enormous (211.63%) rise in obesity-influenced age-adjusted mortality rates, from a very low 0.86 (95% CI, 0.66–1.1) value in 1999 to 2.68 (95% CI, 2.43–2.93) in 2016.
From 1999 to 2004–2005, Figure 2 shows that the two genders acquiesce within the national trendline but after 2005, significant digressions occur. As a result, the 1999–2016 age-adjusted mortality rate increment where an ICD-10 overweight and obesity code is listed as an influential factor, is 173.19% for males, and 116.89% for females. The 1999 and 2016 values were 5.93 (95% CI, 5.78–6.08) and 16.2 (95% CI, 15.98–16.42) for males, and 5.92 (95% CI, 5.78–6.06) and 12.84 (95% CI, 12.66–13.03) for females, respectively. Such contrasting gender-related divergences agree with current investigative clinical-research data, that show that men are more likely to accumulate visceral fat that is associated with major negative impacts on human health (Després et al., 2001; Flegal et al., 2007; Kennedy et al., 2018; Klatsky et al., 2017; Poulain et al., 2008; Wahba et al., 2007; Wang et al., 2007; Wyatt et al., 2006).
To further tease apart any sex-difference facets within the two dominant US races, Figures 3 and 4, with 95% confidence intervals, portray the very distinct gender variations observed for the White and the Black or African American races. In Figure 3, throughout the 1999–2016 time-period, a complete separation is observed between the 95% confidence intervals for the White male and White female ICD-10 overweight and obesity-coded mortality rates. In addition, from 1999 to 2016, White males saw a significant increase (176.03%) in overweight and obesity influenced mortality rates while for White females the corresponding rate was lower (129.36%), but the gap is increasing. Also, in around 2005, the age-adjusted obesity-related mortality rates for White men began to trend above the national average. Such a movement could epitomize previously recorded White gender-differentiated cultural norms (Abarca-Gómez et al., 2017; Cutler et al., 2003; Keller et al., 2018; Probst et al., 2004; Wyatt et al., 2006) and their psychological well-being perceptions with regards to weight (Guarneri, 2017; Jin et al., 2016; Kennedy et al., 2018; Klatsky et al., 2017; Wang et al., 2007).
Figure 3. A 1999–2016 SAS Generated Line Graph Indicating Gender Differences from the National Age-Adjusted Mortality Rates for Whites Where Obesity Was Mentioned on the Death Record.
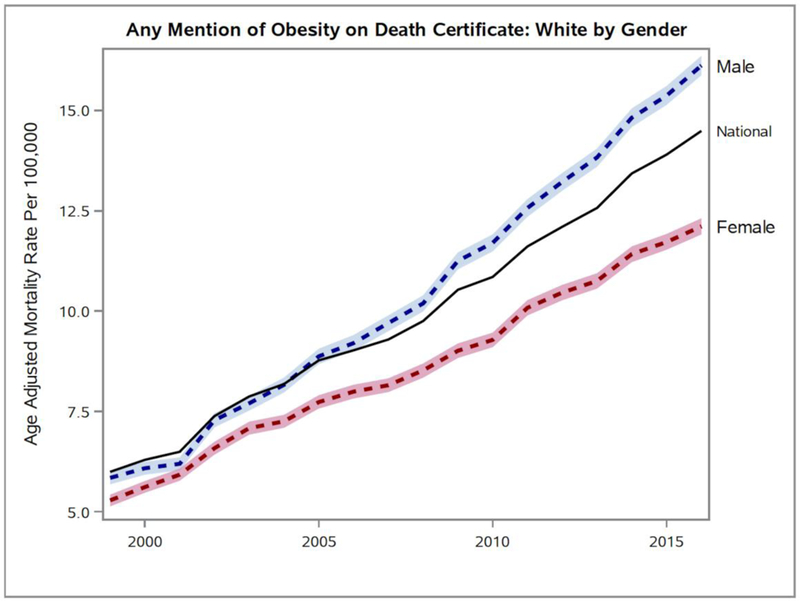
Figure 4. A 1999–2016 SAS Generated Line Graph Indicating Gender Differences from the National Age-Adjusted Mortality Rates for Blacks or African Americans Where Obesity Was Mentioned on the Death Record.
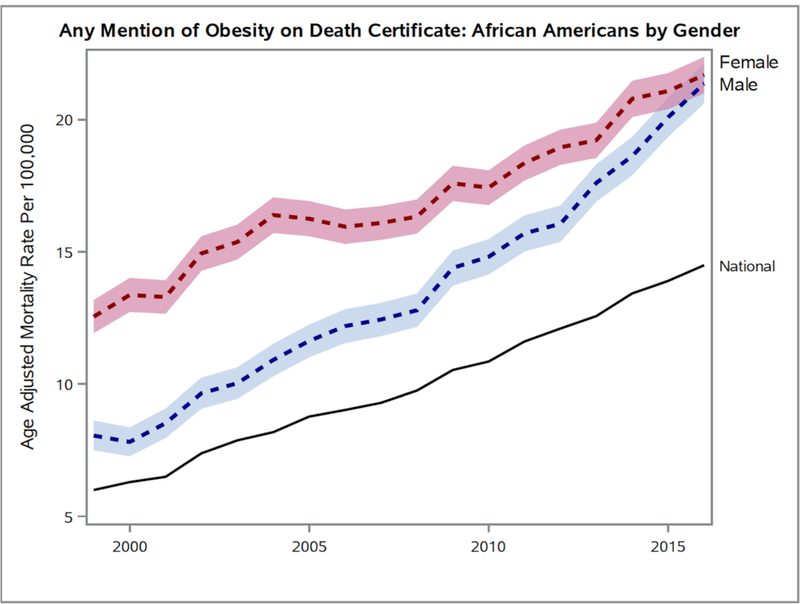
In Figure 4, the 1999–2014 ICD-10 coded overweight and obesity-related age-adjusted mortality rate separations for Black or African American females and males are far-above the national average and between the two genders, the 95% confidence intervals begin to converge in 2015–2016. Additionally, the 1999–2016 mortality rates for Black or African-American females is undeniably higher and is possibly parallel to existing cultural and/or economic benchmarks (Abarca-Gómez et al., 2017; Cutler et al., 2003; D’Souza et al., 2015; Kennedy et al., 2018; Klatzky et al., 2017; Wang et al., 2007), and the current dysfunction with access to healthcare resources (Chang et al., 2017; Jin & Yu, 2016; Keller et al., 2018; Preston et al., 2018; Rosenthal et al., 2017; Wyatt et al., 2006). Nonetheless, the 1999 to 2016 overweight and obesity-influenced mortality rate for Black or African-American females largely increased by 72.83%, which pales in comparison to the exponential 165.34% increase in the corresponding age-adjusted mortality rates containing ICD-10 overweight and obesity diagnostic codes, for Black or African-American males.
First in Table 1 and then in Figure 5, the CDC WONDER age-adjusted mortality rate national data set where an ICD-10 overweight and obesity code is marked off on the death certificate, is organized according to decennial age-groups. Surprisingly in 2016, for the youngest (15–24) and oldest (85+) age groups, there was a >95% (95.45% and 95.55%, respectively) increase in the crude death rates where being overweight and obese are listed as contributory factors. The 2016 data for the other six age groups, show surging crude death rates where the role of excess weight is noted on the death record. The 2016 crude death rates increased by 142.68%, 174.93%, 138.04%, 132.22%, 140.25%, and 152.02% for the age-groups, 25–34, 35–44, 45–54, 55–64, 65–74, and 75–84, respectively.
Table 1.
Crude Death Rates by Decennial Age-Groups
| Year | Age-Group | Crude Rate | 95% CI |
|---|---|---|---|
| 1999 | 15–24 | 0.44 | [0.37, 0.51] |
| 25–34 | 1.57 | [1.44, 1.69] | |
| 35–44 | 3.79 | [3.61, 3.97] | |
| 45–54 | 7.94 | [7.66, 8.23] | |
| 55–64 | 11.98 | [11.54, 12.42] | |
| 65–74 | 14.16 | [13.62, 14.70] | |
| 75–84 | 13.13 | [12.49, 13.77] | |
| 85+ | 11.46 | [10.43, 12.49] | |
| 2016 | 15–24 | 0.86 | [0.77, 0.95] |
| 25–34 | 3.81 | [3.63, 3.99] | |
| 35–44 | 10.42 | [10.11, 10.74] | |
| 45–54 | 18.90 | [18.49, 19.32] | |
| 55–64 | 27.82 | [27.31, 28.33] | |
| 65–74 | 34.02 | [33.35, 34.70] | |
| 75–84 | 33.09 | [32.15, 34.04] | |
| 85+ | 22.41 | [21.25, 23.57] |
Note. CI = Confidence Interval.
Figure 5. A 1999–2016 SAS generated line graph indicating age-group differences from the National Age-Adjusted Mortality Rates Where Obesity Was Mentioned on the Death Record.
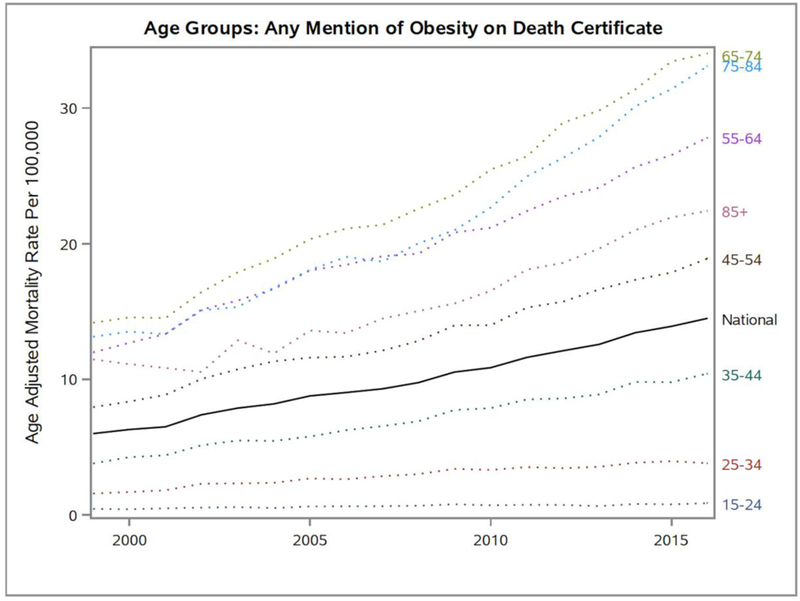
The Figure 5 graph clearly depicts that obesity played some role in the general ill-health and the eventual death for all of the listed decennial age groups. In the 45–54 and older age-group, when ICD-10 overweight and obesity-coded associated conditions were indicated on the death record, the crude death rates were higher than the national average, but they were below in the 35–44 and lower age groups. However, the 35–44 age-group did experience the highest 1999–2016 crude death rate increase (174.93%). The rises in ICD-10 coded deaths among the “middle and above” age groups are clearly being driven by declining health conditions associated with the burdens of being overweight and obese (Abarca-Gómez et al., 2017; Chang et al., 2017; Cutler et al., 2003; Després et al., 2001; Flegal et al., 2007; Jin & Yu, 2016; Kennedy et al., 2018; Klatzy et al., 2017; Poulain et al., 2008; Wahba et al., 2007; Wang et al., 2007; Wyatt et al., 2006).
4. Conclusions
Analyzing the 1999–2016 CDC WONDER mortality data when an ICD-10 overweight and obesity-code is flagged, identifies the divergence in the accrual of mortality rate trends for race and ethnicity, gender, and age-groups. The gender gap for age-adjusted mortality rates where excess weight is an indicated contributory factor, is widening. More pronounced racial differences from the national average age-adjusted mortality rate pattern, gives a compelling indication that disturbing obesity-related declines in overall health is complicated but prevalent in the underrepresented populations. The rates have also demonstrated that the cumulative economic and healthcare disadvantages for Black or African-American females and males has made obesity to be the underappreciated driver that systematically grows their longer-term age-adjusted mortality rate trend to be well-above the national mean. Big increases in the crude mortality rates were observed in the middle-age groups where broadening weight-related challenges are responsible for key chronic health conditions.
We believe that this examination of obesity at the time of death is likely yielding a marked underestimate of the impact of obesity on mortality. However, the statistics presented provide compelling evidence for the compounding unhealthy nature of excess abdominal body fat on chronic health conditions. Such outcomes provide useful information to improve public perceptions on weight control disparities and promotes constructive discussions to frame the importance of beginning proactive initiatives to reduce weight for optimum health.
Acknowledgements
This work was made possible by grants from the National Institute of General Medical Sciences grant – NIGMS P20 GM103446 from the National Institutes of Health, the National Science Foundation EPSCoR Grant No. IIA-1301765, the NASA Delaware Space Grant Consortium grant program (NNX15AI19H), the NSF DUE S-STEM grant (1355554), and the State of Delaware. The findings and conclusions drawn from this program are solely those of the authors and in no way, reflect the interpretations and/or views of any other federal or state agency.
References
- Abarca-Gómez L, Abdeen ZA, Hamid ZA, Abu-Rmeileh NM, Acosta-Cazares B, Acuin C, … Agyemang C (2017). Worldwide trends in body-mass index, underweight, overweight, and obesity from 1975 to 2016: A pooled analysis of 2416 population-based measurement studies in 128.9 million children, adolescents, and adults. The Lancet, 390(10113), 2627–2642. 10.1016/S0140-6736(17)32129-3 [DOI] [PMC free article] [PubMed] [Google Scholar]
- Athey S (2017). Beyond prediction: Using big data for policy problems. Science, 355(6324), 483–485. 10.1126/science.aal4321 [DOI] [PubMed] [Google Scholar]
- Barrett MA, Humblet O, Hiatt RA, & Adler NE (2013). Big data and disease prevention: From quantified self to quantified communities. Big Data, 1(3), 168–175. 10.1089/big.2013.0027 [DOI] [PubMed] [Google Scholar]
- Beam AL, & Kohane IS (2018). Big data and machine learning in health care. JAMA, 319(13), 1317–1318. 10.1001/jama.2017.18391 [DOI] [PubMed] [Google Scholar]
- Bowman SE (2008). Why ICD-10 is worth the trouble. Journal of AHIMA, 79(3), 24–29. [PubMed] [Google Scholar]
- Chang SH, Yu YC, Carlsson NP, Liu X, & Colditz GA (2017). Racial disparity in life expectancies and life years lost associated with multiple obesity‐related chronic conditions. Obesity, 25(5), 950–957. 10.1002/oby.21822 [DOI] [PMC free article] [PubMed] [Google Scholar]
- Chang VW, Alley DE, & Dowd JB (2017). Trends in the relationship between obesity and disability, 1988–2012. American Journal of Epidemiology, 186(6), 688–695. 10.1093/aje/kwx092 [DOI] [PubMed] [Google Scholar]
- Colditz GA (1999). Economic costs of obesity and inactivity. Medicine and Science in Sports and Exercise, 31(11 Suppl), S663–S667. 10.1097/00005768-199911001-00026 [DOI] [PubMed] [Google Scholar]
- Cutler DM, Glaeser EL, & Shapiro JM (2003). Why have Americans become more obese? Journal of Economic Perspectives, 17(3), 93–118. 10.1257/089533003769204371 [DOI] [Google Scholar]
- D’Souza MJ, Brandenburg EA, Wentzien DE, Bautista RC, Nwogbaga AP, Miller RG, & Olsen PE (2017). Descriptive and Inferential Statistics in Undergraduate Data Science Research Projects In Advances in Statistical Methodologies and Their Application to Real Problems. InTech, Croatia. [Google Scholar]
- D’Souza MJ, Curran KL, Olsen PE, Nwogbaga AP, & Stotts S (2016). Integrative Approach for a Transformative Freshman-Level STEM Curriculum. Journal of College Teaching and Learning, 13(2), 47–64. 10.19030/tlc.v13i2.9632 [DOI] [PMC free article] [PubMed] [Google Scholar]
- D’Souza MJ, Kashmar RJ, Hurst K, Fiedler F, Gross CE, Deol JK, & Wilson A (2015). Integrative biological chemistry program includes the use of informatics tools, GIS and SAS software applications. Contemporary Issues in Education Research, 8(3), 193–214. 10.19030/cier.v8i3.9349 [DOI] [PMC free article] [PubMed] [Google Scholar]
- D’Souza MJ, Walls KJE, Rojas C, Everett LM, & Wentzien DE (2015). Effect of gender and lifestyle behaviors on BMI trends in a sample of the first state’s undergraduate population. American Journal of Health Sciences, 6(1), 59–74. 10.19030/ajhs.v6i1.9270 [DOI] [PMC free article] [PubMed] [Google Scholar]
- D’Souza MJ, Wentzien DE, Bautista RC, & Gross CE (2017). Investigation of Obesity-Related Mortality Rates in Delaware. American Journal of Health Sciences, 8(1), 19–32. [PMC free article] [PubMed] [Google Scholar]
- De Veaux RD, Agarwal M, Averett M, Baumer BS, Bray A, Bressoud TC, … Kim AY (2017). Curriculum guidelines for undergraduate programs in data science. Annual Review of Statistics and Its Application, 4, 15–30. 10.1146/annurev-statistics-060116-053930 [DOI] [Google Scholar]
- Després JP, Lemieux I, & Prud’Homme D (2001). Treatment of obesity: Need to focus on high risk abdominally obese patients. BMJ, 322(7288), 716–720. 10.1136/bmj.322.7288.716 [DOI] [PMC free article] [PubMed] [Google Scholar]
- Elgin SC, Hauser C, Holzen TM, Jones C, Kleinschmit A, & Leatherman J (2017). The GEP: Crowd-sourcing big data analysis with undergraduates. Trends in Genetics, 33(2), 81–85. 10.1016/j.tig.2016.11.004 [DOI] [PubMed] [Google Scholar]
- Fitzmaurice C, Allen C, Barber RM, Barregard L, Bhutta ZA, Brenner H, … Fleming T (2017). Global, regional, and national cancer incidence, mortality, years of life lost, years lived with disability, and disability-adjusted life-years for 32 cancer groups, 1990 to 2015: A systematic analysis for the global burden of disease study. JAMA Oncology, 3(4), 524–548. 10.1001/jamaoncol.2016.5688 [DOI] [PMC free article] [PubMed] [Google Scholar]
- Flegal KM, Graubard BI, Williamson DF, & Gail MH (2007). Cause-specific excess deaths associated with underweight, overweight, and obesity. JAMA, 298(17), 2028–2037. 10.1001/jama.298.17.2028 [DOI] [PubMed] [Google Scholar]
- Friede A, Reid JA, & Ory HW (1993). CDC WONDER: A comprehensive on-line public health information system of the Centers for Disease Control and Prevention. American Journal of Public Health, 83(9), 1289–1294. 10.2105/AJPH.83.9.1289 [DOI] [PMC free article] [PubMed] [Google Scholar]
- George J, Piuzzi NS, Jawad M, Klika AK, Barsoum WK, Mont MA, & Higuera CA (2018). Reliability of ICD-9 codes to detect morbid obesity in patients undergoing total hip arthroplasty. The Journal of Arthroplasty 10.1016/j.arth.2018.05.002 [DOI] [PubMed] [Google Scholar]
- Guarneri M (2017). Health as an Economic Strategy. Integrative Medicine: A Clinician’s Journal, 16(1), 14–15. [PMC free article] [PubMed] [Google Scholar]
- Jin CY, & Yu O (2016). Understanding Obesity through a Big Data Analysis. The FASEB Journal, 30(1 Supplement), 907–915. [Google Scholar]
- Katz DA, McHorney CA, & Atkinson RL (2000). Impact of obesity on health‐related quality of life in patients with chronic illness. Journal of General Internal Medicine, 15(11), 789–796. 10.1046/j.1525-1497.2000.90906.x [DOI] [PMC free article] [PubMed] [Google Scholar]
- Keller K, Münzel T, & Ostad MA (2018). Sex-specific differences in mortality and the obesity paradox of patients with myocardial infarction ages> 70 y. Nutrition, 46, 124–130. 10.1016/j.nut.2017.09.004 [DOI] [PubMed] [Google Scholar]
- Kennedy AB, Lavie CJ, & Blair SN (2018). Fitness or Fatness: Which Is More Important? JAMA, 319(3), 231–232. 10.1001/jama.2017.21649 [DOI] [PubMed] [Google Scholar]
- Khoury MJ, & Ioannidis JP (2014). Big data meets public health. Science, 346(6213), 1054–1055. 10.1126/science.aaa2709 [DOI] [PMC free article] [PubMed] [Google Scholar]
- Klatsky AL, Zhang J, Udaltsova N, Li Y, & Tran HN (2017). Body Mass Index and mortality in a very large cohort: Is it really healthier to be overweight? The Permanente Journal, 21, 16–142. 10.7812/TPP/16-142 [DOI] [PMC free article] [PubMed] [Google Scholar]
- Krueger KP, Armstrong EP, & Langley PC (2001). The accuracy of asthma and respiratory disease diagnostic codes in a managed care medical claims database. Disease Management, 4(4), 155–161. 10.1089/10935070152744534 [DOI] [Google Scholar]
- Liebovitz DM, & Farhenbach J (2018). Counterpoint: Is ICD-10 diagnosis coding important in the era of big data? No. Chest, 153(5), 1095–1098. 10.1016/j.chest.2018.01.034 [DOI] [PubMed] [Google Scholar]
- Murdoch TB, & Detsky AS (2013). The inevitable application of big data to health care. JAMA, 309(13), 1351–1352. 10.1001/jama.2013.393 [DOI] [PubMed] [Google Scholar]
- O’Malley KJ, Cook KF, Price MD, Wildes KR, Hurdle JF, & Ashton CM (2005). Measuring diagnoses: ICD code accuracy. Health Services Research, 40(5p2), 1620–1639. 10.1111/j.1475-6773.2005.00444.x [DOI] [PMC free article] [PubMed] [Google Scholar]
- Poulain M, Doucet M, Drapeau V, Fournier G, Tremblay A, Poirier P, & Maltais F (2008). Metabolic and inflammatory profile in obese patients with chronic obstructive pulmonary disease. Chronic Respiratory Disease, 5(1), 35–41. 10.1177/1479972307087205 [DOI] [PubMed] [Google Scholar]
- Preston SH, Vierboom YC, & Stokes A (2018). The role of obesity in exceptionally slow US mortality improvement. Proceedings of the National Academy of Sciences, 201716802. 10.1073/pnas.1716802115 [DOI] [PMC free article] [PubMed] [Google Scholar]
- Probst JC, Moore CG, Glover SH, & Samuels ME (2004). Person and place: The compounding effects of race/ethnicity and rurality on health. American Journal of Public Health, 94(10), 1695–1703. 10.2105/AJPH.94.10.1695 [DOI] [PMC free article] [PubMed] [Google Scholar]
- Rosenthal RJ, Morton J, Brethauer S, Mattar S, De Maria E, Benz JK, … Sterrett D (2017). Obesity in America. Surgery for Obesity and Related Diseases, 13(10), 1643–1650. 10.1016/j.soard.2017.08.002 [DOI] [PubMed] [Google Scholar]
- Topaz M, Shafran-Topaz L, & Bowles KH (2013). ICD-9 to ICD-10: Evolution, revolution, and current debates in the United States. Perspectives in Health Information Management/AHIMA, American Health Information Management Association, 10(Spring):1d. [PMC free article] [PubMed]
- United States Department of Health and Human Services (U.S. DHHS); Centers for Disease Control and Prevention (CDC); National Center for Health Statistics (NCHS). (n.d.). Multiple Cause of Death on CDC WONDER Online Database. Retrieved from http://www.wonder.cdc.gov/mcd.html
- Vandyk AD, Graham ID, VanDenKerkhof EG, & Harrison MB (2015). Accuracy of ICD codes for persons with considerable emergency department use for mental health complaints. International Journal of Emergency Mental Health and Human Resilience, 17(3), 600–601. 10.4172/1522-4821.1000e226 [DOI] [Google Scholar]
- Wahba IM, & Mak RH (2007). Obesity and obesity-initiated metabolic syndrome: Mechanistic links to chronic kidney disease. Clinical Journal of the American Society of Nephrology, 2(3), 550–562. 10.2215/CJN.04071206 [DOI] [PubMed] [Google Scholar]
- Wang Y, & Beydoun M (2007). The obesity epidemic in the United States gender, age, socioeconomic, racial/ethnic, and geographic characteristics: A systematic review and meta-regression analysis. Epidemiologic Reviews, 29, 6–28. 10.1093/epirev/mxm007 [DOI] [PubMed] [Google Scholar]
- Weiner MG (2018). Point: Is ICD-10 diagnosis coding important in the era of big data? Yes. Chest, 153(5), 1093–1095. 10.1016/j.chest.2018.01.025 [DOI] [PubMed] [Google Scholar]
- Wyatt SB, Winters KP, & Dubbert PM (2006). Overweight and obesity: Prevalence, consequences, and causes of a growing public health problem. The American Journal of the Medical Sciences, 331(4), 166–174. 10.1097/00000441-200604000-00002 [DOI] [PubMed] [Google Scholar]
- Yang S, Lix LM, Yan L, Hinds AM, & Leslie WD (2017). International Classification of Diseases (ICD) -coded obesity predicts risk of incident osteoporotic fracture. PloS one, 12(12), e0189168 10.1371/journal.pone.0189168 [DOI] [PMC free article] [PubMed] [Google Scholar]


