Abstract
Western lifestyle with high salt consumption leads to hypertension and cardiovascular disease. High salt may additionally drive autoimmunity by inducing T helper (TH)17 cells, which may also contribute to hypertension. Induction of TH17 cells depends on the gut microbiota, yet the effect of salt on the gut microbiome is unknown. In mouse model systems, we show that high salt intake affects the gut microbiome, particularly by depleting Lactobacillus murinus. Consequently, L. murinus treatment prevents salt-induced aggravation of actively-induced experimental autoimmune encephalomyelitis and salt-sensitive hypertension, by modulating TH17 cells. In line with these findings, moderate high salt challenge in a pilot study in humans reduces intestinal survival of Lactobacillus spp. along with increased TH17 cells and blood pressure. Our results connect high salt intake to the gut-immune axis and highlight the gut microbiome as a potential therapeutic target to counteract salt-sensitive conditions.
High salt content in the Western diet is implicated in numerous disorders1, particularly cardiovascular disease2. Guidelines3,4 and public initiatives recommend reducing salt intake, yet an improved mechanistic understanding is warranted. The deleterious effect of a high salt diet (HSD) on cardiovascular health is driven by arterial hypertension and associated with increased morbidity and mortality2,5. Thus far, most studies have focused on the role of the kidneys, the sympathetic nervous system, and direct effects on the vasculature6. However, some investigations implicate the immune system in these processes7 linking pro-inflammatory T cells to the development of hypertension8. In particular, interleukin (IL)-17A producing CD4+ helper T cells (TH17) may promote hypertension9,10. TH17 cells play a deleterious role in autoimmune diseases. We and others recently demonstrated that the generation of pathogenic TH17 cells could be promoted by a high salt environment. Consequently, a HSD boosts TH17 generation and exacerbates actively-induced experimental autoimmune encephalomyelitis (EAE)11,12, as a prototypic TH17-driven autoimmune disease13. Active MOG35-55-induced EAE is a disease model recapitulating many aspects of multiple sclerosis (MS), although differing from transgenic EAE models in several aspects of T cell function14. The intestine is exposed to varying salt loads of ingested foods, yet the interaction between HSD and the gut microbiome has not been thoroughly investigated. Gut microbes are known to respond to fluctuations in dietary composition15, leading to transient or persistent alterations of the gut microbiome16. Diet-induced shifts in microbiome composition may have profound effects on the host, especially on T cells17. TH17 cells are particularly affected by the abundance of specific commensal bacteria18. We sought to examine the influence of high salt challenges on the gut microbiome, the immune system, and implications for hypertension and autoimmunity.
High salt decreases Lactobacillus in mice
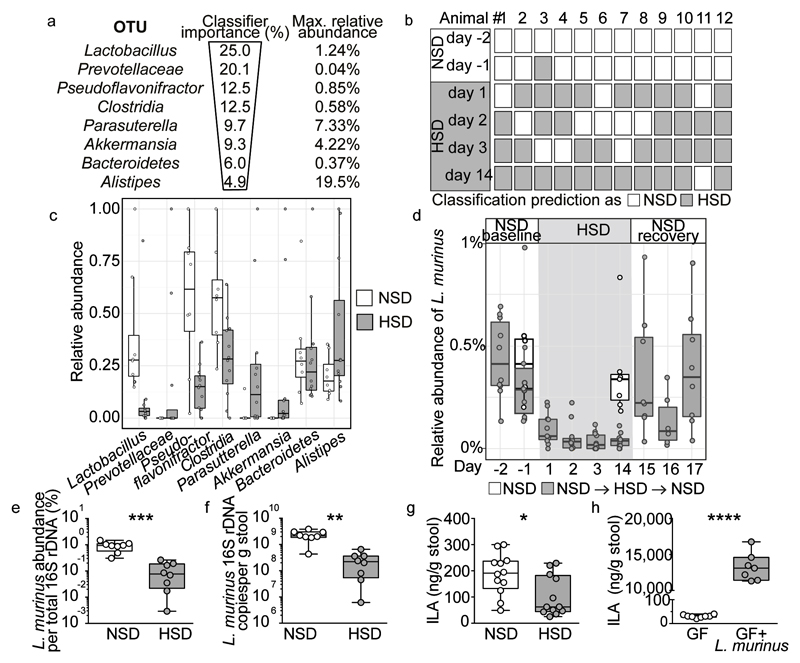
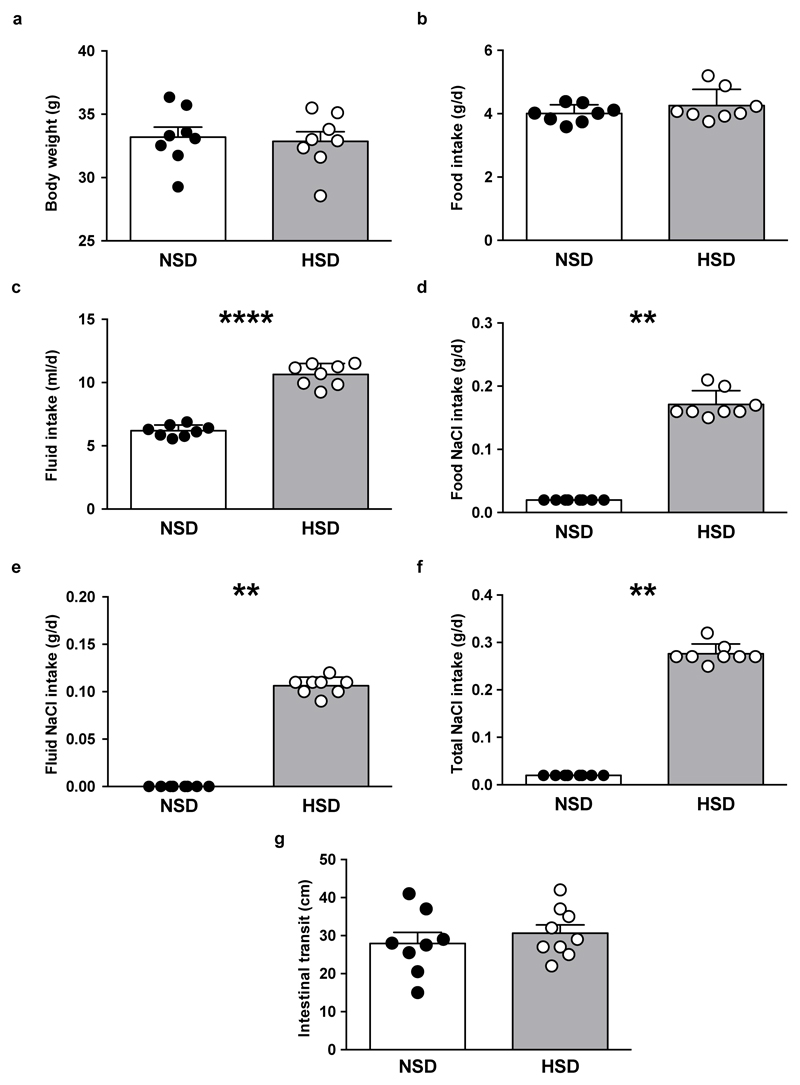
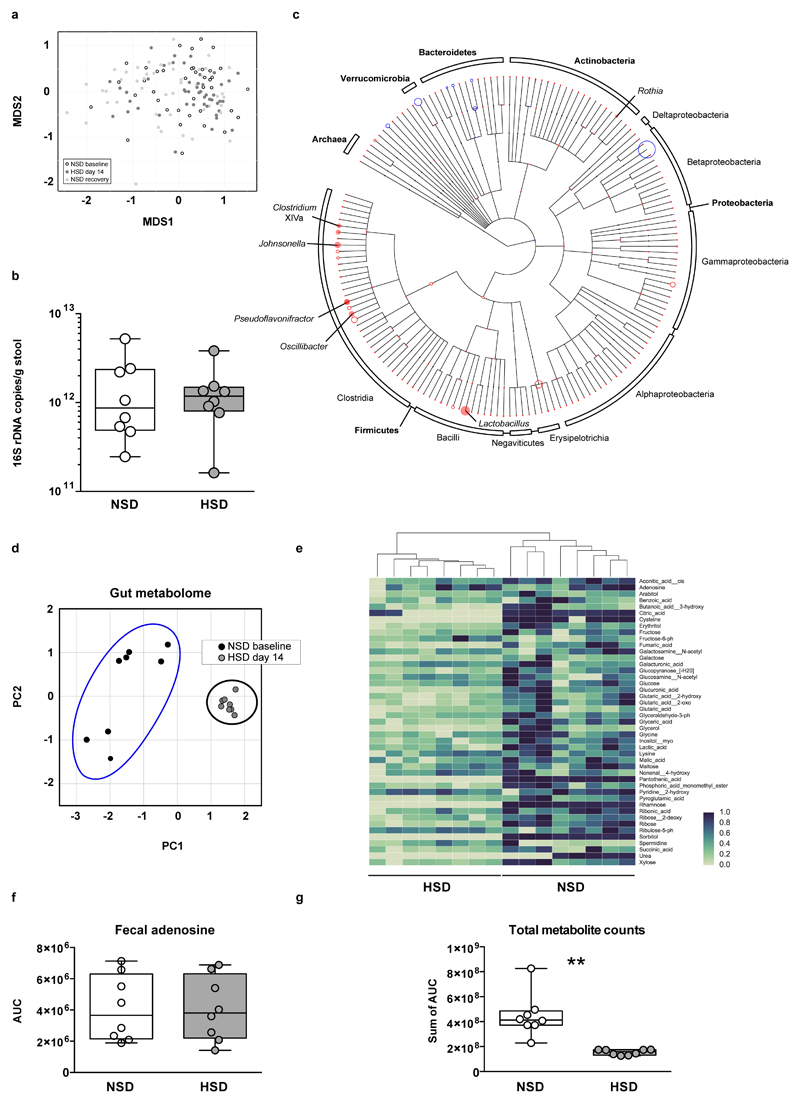
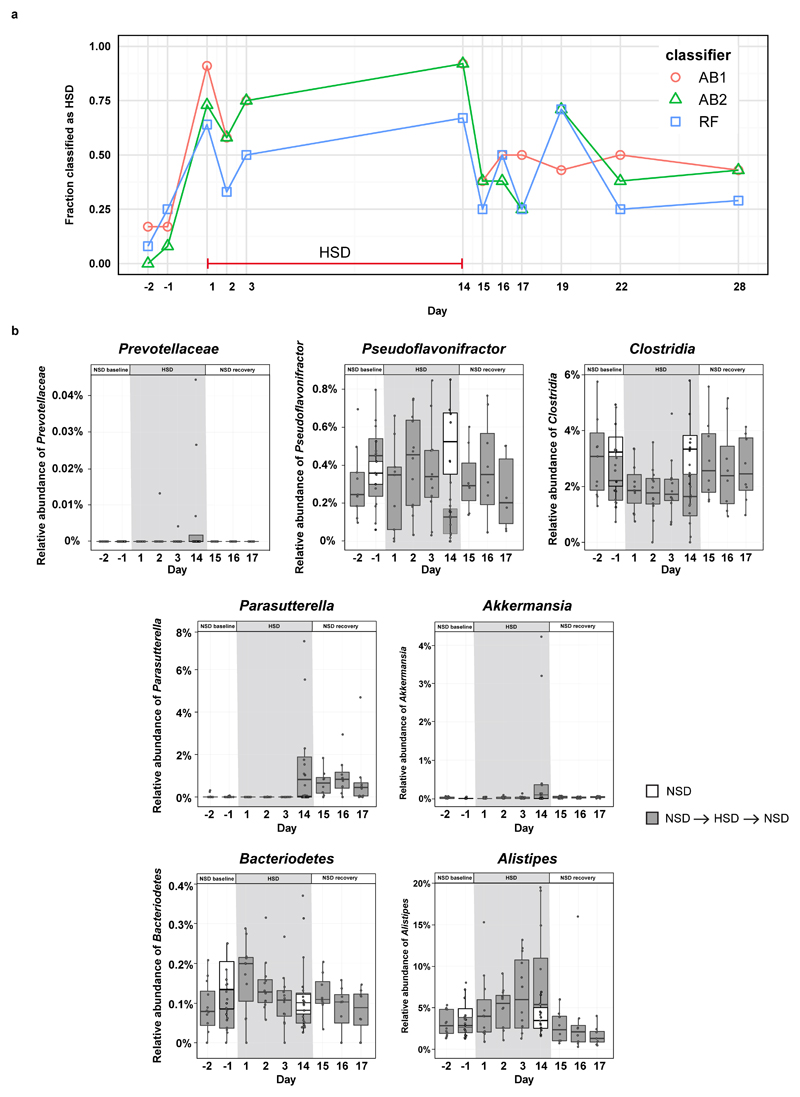
To determine the effect of a HSD on the gut microbiome composition, we analyzed fecal pellets from normal salt diet (NSD) or HSD-fed FVB/N mice by 16S ribosomal DNA (rDNA) gene sequencing. Both diets were equally well-tolerated, indicated by similar body weight and food intake (Extended Data Fig. 1a, b). HSD-fed mice had a significantly higher fluid and salt intake than NSD-fed mice (Extended Data Fig. 1c-f), but similar intestinal transit (Extended Data Fig. 1g). The overall microbial composition (based on Operational Taxonomic Units, OTUs, assigned using Ribosomal Database Project, RDP) showed no obvious pattern shifts between HSD and NSD mice (Extended Data Fig. 2a, b, 3a). Although Jensen-Shannon Divergence indicated differences between HSD and NSD bacterial communities, these differences were not confirmed by Bray-Curtis or UniFrac metrics (data not shown). Bacterial load was not significantly different between NSD and HSD (Extended Data Fig. 3b), but several OTUs were significantly decreased under HSD on day 14, including species with the genera Lactobacillus, Oscillibacter, Pseudoflavonifractor, Clostridium XIVa, Johnsonella and Rothia, while others increased under HSD, e.g. Parasutterella spp. (Extended Data Fig. 3c). Interestingly, analysis of fecal metabolites from central carbon and nitrogen metabolic pathways by gas-chromatography mass-spectrometry showed clear differences between the two groups (Extended Data Fig. 3d-g). The absence of large-scale taxonomic differences was unexpected, given the differences in metabolites, but consistent with the fact that the two diets are identical in energy content and only differ in salt content. To identify the specific bacterial OTUs that did change across diet, we employed a sensitive machine learning approach. An AdaBoost classifier trained to distinguish NSD from HSD samples on day 14 of the treatment identified 8 OTUs with nontrivial feature importance (Figure 1a, c) with 92% accuracy (Figure 1b). These OTUs varied in maximum relative abundance (from 0.04% to 19.5%) and responded differently to the HSD (Figure 1a, c). OTUs identified as most important were consistent across different cross-validation runs, and across different algorithms (Extended Data Fig. 4a). The most important OTU (25% feature importance) was a member of the genus Lactobacillus, and was depleted under HSD (Figure 1d). Other features included OTUs from Prevotellaceae, Pseudoflavonifractor, Clostridia, Parasutterella, Akkermansia, Bacteroidetes and Alistipes (Figure 1a, c, Extended Data Fig. 4b). Lactobacillus depletion showed a quick onset detectable 1 day after initiation of the HSD, remaining at low levels during the HSD with the lowest abundance on day 14. When the mice were returned to NSD, the Lactobacillus OTU abundance returned to baseline levels (Figure 1d).
Figure 1. HSD alters the fecal microbiome and depletes Lactobacillus in mice.
(a) AdaBoost identified eight 16S rDNA OTUs distinguishing NSD from HSD samples. (b) Classifier accuracy per mouse and diet. (c) Relative OTU abundances on HSD day 14 (n=12 mice, n=8 NSD control mice). (d) Lactobacillus abundance over time. Samples >1% not shown. Boxplots: IQR, whiskers 1.5*IQR. (e, f) L. murinus qPCR (n=8 mice). **p<0.01, ***p<0.001 paired two-tailed t-test. (g) Fecal indole-3-lactic acid (ILA), n=12 mice per group. *p<0.05, Wilcoxon signed-rank test. (h) Fecal ILA in gnotobiotic mice (n=8 germ-free, n=7 L. murinus-monocolonized mice). ****p<0.0001 unpaired two-tailed t-test.
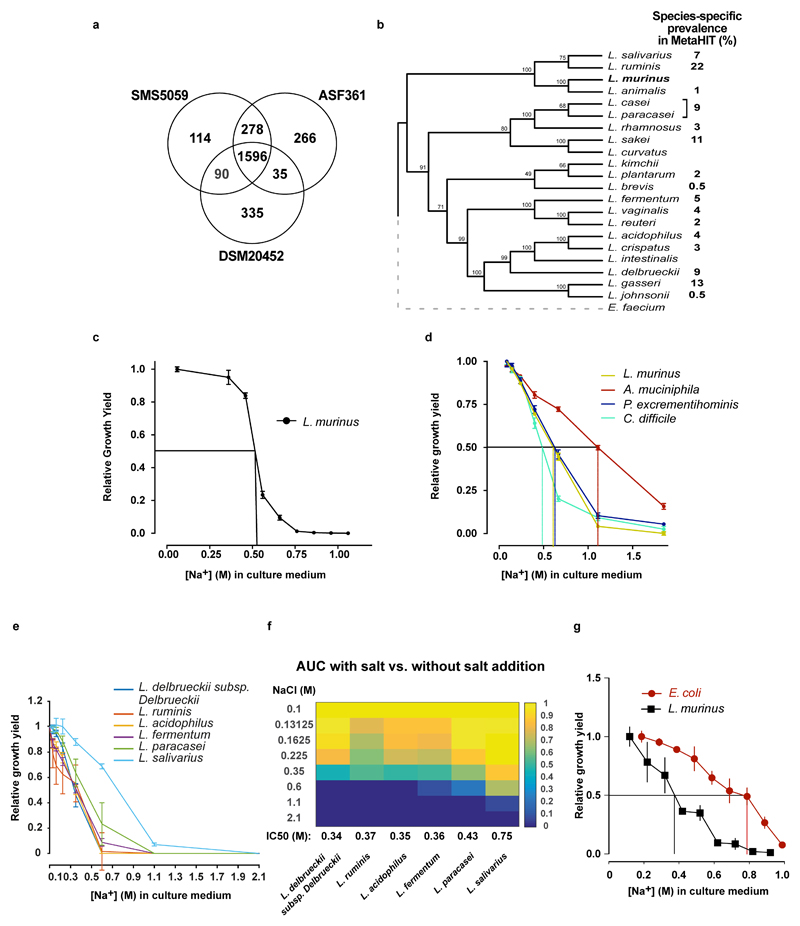
Since the Lactobacillus OTU was the bacterial group most strongly associated with high salt, we aimed to isolate a Lactobacillus strain from the mouse feces. The 16S rDNA sequence of the isolate shared 100% identity with the V4-V5 16S region of the OTU described above, and was identified as L. murinus. We confirmed the decrease of this strain under HSD using qPCR (Figure 1e, f). Genome sequencing of the isolate showed 93% similarity to two published L. murinus genomes19,20 (Extended Data Fig. 5a). Notably, there are no strains of L. murinus known to be native to the human microbiota, with the closest 16S sequence in the human gut microbiota matching at below 90% identity (Extended Data Fig. 5b). The prevalence of different Lactobacillus species varies in humans, each present in 0.5-22% of subjects in the MetaHIT21 Danish subcohort (Extended Data Fig. 5b).
Next, we cultured L. murinus, human-associated Lactobacilli and non-related control strains in vitro and tested their growth under increasing NaCl concentrations. Half maximal growth inhibition (IC50) of L. murinus occurred at comparable NaCl concentrations under aerobic and anaerobic culture conditions (Extended Data Fig. 5c, d). NaCl inhibited the growth of several human isolates at slightly lower concentrations, with the exception of L. salivarius (Extended Data Fig. 5e, f). However, not all strains tested were similarly salt-sensitive. For instance, Akkermansia muciniphila, identified by the classifier and increasing in fecal abundance upon HSD, and Escherichia coli had higher salt tolerances (Extended Data Fig. 5d, g). Importantly, in vivo colonic fecal sodium concentrations in HSD-fed mice are comparable to growth inhibitory NaCl concentrations in vitro (0.252 for HSD vs. 0.133 M for NSD).
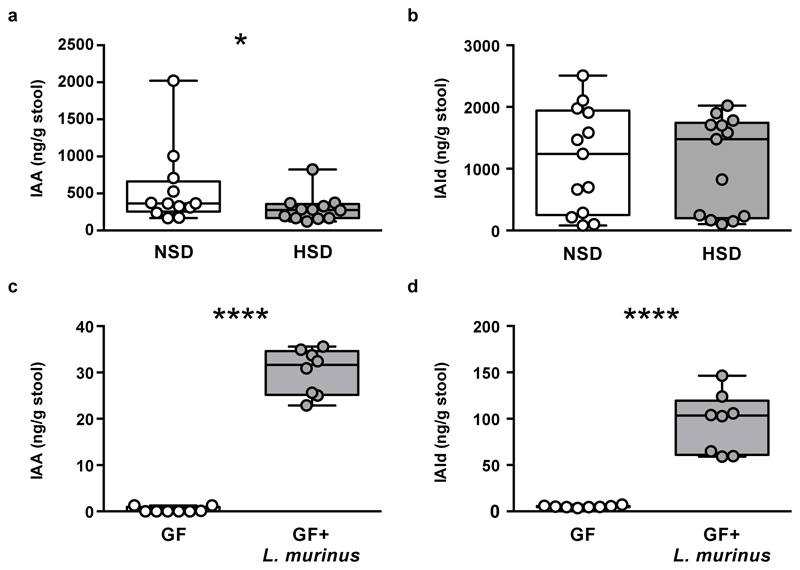
Since Lactobacilli are known to metabolize tryptophan to indole metabolites22, we speculated that HSD would also reduce fecal indoles. Indeed, HSD significantly reduced fecal levels of indole-3-lactic acid (ILA, Figure 1g) and indole-3-acetic acid (IAA, Extended Data Fig. 6a), while indole-3-carboxaldehyde was unchanged (IAld, Extended Data Fig. 6b). Notably, mice monocolonized with the L. murinus isolate exhibited fecal ILA, IAA and IAld as compared to germ-free (GF) controls, indicating L. murinus capability of producing these indoles (Figure 1h, Extended Data Fig. 6c-d).
L. murinus ameliorates active EAE
In MS23 and EAE24, the importance of the gut microbiome has recently been recognized. The suppression of L. murinus by HSD prompted us to investigate whether oral administration of L. murinus ameliorates HSD-induced exacerbation of actively-induced MOG35-55 EAE.
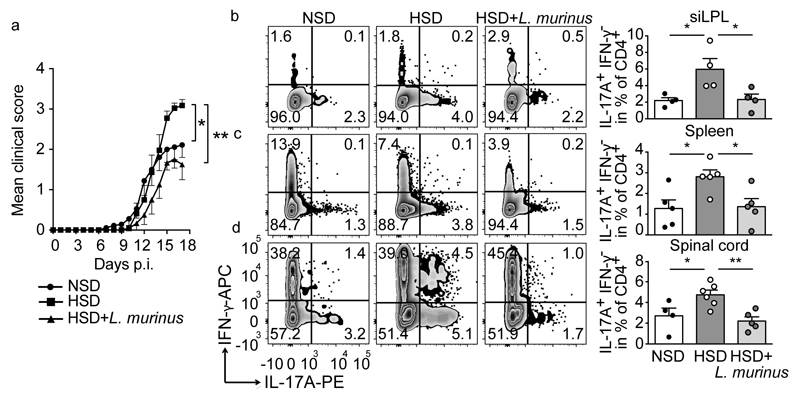
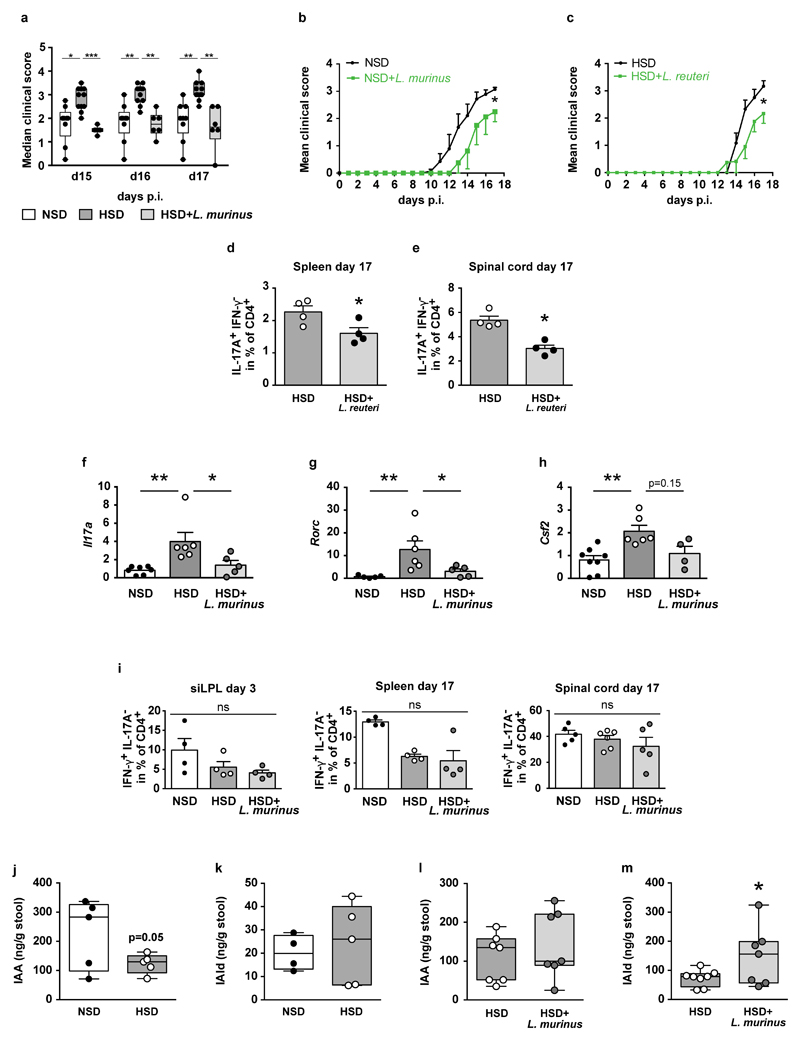
We relied on a daily gavage protocol to maintain L. murinus abundance and fecal indole metabolites during HSD. Body weight and disease incidence were similar in all groups. Mice on a HSD displayed an exacerbated disease course (Figure 2a; Extended Data Fig. 7a). L. murinus supplementation during HSD and NSD feeding ameliorated the disease (Figure 2a and Extended Data Fig. 7a, b). Similar results were observed when HSD-fed mice were treated with L. reuteri (Extended Data Fig. 7c). We analyzed small intestinal lamina propria (siLPL) CD4+ lymphocytes producing IL-17A by flow cytometry at the maximum of intestinal TH17 expansion on day 3 post MOG immunization (p.i.)25. HSD mice displayed a significantly higher frequency of TH17 cells compared to NSD mice, which was reduced in HSD-fed mice concomitantly receiving L. murinus (Figure 2b). Flow cytometry analysis of splenocytes and spinal cord infiltrating lymphocytes on day 17 p.i. revealed a significant reduction in TH17 cells by L. murinus (Figure 2c, d) and by L. reuteri treatment (Extended Data Fig. 7d, e) compared to HSD feeding alone. mRNA expression of Il17a and Rorc in spinal cord tissue was decreased after L. murinus treatment with a tendency towards lower Csf2 levels (Extended Data Figure 7f-h). The effect of HSD and L. murinus was largely TH17 specific as interferon (IFN)-γ producing CD4+ lymphocytes were not affected in siLPL, spleen or spinal cord (Extended Data Fig. 7i). Since we focused on actively-induced MOG35-55-EAE further studies are needed to extend the concept for HSD and Lactobacillus treatment to spontaneous EAE.
Figure 2. L. murinus prevents HSD-induced exacerbation of EAE and reduces TH17 cells.
(a) Mean disease scores±s.e.m. of MOG35-55-EAE mice fed NSD (n=9), HSD (n=11), or HSD with L. murinus (n=6). (b) siLPL (day 3 p.i.) analyzed for CD4+ IL-17A+ IFN-γ- cells (n=4). (c, d) Spleens (n=5) and spinal cords (NSD n=4; HSD n=6; HSD+L. murinus n=5, day 17 p.i.) were similarly analyzed. Representative plots, quantification to the right. Mean±s.e.m., circles represent individual mice. *p<0.05, **p<0.01 by one-way ANOVA and post-hoc Tukey’s for (c), Kruskal-Wallis and Dunn’s post-hoc test for (a, b, d). n equals mice per group.
To elaborate on putative mechanisms for the modulation of TH17 cells, we focused on fecal indole metabolites, which are known to improve actively-induced EAE26. HSD significantly reduced fecal ILA, while concomitant L. murinus supplementation prevented this effect (Figure 3a, b). A similar pattern was observed for fecal IAA and IAld (Extended Data Fig. 7j-m). Next, we investigated the effect of ILA on the differentiation of murine TH17 cells in vitro. ILA significantly reduced TH17 polarization in a dose-dependent manner (Figure 3c).
Figure 3. Putative role for ILA.
(a) HSD reduces fecal ILA in MOG35-55-EAE mice (n=5), day 10 p.i. (b) Fecal ILA in HSD+L. murinus treated (n=6) vs. HSD-fed MOG35-55-EAE mice (n=8), day 10 p.i. Circles represent samples from individual mice. *p<0.05 using unpaired one-tailed t-test for (a); Mann-Whitney U test for (b). (c) Naïve murine CD4+ T cells cultured under TH17-polarizing conditions in presence (+ILA) or absence (+vehicle) of ILA, analyzed for IL-17A (n=3 replicates per group, mean±s.e.m., one representative out of two independent experiments is shown). ***p<0.001 vs. vehicle using one-way ANOVA and Tukey's post-hoc test.
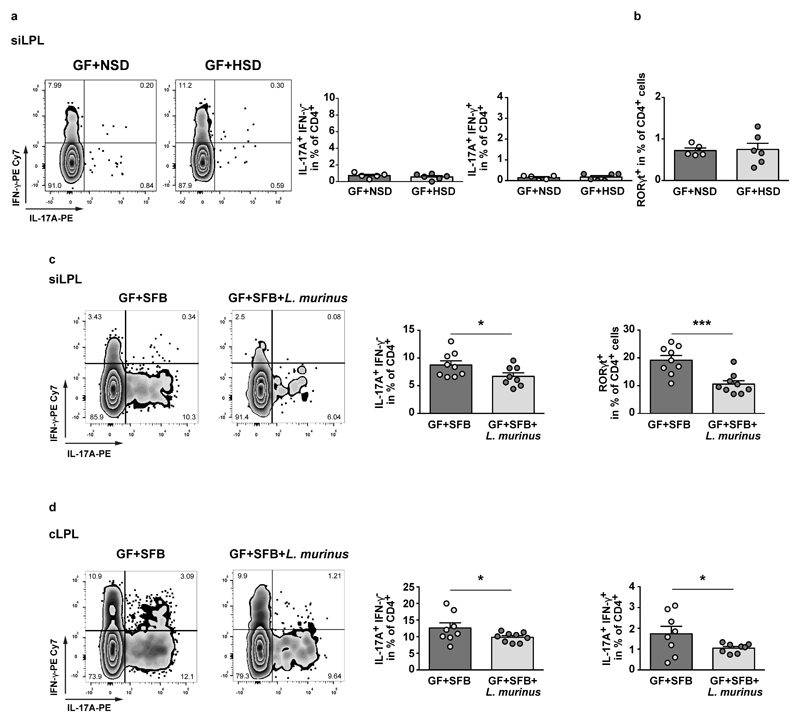
However, in MOG35-55 immunized GF mice, HSD did not change TH17 frequencies compared to NSD (Extended Data Fig. 8a, b), indicating a crucial role for intestinal bacteria in mediating the HSD effect on TH17 cells. To corroborate the modulatory effects of L. murinus, we used segmented filamentous bacteria (SFB) as known inducers of intestinal TH17 cells18 and compared MOG35-55 immunization in gnotobiotic mice harboring either solely SFB (GF+SFB) or SFB and L. murinus (GF+SFB+L. murinus). As predicted, the presence or absence of L. murinus determined TH17 frequencies in siLPL and cLPL (Extended Data Fig. 8c, d).
L. murinus reduces salt-sensitive hypertension
Accumulating evidence suggests that TH17 cells play a role in the genesis of hypertension7. Moreover, a recent meta-analysis provided preliminary support that Lactobacillus-rich probiotics might affect blood pressure in hypertensive subjects27. Thus, we tested whether L. murinus treatment would decrease experimental salt-sensitive hypertension.
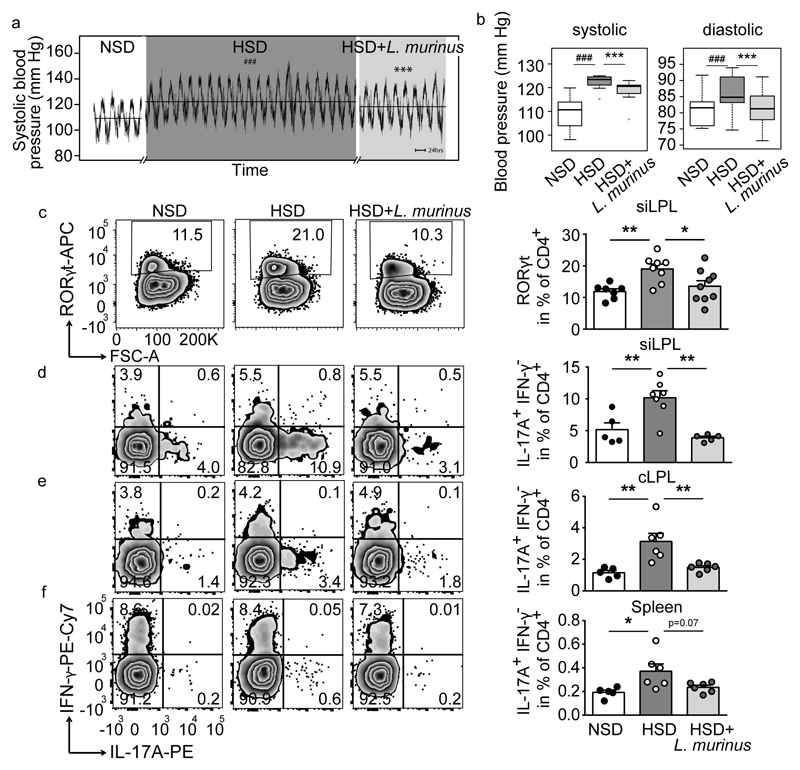
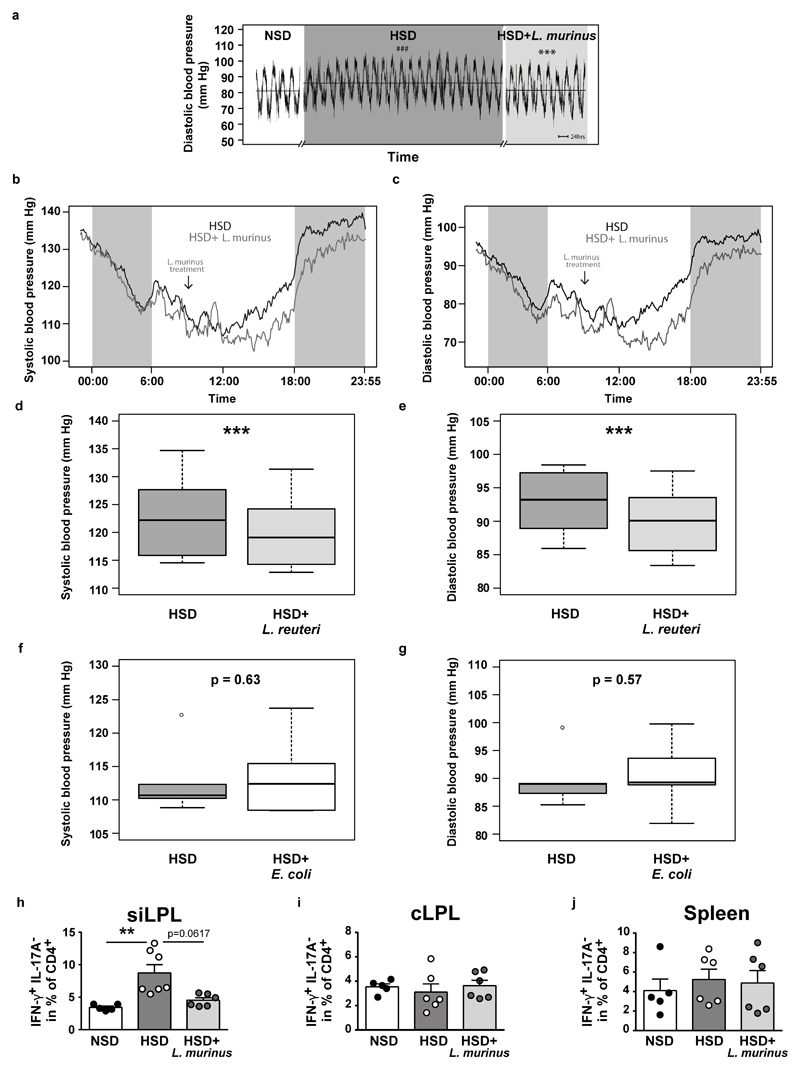
Blood pressure increased over 3 weeks of HSD (Figure 4a, b, Extended Data Figure 9a). Concomitant daily treatment with L. murinus led to a significant reduction of systolic and normalization of diastolic blood pressure (Figure 4a, b, Extended Data Fig. 9b, c). L. reuteri was similarly effective, while non-Lactobacillus strain E. coli Nissle 1917 was ineffective (Extended Data Fig. 9d-g).
Figure 4. L. murinus ameliorates salt-sensitive hypertension and reduces TH17 cells.
Continuous blood pressure recordings in n=7 FVB/N mice. (a) Mean systolic pressures over time and (b) systolic and diastolic pressures as boxplots (IQR, whiskers 1.5*IQR). ###p<0.001 vs. NSD, ***p<0.001 vs. HSD (linear mixed model). (c) CD4+RORγt+ siLPL in mice fed NSD (n=7), HSD (n=8) or HSD+L. murinus (n=9). (d-f) CD4+IL-17A+IFN-γ- siLPL, cLPL, splenocytes in mice fed NSD (n=5), HSD (n=6; siLPL n=7) and HSD+L. murinus (n=6; siLPL n=5). Representative plots per group, quantification showing mean±s.e.m., circles represent individual mice. *p<0.05, **p<0.01, one-way ANOVA and post-hoc Tukey’s (c, e, f), Kruskal-Wallis and post-hoc Dunn’s (d).
We next asked if L. murinus treatment affects TH17 cells in experimental salt-sensitive hypertension and analyzed intestinal and splenic lymphocytes by flow cytometry. Compared to NSD, HSD led to a significant increase in CD4+RORγt+ TH17 cell frequencies in siLPL, which was significantly reduced by L. murinus treatment (Figure 4c). In addition, flow cytometry analysis of siLPL, cLPL and splenic lymphocytes revealed a significant reduction of TH17 cell frequencies by L. murinus treatment compared to HSD feeding alone (Figure 4d-f). The effect of HSD and concomitant L. murinus treatment on effector T cells was again largely specific to TH17, as a similar pattern was not observed for TH1 markers. Except for the siLPL, HSD and L. murinus treatment did not alter the expression of TH1 cytokine IFN-γ (Extended Data Figure 9 h-j). In addition, the frequencies of regulatory CD4+CD25+ Foxp3+ T cells (Treg) were neither significantly affected by the HSD, nor by concomitant L. murinus treatment in intestinal and splenic tissues (data not shown). Thus, L. murinus prevents HSD-induced generation of TH17 cells and consequently ameliorates salt-sensitive hypertension.
Salt challenge in healthy humans
To corroborate our findings in humans, we conducted an exploratory pilot study in healthy male volunteers, where participants were subjected to an increased salt intake for 14 days. Participants received 6 g sodium chloride per day (corresponding to 2.36 Na+ g/day) using slow-release NaCl tablets in addition to their accustomed diets. According to dietary records, salt intake from foods and drinks was similar between baseline and day 14 of high salt. During high salt challenge, the total salt intake was 13.8±2.6 g/day (Extended Data Figure 10a). We monitored ambulatory blood pressure at baseline and after salt challenge in a subgroup of 8 participants. To standardize blood pressure measurements and exclude physical activity or stress-driven alterations during daytime28 unrelated to salt-sensitivity, we monitored nocturnal blood pressure during bed rest. Compared to baseline, high salt challenge significantly increased mean nocturnal systolic and diastolic blood pressure (Figure 5a). Since HSD increased TH17 cells in mice, we analyzed TH17 cells in human blood before and after high salt. Analysis of peripheral blood lymphocytes using flow cytometry revealed a significant increase in CD4+IL-17A+TNF-α+ TH17 cells (Figure 5b).
Figure 5. High salt challenge affects blood pressure, TH17 cells and Lactobacilli in healthy humans.
(a) Mean nocturnal systolic and diastolic blood pressures and (b) IL-17A+TNF-α+ cells in CD4+ enriched PBMC (one representative subject is shown) in n=8 males at baseline and after challenge. *p<0.05, **p<0.01, ****p<0.0001, paired one-tailed t-test (a) and Wilcoxon signed-rank test (b). (c) Loss of Lactobacilli after high salt challenge. Subjects positive for Lactobacilli at baseline are shown. Split cells show abundance at baseline (left) and after high salt (right), crosses indicate nondetection. (d) Kaplan-Meier curves comparing the persistence of Lactobacilli to control cohorts (log-rank test).
To investigate the effect of high salt challenge on the human gut microbiome, we analyzed the abundance of Lactobacilli in fecal samples before and after high salt challenge. To achieve more detailed taxonomic resolution, full shotgun metagenomic was performed (see Supplementary Information). Lactobacillus is not a dominant member of the human feces. In a control data set used here29,30 only 41.3% were positive for any Lactobacillus. In our present study, likewise 5 of 12 (41.7%) subjects were positive for at least one gut Lactobacillus species at baseline (Figure 5c). Overall, we detected 7 different gut Lactobacillus species at baseline (Figure 5c, species assignment using SpecI31). After high salt challenge, nine of ten initially present Lactobacillus populations could no longer be detected in the respective study subjects, suggesting a loss of Lactobacillus species (Supplementary Information and Extended Data Figure 10b, c, d for cross-validation). To test whether this is expected for the human gut over time, we reanalyzed 121 published Illumina-sequenced healthy gut metagenomes29,30 with time course information. A Kaplan-Meier survival analysis on all Lactobacillus populations revealed a significantly decreased survival (defined here as continued detectability) rate of Lactobacillus gut populations under HSD (Figure 5d). Compared to non-Lactobacillus species, Lactobacilli were lost significantly faster under HSD, reflecting high salt impact on an intrinsically low-resilience taxon (Supplementary Information and Extended Data Figure 10e, f). Furthermore, we observed that several study subjects had gained at least one novel Lactobacillus species by day 14, which was not detected at baseline (Extended Data Fig. 10g-i). We speculate that this is the consequence of ingested Lactobacillus-containing foods, since study participants were not subjected to dietary restrictions. Thus, high salt challenge induces an increase in blood pressure and TH17 cells in healthy subjects, alongside reducing survival of intestinal Lactobacillus species in subjects harboring Lactobacillus at baseline.
Discussion
Our data document the impact of an increased salt consumption on intestinal bacteria in mice and men and broaden existing knowledge on the effects of this nutrient. Several intestinal bacteria were affected by high salt; particularly Lactobacillus spp. were suppressed. In addition, fecal metabolites levels, particularly bacterial tryptophan metabolites, responded to HSD in mice. Such effects may contribute to salt-induced TH17 responses and salt-sensitive conditions. Since L. murinus produces ILA, we speculate that its salt-induced decrease with reduced ILA generation could be responsible for an enhanced TH17 response. Importantly, the experimental approaches in mice demonstrate that L. murinus supplementation blunts HSD-induced TH17 activation and ameliorates salt-sensitive hypertension and actively-induced EAE in vivo. Yet, actively-induced EAE differs from spontaneous disease models14. It is thus currently unclear whether high salt effects can be generalized beyond the actively-induced model and to MS. These limitations may also extend to the recent controversy on more general effects of a HSD in neuroinflammation32,33. However, in the actively-induced EAE and hypertension models used here and in humans, high salt enhanced TH17 cells.
Lactobacillus metabolites are known to affect host physiology22,34 and ameliorate actively-induced EAE26. Other tryptophan metabolites have been shown to reduce blood pressure35. Our data in mice suggest that L. murinus may substantially influence the abundance of fecal tryptophan metabolites, not excluding the possibility that other strains (e.g. Bifidobacterium spp.) may be producers of similar importance. Additionally, we demonstrated that ILA inhibited murine TH17 polarization in vitro, a finding that needs to be addressed in more detail in vivo. These results highlight the microbiome as a salt-sensitive compartment but do not speak against a more direct effect of high salt on host cells. Earlier investigations showed that the ionic microenvironment directly affects various immune cells36–39. Salt intake also has profound actions on hormonal systems such as the renin-angiotensin-aldosterone axis.
Our exploratory pilot study in humans is limited in power and needs to be validated in larger studies. Considering this limitation, it suggests that even a moderate salt challenge may affect the persistence of intestinal Lactobacilli and other bacteria, along with an increase in pro-inflammatory TH17 cells and salt-sensitive blood pressure changes. Interestingly, newborn infants have the greatest Lactobacillus abundance that decreases over time40,41. Compared to microbiomes from indigenous populations, Lactobacillus abundance in 'Western' gut microbiomes is low42. Salt ingestion already starting at young age may partially have contributed to the relative loss of Lactobacilli from Western microbiomes and thereby may play role in the development of hypertension and autoimmunity.
Finally, the development of microbiota-targeted therapies is an intriguing new avenue for many diseases. Nevertheless, changes in microbiome composition or function must first be carefully shown to contribute to any disease. Our experimental data in mice suggest that the gut microbiota might serve as a potential target to counteract salt-sensitive conditions. The identification of Lactobacillus as a ‘natural inhibitor’ of high salt-induced TH17 cells in mice could serve as a basis for the development of novel prevention and treatment strategies. It is up to randomized controlled trials in diseased humans to test this hypothesis. Moreover, any future dietary salt intervention trial should thus consider monitoring the microbiome to expand on our observations.
Methods
Animal ethics
All animal experiments were conducted in accordance with institutional, state and federal guidelines and with permission of the local animal ethics committees (Landesamt für Gesundheit und Soziales Berlin, Germany; Regierung Unterfranken, Würzburg, Germany; Ethical Committee for Animal Experiments, Hasselt University, Belgium). Male mice were maintained on a 12:12 hour day:night cycle with constant access to food and water.
Mouse high salt feeding and feces collection
All normal salt (NSD, E15430-047) and high salt (HSD, E15431-34) purified diets used for mouse experiments were purchased from Ssniff (Soest, Germany). Diets were gamma-irradiated (25kGy) and identical in composition except for NaCl content (NSD: 0.5% NaCl, HSD: 4% NaCl). Drinking water for HSD animals was supplemented with 1% NaCl.
For fecal microbiome analyses, male FVB/N mice aged 12 weeks were purchased from Charles River and accustomed to NSD. Control animals remained on the NSD (n=8), others were switched to HSD (n=12) for 14 days. A subgroup was switched back to NSD for another 14 days (n=8). Body weight and food intake were monitored. To avoid cage effects, mice were housed individually. Fresh fecal pellets were collected directly from the anal orifices, immediately shock-frozen in liquid nitrogen and stored at -80°C for later analyses.
DNA extraction from mouse feces and 16S sequencing
DNA was extracted from a single fecal pellet from each mouse using the Power Soil kit (MO BIO Laboratories, Carlsbad, CA, USA). The protocol was modified from the manufacturer's instructions to include proteinase K treatment to further lyse cells. After addition of proteinase K (final concentration 5 mg/ml) samples were incubated at 65 °C for 10 min and further 10 min at 95 °C. Plates were inverted to mix during both incubations. The V4 region of the 16S rRNA gene was amplified with 515F and 806R primers43 using a two-step PCR library preparation as previously described44. An Illumina MiSeq was run for 250 cycles to produce paired-end reads.
16S rDNA data processing
The raw sequences were de-multiplexed, allowing at most 2 mismatches in the barcode before discarding a sequence. Primers sequences were removed, allowing at most 2 mismatches in the primer sequence before discarding a sequence. Forward and reverse reads were merged by comparing alignments with lengths of 253±5 nucleotides. The alignment with the fewest mismatches was used unless the number of mismatches was greater than 2, in which case the read pair was discarded. Merged reads were filtered for quality by removing reads with more than 2.0 expected errors45. Each unique sequence was assigned a taxonomy using RDP46, truncating the taxonomy to the highest taxonomic level with at least 80% support. Sequences that were assigned the same taxonomy were then placed in the same operational taxonomic unit (OTU). De novo OTUs were also called using usearch47.
16S rDNA data analysis
For most analyses, three samples were excluded because their read counts were low (< 1000 counts). The MDS ordination and PERMANOVA test were computed using R’s vegan package48. The phylogenetic tree was generated from a single medoid sequence from each OTU. Medoid sequences were selected by aligning all the sequences in each OTU with PyNAST49, computing a distance matrix with Clustal Omega50, and selecting the medoid sequence. Aligned sequences with at least 10 reads in their corresponding OTU were assembled into a tree with FastTree 2.051 and visualized with R’s ape package52. The AdaBoost classifier53 was run with 107 estimators using Python’s scikit-learn module54. The random forest classifier55 was run with 106 estimators also using Python’s scikit-learn module.
Fecal metabolite analysis
An extraction mixture of methanol-chloroform-water (MCW) (5:2:1/v:v:v) (Methanol LC-MS-grade, Chloroform Reagent Plus ® 99,8% Sigma-Aldrich) with cinnamic acid (2 μg/ml, Sigma-Aldrich) as internal standard was added to the sample. Samples were dissolved in MCW (1 ml/ 60 mg of sample) using the tissue lyser (Precellys 24 lysis and homogenization, Bertin Technologies, France), samples were cooled on ice between the shaking cycles. Samples were shaken at 1,000 rpm and 4°C for 60 min. After addition of ice cold water (half of MCW volume) samples were shaken at 1,000 rpm and 4°C for 10 min. Samples were centrifuged for 10 min at 14,000 rpm to separate the polar (top), lipid (bottom) and interface (tissue debris) layers. Polar phase containing metabolites was dried under vacuum for 12 h.
Samples were derivatized as follows: the dried extracts were dissolved in 20 μl of methoxyamine hydrochloride solution (Sigma, 40 mg/ml in pyridine (Roth)) and incubated for 90 min at 30°C shaken at 1,000 rpm followed by the addition of 40 μl of N-methyl-N-[trimethylsilyl]trifluoroacetamide (MSTFA; Machery-Nagel, Dueren, Germany) and incubation at 37°C for 45 min agitated at 1,000 rpm. The extracts were centrifuged for 10 min at 14,000 rpm, and aliquots of 30 μl were transferred into glass vials (Chromacol, UK) for gas chromatography-mass spectrometry (GC-MS) measurement. Metabolite analyses was performed with a Pegasus IV mass-spectrometer (LECO, St. Joseph, USA) as described previously56. The GC-MS chromatograms were pre-processed with the ChromaTOF software (LECO). Calculation of retention index, mass spectra identification and metabolite quantification were performed using the in house Maui-SILVIA Software tool57.
Measured values from 66 metabolites were obtained. Since a paired analysis (metabolites at NSD baseline vs. metabolites after HSD) was performed, absence of a given value made the exclusion of the corresponding second value necessary. This was in only 33 of 1056 cases (3.1%). A small pseudocount value (0.001) was added to all metabolite values and data was log10 transformed. Data from each metabolite was normalized by subtracting the minimum and dividing by the maximum value across all eight mice. The PCA was performed using the Python scikit-learn package's PCA module. The heatmap was prepared with the Seaborn package's clustermap function.
Measurement of tryptophan metabolites
Fecal pellets derived from mice were processed as previously described22. Chemicals used were purchased from Sigma-Aldrich and were liquid chromatography (LC)-MS grade. Pellets were diluted in 300 μl/10 mg feces 0.2 M acetate buffer (pH 4.2) and shaken with 1.5 ml methyl tert-buthyl ether (MTBE) on a shaker at room temperature at 1,400 rpm for 10 min in the presence of ceramic beads (2.8 mm Precellys Ceramic Beads, Peqlab). Samples were afterwards centrifuged at 4°C at 9000×g. From the organic phase 1 ml was transferred into a new Eppendorf vial and samples were concentrated using Eppendorf Concentrator 5301. Concentrated samples were dissolved in 200 ml acetonitrile:H2O 1:4 v/v containing 0.2% formic acid and stored at -20°C for further analysis.
LC-MS/MS analysis was performed using an Agilent 1290 Infinity II UPLC system coupled to an Agilent 6495 Triple Quad mass spectrometer equipped with an iFunnel ESI ion source operated in the positive mode (Agilent Technologies, Santa Clara, CA, USA). The UPLC column used was an Agilent Eclipse plus (100 mm × 2.1 mm, 1.8 μm). Chromatography was performed under gradient conditions using mobile phase A (0.1% formic acid in water) and B (0.1% formic acid in methanol). Gradient was started at 5% methanol, increased to 95% after 10 min with a constant flow rate of 0.3 ml/min during a total run time of 17 min. The column temperature was set to 30°C. The injection volume was 1 μl. Drying gas was adjusted at 130°C/17 l/min, sheath gas at 400°C/11 l/min. Capillary and nozzle voltage were optimized at 3,500 V and 800 V, respectively. Analytes were monitored in the multiple reaction monitoring mode. The optimal transitions, collision energies and cell accelerator voltages for each compound were determined as in the following ILA m/z 206 -> 118 CE: 24V CAV: 1V; ICA m/z 146 -> 118 CE: 13V CAV: 5V; IAA m/z 176 -> 130 CE: 17V CAV: 1V. Calibration curves for the quantification of individual metabolites were established based on the changes in the relative peak area in response to different target compound concentration. Linearity was r2 > 0.99 over a range from 0.05 to 300 ng/ml for any compound.
Isolation of L. murinus
Fecal samples from healthy male NSD-fed FVB/N mice were dissolved and diluted at a 1:10 dilution in anaerobic PBS (pH 7.6) containing L-cysteine HCl at 0.1% in a Coy Anaerobic Chamber (5% H2, 20% CO2, 75% N2). Samples were diluted 10-fold and each dilution spread on LAMVAB agar58. Plates were incubated at 37°C under anaerobic conditions and examined for growth at 24 hours. Individual colonies growing at the highest dilution were picked into LAMVAB medium and grown for an additional 16 hours. Liquid cultures were stored in 15% DMSO. For identification of isolates, DNA was extracted by adding 5 μl liquid culture to 20 μl sterile distilled water and storing at 4°C overnight; 2 μl of this extract was amplified with Phusion HF polymerase in a 20 μl reaction using universal 16S primers 27F (5’-AGAGTTTGATCMTGGCTCAG-3’) and 1492R (5’-TACGGYTACCTTGTTACGACTT-3’). PCR products were purified using Agencourt AMPure XP and submitted with the 27F primer for Sanger sequencing. An isolate whose full-length 16S sequence shared 100% identity with the V4-V5 region of the Lactobacillus species identified in the 16S library was selected for further study. Frozen stocks of L. murinus (in PBS + 25% glycerol) were prepared, stored at -80°C and used for gavage of salt-sensitive and EAE mice.
Salt tolerance of L. murinus and selected gut commensals
Frozen stocks of L. murinus were streaked onto MRS agar and incubated at 37°C under aerobic conditions for 24 hours. Single colonies were picked into MRS medium and grown until mid-log phase (OD600 = 0.4-0.6), at which time liquid cultures were diluted 1:100 into MRS medium containing NaCl in the range of 0 to 2 OsM. In separate experiments, E. coli and L. murinus were picked into LB (E. coli) or MRS (L. murinus) medium, respectively. Na+ concentration of growth media was determined using atomic absorption spectrometry or calculated. OD600 of cultures was measured following 12-16 additional hours of growth. For comparison of the salt tolerance of phylogenetically distinct gut commensals, C. difficile ATCC 700057, A. muciniphila DSM 26127, and P. excrementihominis DSM 21040 were cultured under the same conditions. Frozen stocks of each strain, along with L. murinus, were streaked onto Brucella Blood Agar with vitamin K and hematin, and grown at 37°C in a Coy Anaerobic Chamber for 24 hours. Individual colonies were transferred into liquid Gifu anaerobic medium supplemented with 0.25% porcine gastric mucin (Sigma) and grown until mid-log phase, at which time they were diluted 1:100 into MGAM containing NaCl with concentrations of Na+ ranging from 0.08 to 1.8 M. OD600 of cultures was measured after 48 hours of growth (to compensate for the slow growth rates of some of the strains).
In vitro growth of human-associated Lactobacillus isolates
Human-associated Lactobacillus isolates were obtained from the German Culture Collection (DSMZ, Braunschweig, Germany): L. salivarius (DSM-No. 20555), L. ruminis (DSM-No. 20403), L. delbrueckii subsp. Delbrueckii (DSM-No. 20074), L. fermentum (DSM-No. 20052). L. acidophilus NCFM, L. paracasei (ATCC SD5275). Lactobacillus strains were grown anaerobically in a gas chamber (Coy Laboratory Products, USA; 12% CO2, 2,5-5 % H2, and 83-85,5% N2) in Gifu Anaerobic Medium Broth (MGAM) at 37°C. Overnight cultures were diluted to an initial OD of 0.01 and growth was assessed in the presence of increasing concentrations of NaCl by monitoring the absorbance at 578 nm using an Eon (Biotek) microplate spectrophotometer in 30-minute intervals after 30 s of shaking. AUCs were calculated using the trapezoidal rule and normalized to the AUC calculated for growth in MGAM without addition of NaCl.
Germ-free mice and L. murinus monocolonization
C57BL/6J male mice were bred under germ-free conditions and kept under a 12-hour light cycle and fed sterile NSD (E15430-047, Ssniff, Soest, Germany) ad libitum. For monocolonization, mice were gavaged with 200 μl of L. murinus stock solution (107 CFU/ml, as described above) and further maintained under sterile conditions for two weeks. Fecal pellets were harvested under sterile conditions and immediately frozen in liquid nitrogen, or cultured in liquid thioglycolate medium (bioMerieux), incubated for 7 days, streaked on sheep blood agar plates (oxoid, 24 hours) and further analyzed for species identification using MALDI-TOF (analyzed by GIMmbH, Michendorf, Germany) as described previously59.
Salt-sensitive hypertension in mice
To induce salt-sensitive hypertension, the L-NAME/salt mouse model was used as described previously60. This non-surgical intervention closely recapitulates salt-sensitive hypertension common in humans60. In brief, NSD-fed male FVB/N mice, aged 10-12 weeks, received pretreatment with (L-NAME, 0.5 mg/ml, Sigma-Aldrich) via drinking water for 3 weeks, followed by a 1-week washout period with NSD and normal drinking water. Then, mice were switched to either HSD with oral administration of L. murinus (daily gavage of 200 μl 107 CFU/ml L. murinus suspension,), HSD with oral administration of control solution (daily gavage of 200 μl PBS/glycerol) or NSD for two weeks. For blood pressure measurements, mice were implanted with miniature subcutaneous radiotelemetry devices in anesthesia (Data Sciences International, New Brighton, MN, USA) prior to the L-NAME/salt protocol. Thereby, systolic and diastolic blood pressures were recorded continuously at 5 minute intervals in freely moving mice. Following hypertension induction with HSD for 3 weeks, HSD was continued and mice were concomitantly gavaged with 200 μl 107 CFU/ml L. murinus in phosphate-buffered saline (PBS) + glycerol daily. L. reuteri and E. coli Nissle 1917 were used for separate experiments in a similar manner (107 CFU/ml in PBS + glycerol daily).
Mice were euthanized in anaesthesia, spleens and intestines were harvested. Single-cell suspensions of small intestinal (si) and colonic (c) lamina propria lymphoyctes (LPL) were obtained by enzymatic and mechanical dissociation using the Lamina Propria Dissociation Kit Mouse (Miltenyi Biotec, Bergisch Gladbach, Germany) according to the manufacturers’ protocol. Cell debris was removed using Percoll (GE Healthcare) density gradient centrifugation as described previously61. Splenocyte single-cell suspensions were obtained using 70 μm strainers, followed by erythrocyte lysis and subsequent filtering using a 40 μm mesh. Cells were counted by trypan blue exclusion and labeled for flow cytometric analysis.
Isolated immune cells were either directly stained for surface markers using the respective fluorochrome-conjugated antibodies (30 min in PBS supplemented with EDTA and BSA) or restimulated with 50 ng/ml phorbol-12-myristate-13-acetate (PMA, Sigma-Aldrich), 750 ng/ml ionomycin (Sigma Aldrich) and 0.75μl/ml GolgiStop (BD Bioscience) for 4h at 37°C and 5% CO2 in RPMI 1640 medium (Sigma) supplemented with 10% FBS, 1% penicillin/streptomycin. For all measurements, dead cell exclusion was performed using fixable viability dye for 405nm (Thermo Fisher). For intracellular staining, cells were permabilized and fixed using the FoxP3 Staining Buffer Kit (eBioscience) and labeled using the respective antibodies. Antibodies used are listed below. Cells were analyzed with the BD FACSCanto II flow cytometer and BD FACSDiva software (BD Bioscience). Data analysis was performed with FlowJo v10 (FlowJo LLC, Ashland, Oregon, USA).
Experimental autoimmune encephalomyelitis (EAE)
Male C57BL/6J mice (Charles River), aged 10-12 weeks, were either fed a NSD, a HSD (Ssniff, as described above) with oral administration of L. murinus or L. reuteri (daily gavage of 200 μl 107 CFU/ml suspension) or a HSD with oral administration of solvent (daily gavage of 200 μl PBS/glycerol). EAE was induced as described previously11. Briefly, mice were anaesthetized and subcutaneously injected with 200 μg MOG35-55 and 200 μg CFA. Pertussis toxin (200 ng/mouse) was applied intraperitoneally on days 0 and 2 post immunization (p.i.). Clinical symptoms were assessed daily according to a 5-point scale ranging from 0 (no symptoms) to 5 (moribund)11. For disease courses, only mice with clinical symptoms were included.
On day 17 p.i., mice were euthanized in anesthesia and CNS tissue was harvested, disrupted with a 5 ml glass homogenizer and strained through a 100 μm cell-strainer. CNS cell suspension was resuspended in 6 ml 30% isotonic Percoll (GE Healthcare) for a three-step density gradient. Lymphocytes were harvested from the interphases, washed and further analyzed by flow cytometry. Spleens were disrupted with a glass homogenizer, filtered through a 100-μm cell strainer and treated with 0.14 M ammonium chloride to lyse erythrocytes. To analyze the early inflammatory response in the small intestine, a subset of mice was euthanized on day 3 p.i. and the small intestine was harvested and processed as described above to obtain LPL.
In two additional experimental setups EAE was induced in male germ-free (GF) C57BL/6J mice fed gamma-sterilized (50 Gy) NSD or HSD diets. First, GF mice were either fed NSD or HSD (2 weeks prior to immunization and thereafter). Second, GF mice were fed NSD and either monocolonized with SFB (by introduction of feces from SFB monocolonized mice) or SFB and L. murinus. In both experimental subgroups intestines were harvested on day 3 p.i. for flow cytometry analyses.
Single-cell suspensions were analyzed by staining for extra- and intracellular markers. Dead cells were excluded by a fixable viability dye eFluor780 (eBioscience), Fc-block was performed using anti-CD16/32 antibody (eBioscience). For intracellular cytokine staining, cells were stimulated with ionomycin (1 μM) and PMA (50 ng/ml) in the presence of monensin (2 μM) for 4 hours. Cells were stained for surface markers with the respective fluorochrome-conjugated antibodies for 30 min and permeabilized using Fixation and Permeabilization Buffer (eBioscience) according to the manufacturer’s protocol. Intracellular cytokines were labeled with the respective fluorochrome-conjugated antibodies for 30-45 min. For antibodies used see below. Cells were analyzed with the BD FACSCanto II flow cytometer and BD FACSDiva software (BD Bioscience). Data analysis was performed with FlowJo (LLC).
For quantitative real-time PCR, tissue was homogenized in 500 μl peqGOLD TriFast with an Ultra-Turrax for 30 s followed by total RNA isolation with PerfectBind RNA Columns (peqGOLD HP Total RNA Kit, Peqlab). RNA yield was quantified by absorbance measurements at 260 nm and reversely transcribed into cDNA using QuantiTect transcriptase (Qiagen). PCR reactions were performed at a 5 μl scale on a qTower real-time PCR System (Analytic Jena, Germany) in triplicates using Taqman Assays (Thermo Fisher) for Il17a (Mm00439618_m1), Rorc (Mm01261019_g1) and Csf2 (Mm01290062_m1). Relative quantification was performed by the ΔΔCT method, normalizing target gene expression on Actb/β-Actin (Mm00607939_s1) as housekeeping gene.
Antibodies used for flow cytometry of murine cells
Anti-CD3ε-FITC and anti-CD3ε-VioBlue (clone 17A2, Miltenyi), anti-CD4-APC-Vio770 (clone GK1.5, Miltenyi), anti-CD4-Pacific Blue and anti-CD4-FITC (clone RM4-5, BD), anti-CD25-VioBlue and anti-CD25-FITC (clone 7D4, Miltenyi), anti-FoxP3-PerCP-Cy5.5 (clone FJK-16s, eBioscience), anti-IFN-γ-PE-Cy7 and anti-IFN-γ-APC (clone XMG1.2, eBioscience), anti-IL-17A-PE (clone eBio17B7, eBioscience), anti-RORγt-APC (clone REA278, Miltenyi).
Electrolyte analysis of mouse feces
Fecal samples from NSD- and HSD-fed mice were collected and stored at -80°C until further analysis. n=7-9 feces samples were pooled, weighed and then processed as described previously62. In brief, samples were weighted, desiccated, ashed, dissolved and measured for Na+ concentration by atomic adsorption spectrometry (Model 3100, Perkin Elmer).
Measurement of intestinal transit
Male FVB/N mice were fed NSD or HSD for 14 days. Mice were administered activated charcoal (0.5 g/10 ml in 0.5% methylcellulose; 0.1 ml/10g body weight by oral gavage). Twenty min later mice were euthanized and the distance travelled by charcoal was measured.
High salt challenge study in healthy humans
We performed an open-label clinical pilot study to investigate the effect of an increased salt intake on cardiovascular and immunoregulatory functions in healthy men (ClinicalTrials.gov identifier: NCT02509962). The study was conducted at the Experimental and Clinical Research Center Berlin (ECRC), Germany, in accordance with the ethical standards of the institutional review board. The institutional review board of Charité University Medicine Berlin approved the study (EA1/138/15) and written informed consent was obtained from all participants prior to study entry. Key inclusion criteria were men, aged 18-50 years and a body mass index between 18.5 and 29.9 kg/m2. Key exclusion criteria were any cardiovascular, metabolic (diabetes), autoimmune, liver and kidney diseases, alcohol or drug abuse. To increase salt intake, subjects (n=12, included until March 2016, for baseline characteristics see Supplementary Information) received 10 coated tablets daily (three with breakfast, three with lunch and four with dinner) for two weeks, each tablet containing 600 mg sodium chloride in a slow release formulation (Slow Sodium Tablets, HK Pharma Ltd., Bedford, UK), yielding an increase of habitual salt intake by 6 g/d. Subjects were asked not to change their dietary habits during the study. Sodium intake from ingested foods and drinks was calculated from dietary records of three consecutive days using OptiDiet Plus software 5.1.2 (GOE mbH, Linden, Germany), a professional analysis software that is based on nutritional content of food as provided by the German Nutrient Database63.
Stool samples were collected at baseline and on day 13 of the high salt challenge from all 12 subjects. Briefly, subjects collected fresh fecal samples using disposable toilet seat covers (Süsse Labortechnik, Gudensberg, Germany) and plastic vessels with spatula (Sarstedt AG, Nümbrecht, Germany). Closed vessels with fecal samples were immediately frozen in a domestic freezer at -20°C and subsequently transferred to the study center on dry ice, where samples were stored at -80°C until further use.
At baseline and on day 13 of the high salt challenge, 8 subjects received ambulatory blood pressure monitors (ABPM, Mobil-O-Graph, I.E.M. GmbH, Stolberg, Germany) for nocturnal blood pressure monitoring (measurements at bed rest every 30 min, subjects indicated bed rest by pressing the day/night button of the ABPM).
Venous blood was taken at baseline and on day 14 of the HSD for immediate isolation of peripheral blood mononuclear cells (PBMC).
Metagenomic sequencing of human fecal samples
Samples were processed, extracted and sequenced as per the procedure in Voigt et al.30 with SpecI31 and mOTU64 taxonomic abundances estimated using MOCAT65. Since Lactobacillus is low-abundance in the human gut, to verify results are robust to changes in the bioinformatic protocol, samples were additionally processed using the complementary tool MetaPhlan66 which uses lineage-specific marker genes as opposed to the universal marker genes informing SpecI and mOTU species quantification, with MetaPhlan species detection results almost identical to mOTU species detection results (Extended Data Figure 10a, b).
Previously published healthy human gut shotgun metagenomes where multiple samples from the same individual at different time points were available were taken from Voigt et al.30 and from the Human Microbiome Project (2012, processed as described in Forslund et al.29). Survival analysis was done using the R 'survival' package67 as outlined by Therneau & Grambsch68.
Human blood cell analysis
Peripheral venous blood was obtained from study participants. Peripheral blood mononuclear cells (PBMCs) were immediately isolated by density centrifugation using Biocoll (Merck, Darmstadt, Germany). 106 CD4+ enriched cell fractions isolated by CD4+ T Cell Kit (Miltenyi) were plated onto U-bottom plates and were restimulated for 4 hours at 37°C, 5% CO2 in a humidified incubator. Restimulation was conducted in a final volume of 200 μl RPMI 1640 (Sigma) supplemented with 10% FBS (Merck), 100 U/ml penicillin (Sigma), 100 mg/ml streptomycin (Sigma), 50 ng/ml PMA (Sigma), 250 ng/ml ionomycin (Sigma) and 1.3 μl/ml Golgistop (BD). After restimulation cells were stained with Life/Dead Fixable Aqua Dead cell kit (Thermo Fisher) and monoclonal CD3-PerCP-Vio700 antibody (clone BW264/56, Miltenyi). Cells were fixed and permeabilized with Foxp3/Transcription Factor Staining Buffer kit (eBioscience) and labeled using anti-IL-17A-APC-Vio770 (clone CZ8-2361, Miltenyi) and anti-TNF-α-eFlour 450 (clone Mab11, eBioscience) monoclonal antibodies. Cells were analyzed using a FACSCanto II flow cytometer and FACSDiva software (BD). Data analysis was performed with FlowJo (LLC).
Murine TH17 cell polarization
Splenic T cells were isolated by magnetic activated cell sorting using the “Pan T cell isolation kit II” (Miltenyi Biotec) according to the manufacturer’s instructions. Isolated T cells were collected and re-suspended in MACS buffer at 3·107 cells/ml. For APC free differentiation, cells were fluorescently stained for 30 min in an antibody cocktail containing anti-CD4-FITC (RM4-5, eBioscience), anti-CD44-PE (IM7, BioLegend), anti-CD62L-APC (MEL-14, eBioscience) and anti-CD25-PE-Cy5 (PC61.5, eBioscience) and subsequently purified by fluorescence activated cell sorting on MoFlo (Beckman-Coulter). Sorted naive T cells (CD4+CD62L+CD44lowCD25neg) were stimulated by plate-bound anti-CD3 (2 μg/ml, 145-2C11, BD Pharmingen) and anti-CD28 (2 μg/ml, 37.51, BD Pharmingen) in the presence of IL-6 (40 ng/ml) and rhTGF-β1 (2 ng/ml). To determine the influence of indole-3 lactic acid on TH17 cell differentiation, cells were cultured with vehicle (0.1% Ethanol) or 10-500 μM indole-3-lactic acid (ILA) for 96h under isotonic or hypertonic (+40 mM NaCl) conditions.
DNA extraction from feces and qPCR of 16S rRNA genes
DNA from stool samples was isolated using QIAamp DNA Stool Mini Kit (Qiagen) according to the manufacturer's instructions. To optimize bacterial community structure representation, a mutanolysin (Sigma) digestion step was included (6 μl of 25kU/ml stock/sample)69. qPCR on a 7500 Sequence Detector (Applied Biosystems, AB) was used to enumerate bacterial 16S rRNA gene copies in the genomic DNA extracted from stool samples. Samples were quantified in 10 μl reactions containing 1x SYBR Green Master Mix (AB), 300 nM of each primer and 4 ng of genomic DNA. Standard curves for quantification consisted in ten-fold serial dilutions in the range of 108 to 100 copies of E. coli (Invitrogen, C404010) or L. murinus isolate 16S rRNA gene amplified with primers 27F (5’-GTTTGATCCTGGCTCAG-3’) and 1492R (5’-CGGCTA CCTTGTTACGAC-3’)70. The total amount of bacterial 16S in stool samples was quantified with the universal primers Univ 337F 5'-ACTCCTACGGGAGGCAGCAGT-3' and Univ 518R 5'-GTATTACCGCGGCTGCTGGCAC-3'71. The total amount of different Lactobacillus DNA in stool samples was quantified using the following primers: L. murinus/animalis72 LactoM-F (5'-TCGAACGAAACTTCTTTATCACC-3'), LactoM-R (5'-CGTTCGCCACTCAACTCTTT-3'); L. brevis73 LbrevF (5'-TGCACTGATTTCAACAATGAAG-3'), LbrevR (5'-CCAGAAGTGATAGCCGAAGC-3'); L. casei/paracasei74 LcaseF (5'-GCACCGAGATTCAACATGG-3'), LcaseR (5'-GGTTCTTGGATCTATGCGGTATTAG-3'); L. delbrueckii74 LdelbF (5'-GGGTGATTTGTTGGACGCTAG-3'), LdelbR (5'-GCCGCCTTTCAAACTTGAATC-3'); L. fermentum75 LfermF (5'-GCACCTGATTGATTTTGGTCG-3'), LactoR (5'-GTCCATTGTGGAAGATTCCC-3'); L. plantarum76 sg-Lpla-F (5'-CTCTGGTATTGATTGGTGCTTGCAT-3'), sg-Lpla-R (5'-GTTCGCCACTCACTCAAATGTAAA-3'); L. rhamnosus74 LrhamF (5'-TGCTTGCATCTTGATTTAATTTTG-3'), LactoR (5'-GTCCATTGTGGAAGATTCCC-3'); L. salivarius75 LsalivF (5'-CGAAACTTTCTTACACCGAATGC-3'), LactoR (5'-GTCCATTGTGGAAGATTCCC-3'). All measurements were performed in duplicates.
Code availability
Code used for the 16S rDNA data analysis has been uploaded to a github repository (https://github.com/almlab/analysis-salt-responsive). Software was obtained from publicly available sources; papers describing the software are cited in the text.
Data availability
Raw files of the bacterial V4-V5 16S rRNA data and the L. murinus genome have been uploaded to the NCBI Sequence Read Archive as Bioproject PRJNA400793. Raw metagenomic data of the human study are available in the European Nucleotide Archive (ENA, accession number PRJEB22348). Reference datasets for the human metagenome analysis are accessible via ENA (accession number ERP009422) and via http://hmpdacc.org/. Numerical source data for all figures are provided with the paper.
Statistics
Power calculation is a prerequisite for any animal experiment according to the local animal law and was performed using G*Power Software Version 3.1.9.2. Effect sizes were calculated from previously published experiments. Animals were randomly assigned to the respective body weight-matched groups, probiotic and control treatment were administered without knowledge of the treatment groups. The human pilot study was performed in an unblinded manner. Data analysis was performed by the investigators without knowledge of the treatment groups or treatment phase, respectively. All findings shown have been reproduced in at least two independent experiments. Data are presented depending on their scale and distribution with arithmetic mean and standard deviation (mean±s.e.m.) or median including 25-75% quartiles (25|75). Unless otherwise specified, boxplots show median and interquartile range (IQR) with whiskers showing minimum and maximum values, bar graphs show mean±s.e.m. Outliers identified by Grubbs’ test were excluded. Normality was assessed by Kolmogorov-Smirnov test. To compare independent measurements, we used a t-test and Mann-Whitney U test, as appropriate. To compare dependent measurements, we used a paired t-test or Wilcoxon signed-rank test, as appropriate. To compare more than two groups, we used one-way ANOVA followed by Tukey’s post-hoc test or Kruskal-Wallis test followed by Dunn’s post hoc test, as appropriate. Statistical analysis was performed using GraphPad Prism 6. Lactobacillus survival times are visualized by Kaplan-Meier curves and statistically compared by Log-rank test.
To analyze mouse blood pressure telemetry data, we conducted repeated measurements analysis by using linear mixed models. We tested a random intercept versus a random intercept-slope model and selected the best-fit model. Data analysis was performed with R (Version 3.1.1 R Foundation, Vienna, Austria) using the packages "lme4" and "nlme". A P value <0.05 was considered statistically significant.
Extended Data
Extended Data Figure 1. Body weight, food, fluid and sodium chloride (NaCl) intake, and intestinal transit in mice fed a NSD or HSD.
Body weight (a), food intake (b), fluid intake (c), NaCl intake from the chow (d), NaCl intake from the drinking water (e) and total NaCl intake (f; sum of NaCl intake from chow and drinking water) in mice fed normal salt diet (NSD, n=8) or high salt diet (HSD, n=8). (g) Measurement of intestinal transit. FVB/N mice were fed NSD (n=8) or HSD (n=9) for 14 days and administered activated charcoal (0.5 g/10 ml in 0.5% methylcellulose; 0.1 ml/10 g body weight by oral gavage). Twenty minutes later mice were euthanized and the distance travelled by charcoal was measured. Bars show mean±s.e.m., circles represent individual mice. **p<0.01, ****p<0.001 using paired two-tailed Student‘s t test for (a-c), one-tailed Wilcoxon matched-pairs signed rank test for (d-f) and unpaired two-tailed Student‘s t test for (g).
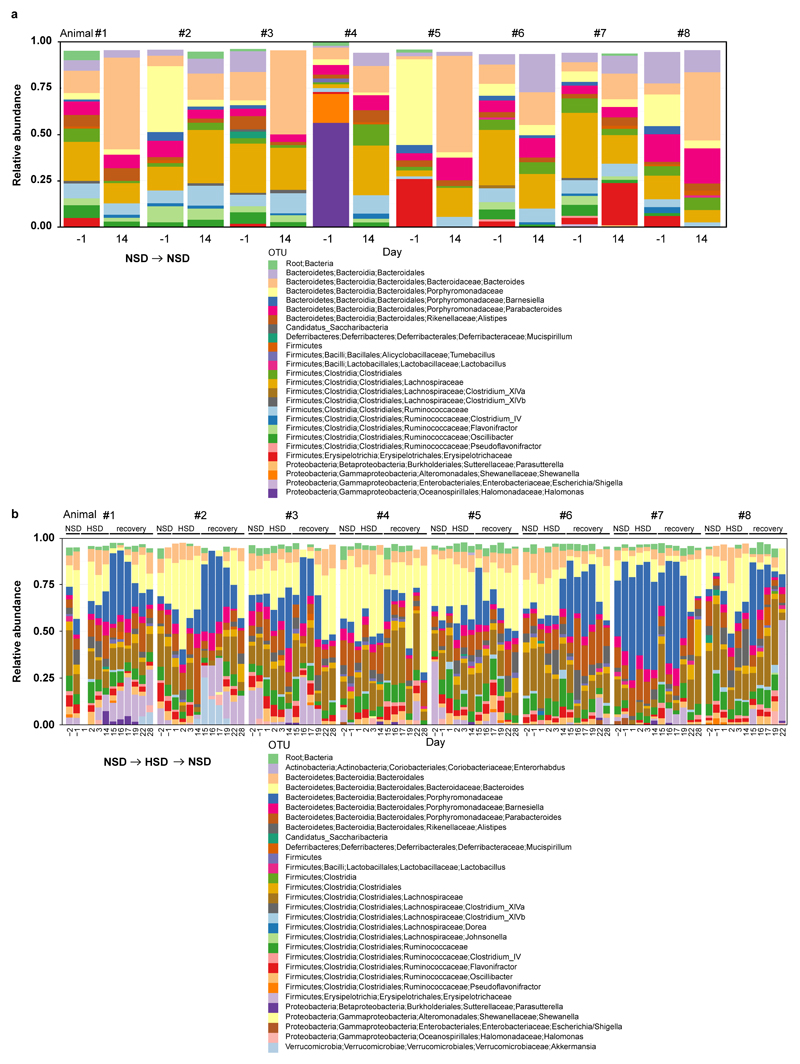
Extended Data Figure 2. Fecal microbiome profiles of mice kept on NSD or HSD over time.
Taxonomic bar charts showing relative abundance of RDP-based OTUs on indicated days. (a) Mice remaining on NSD for 14 days served as NSD controls. Baseline NSD day -1 and NSD day 14 are shown. (b) Separate mice were switched from NSD (days -2 and -1) to HSD for 14 days, and finally re-exposed to NSD for another 14 days (recovery). For time course analyses, fecal samples from baseline NSD days (-1 and -2), early (days 1-3) and late (day 14) HSD days and NSD recovery days (days 15-17, 19, 22, 28) are shown. n=8 mice per group.
Extended Data Figure 3. HSD alters the fecal microbiome and the fecal metabolite profile.
(a) Mouse 16S rDNA fecal microbiome samples do not separate by diet in a MDS ordination (white, NSD samples; black, HSD samples; grey, recovery on NSD). (b) Real-time PCR on DNA extracted from fecal samples of mice fed NSD or HSD using universal 16S rDNA primers (n=8 fecal samples per group from independent mice, indicated by circles; two-tailed Wilcoxon matched-pairs signed rank test). (c) Phylogenetic tree showing changes in microbiome composition caused by HSD. OTUs present in samples from day 14 are indicated by colored circles (red indicates reduction in HSD samples; blue indicates enrichment). The circles’ radii indicate median log fold difference in relative abundance between the two diets. Filled circles mark statistically significant differences (two-tailed Student‘s t-test, Benjamini-Hochberg correction, p<0.05). (d-g) High dietary salt strongly influences the fecal metabolite profile. Male FVB/N mice (n=8) were fed a NSD and then switched to HSD. Metabolites were extracted from fecal pellets taken under NSD (day -3) and HSD (day 13), and analyzed by gas-chromatography mass-spectrometry. (d) HSD samples are clearly distinguishable from NSD samples in a principal component analysis for fecal metabolites. (e) Fecal metabolites clearly cluster by treatment. The majority of fecal metabolites are reduced by HSD. Hierarchically clustered heatmap, metabolites shown in alphabetical order. Metabolites were normalized by subtracting the minimum and dividing by the maximum value across all mice. (f) Fecal levels of the nucleoside adenosine were similar in both diets, suggesting that the change in metabolites is not due to a decrease in overall bacterial biomass. (g) HSD leads to a reduction in total metabolite peak intensities in fecal samples. **p<0.01 two-tailed paired Student‘s t-test for (f, g).
Extended Data Figure 4. Accuracy of AdaBoost and Random Forest classifiers.
(a) AdaBoost and random forest classifiers (trained on samples from days -2, -1, and 14) were used to predict the classification of all samples from HSD mice. The fraction of samples from each time point that the classifiers predicted as belonging to animals currently on a HSD is shown. The two runs of the random forest produced the same fractions, so only one line is shown for the two random forest classifiers. (b) Time series for the other remaining 7 OTUs important to the classifier. NSD and HSD phases are indicated by white and grey backgrounds. Mice (n=12) were switched from NSD to HSD and back to NSD (subgroup of n=8). Other control mice (n=8) remaining on NSD shown in white. Boxplots: median, IQR, whiskers 1.5*IQR, circles represent samples from independent mice.
Extended Data Figure 5. L. murinus genome and in vitro growth of Lactobacilli.
(a) Venn diagram of the coding sequences present in the L. murinus and two other isolates with available with full genome sequences. (b) Bootstrapped phylogenetic tree of full-length 16S rDNA from a variety of Lactobacillus species resident to rodent or human guts. Prevalence of the respective species in the MetaHIT cohort is shown. L. murinus strains are absent in the MetaHIT cohort. (c) Growth yield (OD600) of L. murinus measured at increasing concentrations of NaCl. Aerobic endpoint measurements of liquid L. murinus cultures in MRS medium and increasing NaCl concentrations relative to growth in MRS without the addition of NaCl. n=5 independent experiments. (d) Anaerobic growth yield of L. murinus, A. muciniphila, P. excrementihominis, and C. difficile grown at 37 °C for 48 hours in MGAM liquid medium. Growth at each salt concentration is normalized to growth at 0.086 M Na+. The respective IC50 is indicated. n=3 technical replicates across 2 experiments. (e) Anaerobic growth of selected human Lactobacilli in MGAM medium with increasing NaCl concentrations. Relative growth yield is calculated based on AUCs by comparing to growth in MGAM without the addition of NaCl. n=3 independent experiments with 3 technical replicates. (f) Heatmap showing data as in (e). The respective IC50 is shown in the bottom row. (g) Growth yield of E. coli and L. murinus, grown at 37 °C for 12-16 hours on LB (E.coli) or MRS broth (L. murinus). n=4 technical replicates from two independent experiments. Mean±s.e.m.
Extended Data Figure 6. Indole metabolites in murine fecal samples.
(a) Effect of HSD on fecal indole-3 acetic acid (IAA) and (b) indole-3 carboxaldehyde (IAld) content in FVB/N mice fed a NSD or HSD (n=12 per group in b; n=13 per group in c). (c-d) Germ-free (GF) mice monocolonized with L. murinus showed increased fecal IAA and IAld content (n=8 per group). *p<0.05 using one-tailed Wilcoxon matched-pairs signed rank test for (a-b), ****p<0.0001 using one-tailed Mann-Whitney U test for (c) and ****p<0.0001 using unpaired one-tailed Student’s t-test for (d). n represents independent mice.
Extended Data Figure 7. The effect of Lactobacilli on actively-induced EAE.
(a) Median cumulative clinical EAE scores at day 15, 16 and 17 post immunization (p.i.) of NSD (n=9), HSD (n=11) and HSD mice treated with L. murinus (n=6) starting at the day of immunization. Kruskal-Wallis followed by Dunn's multiple comparisons test *p<0.05, **p<0.01, ***p<0.001. n represents independent mice, indicated by circles. (b) Clinical course of MOG35-55 EAE in NSD mice (black circles, n=7) and NSD mice treated with L. murinus (green squares, n=4. Mean±s.e.m.). *p<0.05 using two-tailed Mann-Whitney U test. (c) Clinical course of MOG35-55 EAE in HSD mice (black circles) and HSD mice treated with L. reuteri (green squares, n=6 independent mice per group, mean±s.e.m.). *p<0.05 using two-tailed Mann-Whitney U test. (d-e) Quantification for CD4+IL-17A+IFN-γ- cells on day 17 of EAE in the spleen (d) and spinal cord (e). n=4 independent mice per group. Mean±s.e.m. *p<0.05 one-tailed Mann-Whitney U test. (f-h) Spinal cords on day 17 of EAE were analyzed by real-time RT-PCR for relative expression of Il17a (f, n=7 for NSD, n=6 for HSD and n=5 for HSD+L. murinus), Rorc (g, n=5 for NSD, n=6 for HSD and n=5 for HSD+L. murinus) and Csf2 (h, n=8 for NSD, n=6 for HSD and n=4 for HSD+L. murinus). Mean±s.e.m. *p<0.05, **p<0.01 using one-way ANOVA followed by Tukey’s post-hoc test. (i) Quantification of IFN-γ-producing TH1 cells in siLPL on day 3 of EAE (n=4 per group) and quantification of IFN-γ producing TH1 cells in spleen (n=4 per group) and spinal cord on day 17 of EAE (n=5 for NSD, n=6 for HSD and n=5 for HSD+L. murinus). n indicates number of independent mice per group. Mean±s.e.m. ns=not significant by one-way ANOVA. (j-m) Fecal indole metabolites were determined in MOG35-55 EAE mice by LC-MS/MS analysis. Effect of HSD on fecal IAA (j) and IAld (k) content on day 10 p.i. (n=5 per group for j, n=4 for NSD and n=5 for HSD in k). Fecal IAA (l) and IAld (m) content in MOG35-55 EAE mice fed HSD with or without concomitant L. murinus treatment on day 10 p.i. (n=7 per group for l, n=8 for HSD and n=7 for HSD+L. murinus for m). *p<0.05 using unpaired one-tailed Student’s t-test for (j and l-m) and one-tailed Wilcoxon matched-pairs signed rank test for (k). n indicates number of independent mice per group.
Extended Data Figure 8. Actively-induced EAE in gnotobiotic mice.
(a, b) HSD fails to induce intestinal TH17 cells in germ-free MOG35-55 EAE mice (n=5 for GF+NSD and n=6 for GF+HSD). (a) Analysis of IL-17A and IFN-γ in CD4+ siLPL isolated from NSD or HSD-fed MOG35-55 immunized germ-free mice (day 3 p.i.). Representative flow cytometry plots (left) show one mouse per group. Quantifications show frequencies of CD4+IL-17A+IFN-γ- (middle) and CD4+IL-17A+IFN-γ+ (right) cells and (b) CD4+ RORγt+ frequencies in siLPL. (c-d) L. murinus reduces small intestinal (siLPL) and colonic (cLPL) lamina propria TH17 cells in EAE mice colonized with segmented filamentous bacteria (SFB). MOG35-55 EAE was induced in GF mice monocolonized with SFB (GF+SFB) and GF mice colonized with SFB and L. murinus (GF+SFB+L. murinus). LPL were isolated on day 3 p.i. (c) Left panel shows representative flow cytometry plots demonstrating IL-17A and IFN-γ expression in CD4+ siLPL (one mouse per group). Middle panel shows quantification of CD4+IL-17A+IFN-γ- siLPL (n=9 for GF+SFB, n=8 for GF+SFB+L. murinus). Right panel shows quantification of CD4+RORγt+ siLPL (n=9 mice per group). (d) Left panel shows representative flow cytometry plots (one mouse per group) depicting IL-17A and IFN-γ expression in CD4+ cLPL. Middle and right panel show quantification of CD4+IL-17A+IFN-γ- (n=8 for GF+SFB, n=9 for GF+SFB+L. murinus) and CD4+ IL-17A+IFN-γ+ cLPL (n=8 per group). All bar graphs show mean±s.e.m, circles represent independent mice. *p<0.05, ***p<0.001 unpaired one-tailed Student’s t-test for (a-d).
Extended Data Figure 9. Treatment with L. murinus or L. reuteri ameliorates salt-sensitive hypertension.
(a) Mean diastolic pressures over time in response to HSD and HSD with concomitant L. murinus treatment in n=7 FVB/N mice. Scale bar indicates 24 hours. Horizontal line indicates the mean across all values of the respective phase. (b, c) Mean systolic (b) and diastolic (c) blood pressures in these mice (n=7) fed a HSD (black curve) and HSD with concomitant L. murinus treatment at circadian scale. Arrows indicate the time of L. murinus gavage. (d, e) Boxplots (median, IQR, whiskers 1.5*IQR) show systolic (d) and diastolic (e) blood pressures recorded continuously in FVB/N mice fed a HSD and a HSD with concomitant L. reuteri treatment. These mice (n=9) were fed a HSD for 10 days prior to concomitant L. reuteri treatment for another 7 days. ***p<0.001 vs. HSD using linear mixed model. (f, g) Boxplots (median, IQR, whiskers 1.5*IQR) show systolic (f) and diastolic (g) blood pressures in mice (n=5) fed a HSD and a HSD with concomitant Escherichia coli Nissle 1917 (E. coli) treatment for 3 days, respectively. Statistics using linear mixed model. (h-j) Quantification of CD4+IL-17A-IFN-γ+ lymphocytes in siLPL (h, n=5 for NSD, n=7 for HSD, n=6 for HSD+L. murinus) and cLPL and spleen, respectively (i-j, n=5 for NSD, n=6 for HSD, n=6 for HSD+L. murinus). All bars show mean±s.e.m, circles represent independent mice. *p<0.05 using Kruskal-Wallis and Dunn’s post-hoc test for (h), one-way ANOVA for (i-j).
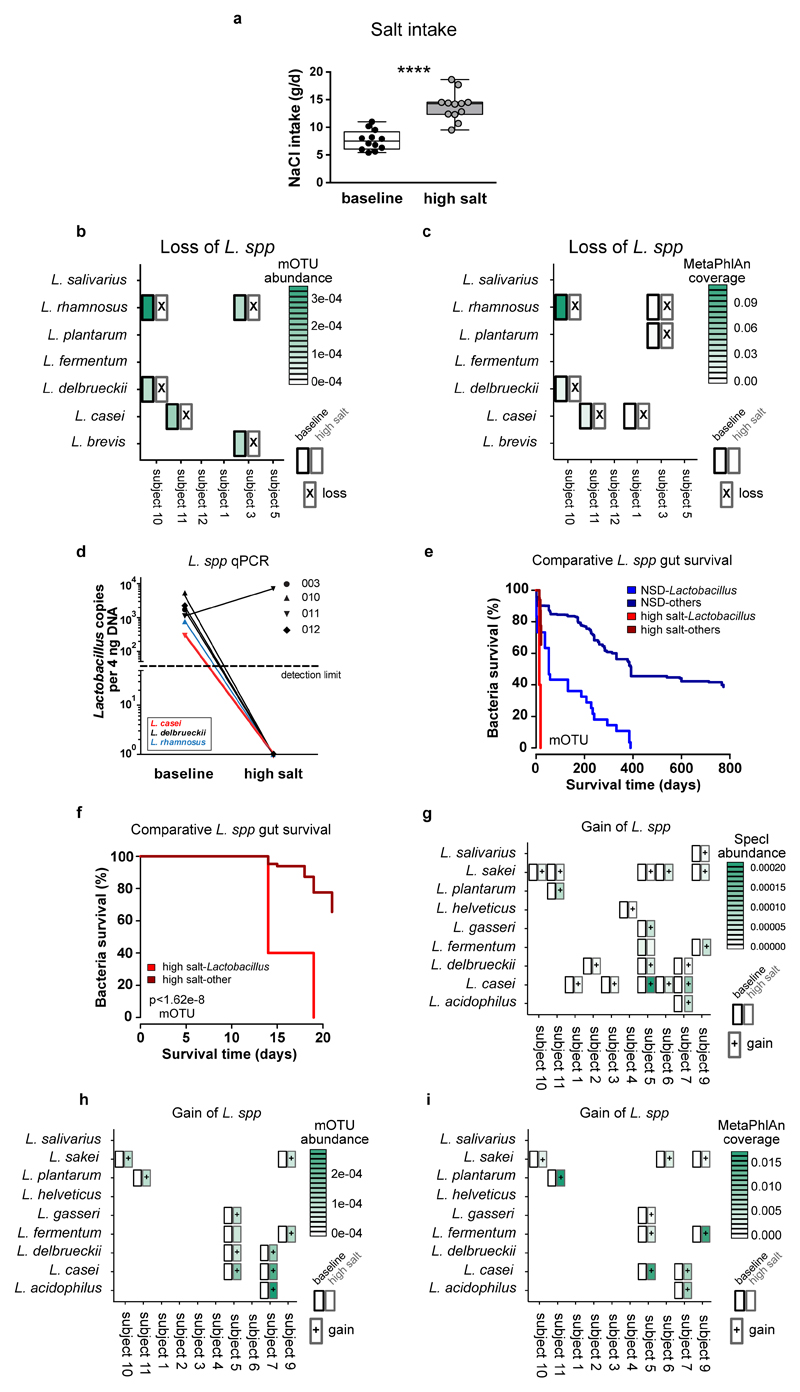
Extended Data Figure 10. High salt challenge in healthy human subjects.
(a) Total salt intake according to dietary records (n=12, paired one-tailed t-test). (b, c) Metagenome analysis shows loss of Lactobacillus gut populations during human high salt challenge. Shown are all subjects (horizontal axis) for which gut Lactobacilli were detected at baseline and all species so detected (vertical axis) using the mOTU (b) or MetaPhlAn framework (c) for bacterial species identification. Heatmap cells show abundance for mOTU (insert counts as fraction of sample total) or average coverage (reads per position) for MetaPhlAn of these Lactobacilli at baseline (left part of cells, black border) and after high salt challenge (right part of cells, grey border). Cross markers show complete loss (nondetection after high salt challenge) of each species. In all cases but one (shown), baseline Lactobacillus populations are no longer detected post high salt. (d) qPCR using Lactobacillus-specific 16S rDNA primers in human fecal samples positive for Lactobacillus at baseline show a loss of the respective species after 14 days of high salt. Lactobacillus 16S rDNA copy number in 4 ng fecal DNA is shown. Symbols indicate study subject, colors indicate respective Lactobacillus species. (e) Kaplan-Meier survival curves contrasting the fate of gut Lactobacillus populations (detected using the mOTU framework) following high salt challenge (bright red curve) and in healthy control individuals from reference cohorts (n=121, see methods) not undergoing any intervention (bright blue curve). This is compared with corresponding survival curves over time for the set of all other detected gut bacterial species following high salt challenge (high salt-others, dark red curve) and without such challenge in controls (NSD-others, dark blue curve). (f) For a clearer view of its time range only the salt intervention curves from (e) are shown. Two observations are clear. First, Lactobacillus on average persist for shorter times in the gut than the average over all other species. Second, a high salt challenge strongly increases gut loss of both Lactobacillus and non-Lactobacillus species. As such, in combination, Lactobacillus loss is highly pronounced under high salt intervention and significantly (p<1.62e-8) faster than the average over all species. (g-i) Metagenome analysis shows introduction of novel Lactobacillus gut populations during human high salt challenge. Shown are all subjects (horizontal axis) for which gut Lactobacilli were detected following high salt challenge, and all species so detected (vertical axis) using the SpecI (g), mOTU (h) or MetaPhlAn (i). Heatmap cells show abundance (insert counts as fraction of sample total for SpecI and mOTU) and average coverage (reads per position for MetaPhlAn) of these Lactobacilli at baseline (left part of cells, black border) and after high salt challenge (right part of cells, gray border). Cross markers show novel introduction (nondetection at baseline) of each species.
Supplementary Material
Acknowledgements
We thank Gabriele N’diaye, Ilona Kamer, Silvia Seubert, Petra Voss, Juliane Anders, Christiane Schmidt, Anneleen Geuzens, Rajna Hercog and Stefanie Kandels-Lewis for assistance. We thank John J. Mullins and Friedrich C. Luft for their support. This study was funded by grants from the German Centre for Cardiovascular Research (DZHK; BER 1.1 VD), the Center for Microbiome Informatics and Therapeutics, and the MetaCardis consortium. D.N.M., J.J. and M.G. were supported by the German Research Foundation (DFG). R.A.L. holds an endowed professorship supported by Novartis Pharma. M.K. was supported by the European Research Council (ERC) under the European Union’s Horizon 2020 research and innovation program (640116), by a SALK-grant from the government of Flanders, Belgium and by an Odysseus-grant of the Research Foundation Flanders (FWO), Belgium. L. reuteri was kindly provided by L. Romani.
Footnotes
Author Contributions N.W. led and conceived the project, designed and performed most experiments, analyzed and interpreted the data. M.G.M., S.W.O., S.M.K. performed 16S sequencing and data analysis. S.H., D.T., M.Ba., C.W. performed animal experiments and analyzed data. H.B., S.H., A.B., D.A.G., B.F.C. performed and analyzed flow cytometry. Li.Ma., S.M.K., V.S., P.N., R.G.G. performed bacterial growth experiments. O.V., C.F. performed metabolite analysis with input by A.B. and M.G.M. La.M., F.H.K. and L.K. performed 16S qPCR. N.R. performed sodium analyses. K.F. performed metagenomic analyses with contributions by P.I.C. and S.S. M.Bo., R.D. and A.M. conducted the clinical study. A.K. performed statistical analyses. M.G., A.T., J.M.T, S.K., P.B., J.J. supervised the experiments and analyses. D.N.M., E.J.A., M.K. and R.A.L. conceived the project, supervised the experiments and interpreted the data. N.W. and D.N.M. wrote the manuscript with key editing by E.J.A., R.A.L., M.K., K.F. and further input from all authors.
Author Information The authors declare no competing financial interests.
References
- 1.Manzel A, et al. Role of "Western diet" in inflammatory autoimmune diseases. Current allergy and asthma reports. 2014;14:404. doi: 10.1007/s11882-013-0404-6. [DOI] [PMC free article] [PubMed] [Google Scholar]
- 2.O'Donnell M, et al. Urinary sodium and potassium excretion, mortality, and cardiovascular events. The New England journal of medicine. 2014;371:612–623. doi: 10.1056/NEJMoa1311889. [DOI] [PubMed] [Google Scholar]
- 3.Weber MA, et al. Clinical practice guidelines for the management of hypertension in the community a statement by the American Society of Hypertension and the International Society of Hypertension. Journal of hypertension. 2014;32:3–15. doi: 10.1097/HJH.0000000000000065. [DOI] [PubMed] [Google Scholar]
- 4.Taylor J. 2013 ESH/ESC guidelines for the management of arterial hypertension. European heart journal. 2013;34:2108–2109. [PubMed] [Google Scholar]
- 5.Mozaffarian D, et al. Global sodium consumption and death from cardiovascular causes. The New England journal of medicine. 2014;371:624–634. doi: 10.1056/NEJMoa1304127. [DOI] [PubMed] [Google Scholar]
- 6.Coffman TM. Under pressure: the search for the essential mechanisms of hypertension. Nature medicine. 2011;17:1402–1409. doi: 10.1038/nm.2541. [DOI] [PubMed] [Google Scholar]
- 7.Wenzel U, et al. Immune Mechanisms in Arterial Hypertension. Journal of the American Society of Nephrology : JASN. 2016;27:677–686. doi: 10.1681/ASN.2015050562. [DOI] [PMC free article] [PubMed] [Google Scholar]
- 8.Guzik TJ, et al. Role of the T cell in the genesis of angiotensin II induced hypertension and vascular dysfunction. The Journal of experimental medicine. 2007;204:2449–2460. doi: 10.1084/jem.20070657. [DOI] [PMC free article] [PubMed] [Google Scholar]
- 9.Madhur MS, et al. Interleukin 17 promotes angiotensin II-induced hypertension and vascular dysfunction. Hypertension. 2010;55:500–507. doi: 10.1161/HYPERTENSIONAHA.109.145094. [DOI] [PMC free article] [PubMed] [Google Scholar]
- 10.Norlander AE, et al. Interleukin-17A Regulates Renal Sodium Transporters and Renal Injury in Angiotensin II-Induced Hypertension. Hypertension. 2016;68:167–174. doi: 10.1161/HYPERTENSIONAHA.116.07493. [DOI] [PMC free article] [PubMed] [Google Scholar]
- 11.Kleinewietfeld M, et al. Sodium chloride drives autoimmune disease by the induction of pathogenic TH17 cells. Nature. 2013;496:518–522. doi: 10.1038/nature11868. [DOI] [PMC free article] [PubMed] [Google Scholar]
- 12.Wu C, et al. Induction of pathogenic TH17 cells by inducible salt-sensing kinase SGK1. Nature. 2013;496:513–517. doi: 10.1038/nature11984. [DOI] [PMC free article] [PubMed] [Google Scholar]
- 13.Miossec P, Korn T, Kuchroo VK. Interleukin-17 and type 17 helper T cells. The New England journal of medicine. 2009;361:888–898. doi: 10.1056/NEJMra0707449. [DOI] [PubMed] [Google Scholar]
- 14.Bettelli E. Building different mouse models for human MS. Annals of the New York Academy of Sciences. 2007;1103:11–18. doi: 10.1196/annals.1394.021. [DOI] [PubMed] [Google Scholar]
- 15.David LA, et al. Diet rapidly and reproducibly alters the human gut microbiome. Nature. 2014;505:559–563. doi: 10.1038/nature12820. [DOI] [PMC free article] [PubMed] [Google Scholar]
- 16.Turnbaugh PJ, et al. An obesity-associated gut microbiome with increased capacity for energy harvest. Nature. 2006;444:1027–1031. doi: 10.1038/nature05414. [DOI] [PubMed] [Google Scholar]
- 17.Honda K, Littman DR. The microbiota in adaptive immune homeostasis and disease. Nature. 2016;535:75–84. doi: 10.1038/nature18848. [DOI] [PubMed] [Google Scholar]
- 18.Ivanov II, et al. Induction of intestinal Th17 cells by segmented filamentous bacteria. Cell. 2009;139:485–498. doi: 10.1016/j.cell.2009.09.033. [DOI] [PMC free article] [PubMed] [Google Scholar]
- 19.Sun Z, et al. Expanding the biotechnology potential of lactobacilli through comparative genomics of 213 strains and associated genera. Nature communications. 2015;6:8322. doi: 10.1038/ncomms9322. [DOI] [PMC free article] [PubMed] [Google Scholar]
- 20.Wannemuehler MJ, Overstreet AM, Ward DV, Phillips GJ. Draft genome sequences of the altered schaedler flora, a defined bacterial community from gnotobiotic mice. Genome announcements. 2014;2 doi: 10.1128/genomeA.00287-14. [DOI] [PMC free article] [PubMed] [Google Scholar]
- 21.Li J, et al. An integrated catalog of reference genes in the human gut microbiome. Nature biotechnology. 2014;32:834–841. doi: 10.1038/nbt.2942. [DOI] [PubMed] [Google Scholar]
- 22.Zelante T, et al. Tryptophan catabolites from microbiota engage aryl hydrocarbon receptor and balance mucosal reactivity via interleukin-22. Immunity. 2013;39:372–385. doi: 10.1016/j.immuni.2013.08.003. [DOI] [PubMed] [Google Scholar]
- 23.Jangi S, et al. Alterations of the human gut microbiome in multiple sclerosis. Nature communications. 2016;7 doi: 10.1038/ncomms12015. 12015. [DOI] [PMC free article] [PubMed] [Google Scholar]
- 24.Berer K, et al. Commensal microbiota and myelin autoantigen cooperate to trigger autoimmune demyelination. Nature. 2011;479:538–541. doi: 10.1038/nature10554. [DOI] [PubMed] [Google Scholar]
- 25.Haghikia A, et al. Dietary Fatty Acids Directly Impact Central Nervous System Autoimmunity via the Small Intestine. Immunity. 2015;43:817–829. doi: 10.1016/j.immuni.2015.09.007. [DOI] [PubMed] [Google Scholar]
- 26.Rothhammer V, et al. Type I interferons and microbial metabolites of tryptophan modulate astrocyte activity and central nervous system inflammation via the aryl hydrocarbon receptor. Nature medicine. 2016;22:586–597. doi: 10.1038/nm.4106. [DOI] [PMC free article] [PubMed] [Google Scholar]
- 27.Khalesi S, Sun J, Buys N, Jayasinghe R. Effect of probiotics on blood pressure: a systematic review and meta-analysis of randomized, controlled trials. Hypertension. 2014;64:897–903. doi: 10.1161/HYPERTENSIONAHA.114.03469. [DOI] [PubMed] [Google Scholar]
- 28.Hansen TW, et al. Predictive role of the nighttime blood pressure. Hypertension. 2011;57:3–10. doi: 10.1161/HYPERTENSIONAHA.109.133900. [DOI] [PubMed] [Google Scholar]
- 29.Forslund K, et al. Country-specific antibiotic use practices impact the human gut resistome. Genome research. 2013;23:1163–1169. doi: 10.1101/gr.155465.113. [DOI] [PMC free article] [PubMed] [Google Scholar]
- 30.Voigt AY, et al. Temporal and technical variability of human gut metagenomes. Genome biology. 2015;16:73. doi: 10.1186/s13059-015-0639-8. [DOI] [PMC free article] [PubMed] [Google Scholar]
- 31.Mende DR, Sunagawa S, Zeller G, Bork P. Accurate and universal delineation of prokaryotic species. Nature methods. 2013;10:881–884. doi: 10.1038/nmeth.2575. [DOI] [PubMed] [Google Scholar]
- 32.Farez MF, Fiol MP, Gaitan MI, Quintana FJ, Correale J. Sodium intake is associated with increased disease activity in multiple sclerosis. Journal of neurology, neurosurgery, and psychiatry. 2015;86:26–31. doi: 10.1136/jnnp-2014-307928. [DOI] [PubMed] [Google Scholar]
- 33.Fitzgerald KC, et al. Sodium intake and multiple sclerosis activity and progression in BENEFIT. Annals of neurology. 2017;82:20–29. doi: 10.1002/ana.24965. [DOI] [PMC free article] [PubMed] [Google Scholar]
- 34.Lamas B, et al. CARD9 impacts colitis by altering gut microbiota metabolism of tryptophan into aryl hydrocarbon receptor ligands. Nature medicine. 2016;22:598–605. doi: 10.1038/nm.4102. [DOI] [PMC free article] [PubMed] [Google Scholar]
- 35.Wang Y, et al. Kynurenine is an endothelium-derived relaxing factor produced during inflammation. Nature medicine. 2010;16:279–285. doi: 10.1038/nm.2092. [DOI] [PMC free article] [PubMed] [Google Scholar]
- 36.Binger KJ, et al. High salt reduces the activation of IL-4- and IL-13-stimulated macrophages. The Journal of clinical investigation. 2015;125:4223–4238. doi: 10.1172/JCI80919. [DOI] [PMC free article] [PubMed] [Google Scholar]
- 37.Eil R, et al. Ionic immune suppression within the tumour microenvironment limits T cell effector function. Nature. 2016;537:539–543. doi: 10.1038/nature19364. [DOI] [PMC free article] [PubMed] [Google Scholar]
- 38.Hernandez AL, et al. Sodium chloride inhibits the suppressive function of FOXP3+ regulatory T cells. The Journal of clinical investigation. 2015;125:4212–4222. doi: 10.1172/JCI81151. [DOI] [PMC free article] [PubMed] [Google Scholar]
- 39.Jantsch J, et al. Cutaneous Na+ storage strengthens the antimicrobial barrier function of the skin and boosts macrophage-driven host defense. Cell metabolism. 2015;21:493–501. doi: 10.1016/j.cmet.2015.02.003. [DOI] [PMC free article] [PubMed] [Google Scholar]
- 40.Cox LM, et al. Altering the intestinal microbiota during a critical developmental window has lasting metabolic consequences. Cell. 2014;158:705–721. doi: 10.1016/j.cell.2014.05.052. [DOI] [PMC free article] [PubMed] [Google Scholar]
- 41.Tamburini S, Shen N, Wu HC, Clemente JC. The microbiome in early life: implications for health outcomes. Nature medicine. 2016;22:713–722. doi: 10.1038/nm.4142. [DOI] [PubMed] [Google Scholar]
- 42.Martinez I, et al. The gut microbiota of rural papua new guineans: composition, diversity patterns, and ecological processes. Cell reports. 2015;11:527–538. doi: 10.1016/j.celrep.2015.03.049. [DOI] [PubMed] [Google Scholar]
- 43.Caporaso JG, et al. Ultra-high-throughput microbial community analysis on the Illumina HiSeq and MiSeq platforms. The ISME journal. 2012;6:1621–1624. doi: 10.1038/ismej.2012.8. [DOI] [PMC free article] [PubMed] [Google Scholar]
- 44.Preheim SP, Perrotta AR, Martin-Platero AM, Gupta A, Alm EJ. Distribution-based clustering: using ecology to refine the operational taxonomic unit. Applied and environmental microbiology. 2013;79:6593–6603. doi: 10.1128/AEM.00342-13. [DOI] [PMC free article] [PubMed] [Google Scholar]
- 45.Edgar RC, Flyvbjerg H. Error filtering, pair assembly and error correction for next-generation sequencing reads. Bioinformatics. 2015;31:3476–3482. doi: 10.1093/bioinformatics/btv401. [DOI] [PubMed] [Google Scholar]
- 46.Wang Q, Garrity GM, Tiedje JM, Cole JR. Naive Bayesian classifier for rapid assignment of rRNA sequences into the new bacterial taxonomy. Applied and environmental microbiology. 2007;73:5261–5267. doi: 10.1128/AEM.00062-07. [DOI] [PMC free article] [PubMed] [Google Scholar]
- 47.Edgar RC. Search and clustering orders of magnitude faster than BLAST. Bioinformatics. 2010;26:2460–2461. doi: 10.1093/bioinformatics/btq461. [DOI] [PubMed] [Google Scholar]
- 48.Vegan: Community Ecology Package. R package version 2.3–0. 2015. [Google Scholar]
- 49.Caporaso JG, et al. PyNAST: a flexible tool for aligning sequences to a template alignment. Bioinformatics. 2010;26:266–267. doi: 10.1093/bioinformatics/btp636. [DOI] [PMC free article] [PubMed] [Google Scholar]
- 50.Sievers F, et al. Fast, scalable generation of high-quality protein multiple sequence alignments using Clustal Omega. Molecular systems biology. 2011;7:539. doi: 10.1038/msb.2011.75. [DOI] [PMC free article] [PubMed] [Google Scholar]
- 51.Price MN, Dehal PS, Arkin AP. FastTree 2--approximately maximum-likelihood trees for large alignments. PloS one. 2010;5:e9490. doi: 10.1371/journal.pone.0009490. [DOI] [PMC free article] [PubMed] [Google Scholar]
- 52.Paradis E, Claude J, Strimmer K. APE: Analyses of Phylogenetics and Evolution in R language. Bioinformatics. 2004;20:289–290. doi: 10.1093/bioinformatics/btg412. [DOI] [PubMed] [Google Scholar]
- 53.Freund Y, Schapire RE. A Decision-Theoretic Generalization of On-Line Learning and an Application to Boosting. Journal of Computer and System Sciences. 1997;55:119–139. doi: 10.1006/jcss.1997.1504. [DOI] [Google Scholar]
- 54.Pedregosa F, et al. Scikit-learn: Machine Learning in Python. Journal of Machine Learning Research. 2011;12:2825–2830. [Google Scholar]
- 55.Breiman L. Random Forests. Machine Learning. 2001;45:5–32. doi: 10.1023/A:1010933404324. [DOI] [Google Scholar]
- 56.Pietzke M, Zasada C, Mudrich S, Kempa S. Decoding the dynamics of cellular metabolism and the action of 3-bromopyruvate and 2-deoxyglucose using pulsed stable isotope-resolved metabolomics. Cancer & metabolism. 2014;2:9. doi: 10.1186/2049-3002-2-9. [DOI] [PMC free article] [PubMed] [Google Scholar]
- 57.Kuich PH, Hoffmann N, Kempa S. Maui-VIA: A User-Friendly Software for Visual Identification, Alignment, Correction, and Quantification of Gas Chromatography-Mass Spectrometry Data. Frontiers in bioengineering and biotechnology. 2014;2:84. doi: 10.3389/fbioe.2014.00084. [DOI] [PMC free article] [PubMed] [Google Scholar]
- 58.Hartemink R, Domenech VR, Rombouts FM. LAMVAB—A new selective medium for the isolation of lactobacilli from faeces. Journal of microbiological methods. 1997;29:77–84. doi: 10.1016/S0167-7012(97)00025-0. [DOI] [Google Scholar]
- 59.Gomila M, et al. Genotypic and phenotypic applications for the differentiation and species-level identification of achromobacter for clinical diagnoses. PloS one. 2014;9:e114356. doi: 10.1371/journal.pone.0114356. [DOI] [PMC free article] [PubMed] [Google Scholar]
- 60.Itani HA, et al. CD70 Exacerbates Blood Pressure Elevation and Renal Damage in Response to Repeated Hypertensive Stimuli. Circulation research. 2016;118:1233–1243. doi: 10.1161/CIRCRESAHA.115.308111. [DOI] [PMC free article] [PubMed] [Google Scholar]
- 61.Atarashi K, Honda K. Analysis of murine lamina propria TH17 cells. 2008 doi: 10.1016/j.vaccine.2010.09.026. [DOI] [PubMed] [Google Scholar]
- 62.Wiig H, et al. Immune cells control skin lymphatic electrolyte homeostasis and blood pressure. The Journal of clinical investigation. 2013;123:2803–2815. doi: 10.1172/JCI60113. [DOI] [PMC free article] [PubMed] [Google Scholar]
- 63.Mahler A, et al. Increased catabolic state in spinocerebellar ataxia type 1 patients. Cerebellum. 2014;13:440–446. doi: 10.1007/s12311-014-0555-6. [DOI] [PubMed] [Google Scholar]
- 64.Sunagawa S, et al. Metagenomic species profiling using universal phylogenetic marker genes. Nature methods. 2013;10:1196–1199. doi: 10.1038/nmeth.2693. [DOI] [PubMed] [Google Scholar]
- 65.Kultima JR, et al. MOCAT2: a metagenomic assembly, annotation and profiling framework. Bioinformatics. 2016 doi: 10.1093/bioinformatics/btw183. [DOI] [PMC free article] [PubMed] [Google Scholar]
- 66.Segata N, et al. Metagenomic microbial community profiling using unique clade-specific marker genes. Nature methods. 2012;9:811–814. doi: 10.1038/nmeth.2066. [DOI] [PMC free article] [PubMed] [Google Scholar]
- 67.Therneau TM. A Package for Survival Analysis in S. Version 2.38. 2015. [Google Scholar]
- 68.Therneau TM, Grambsch PM. Modeling Survival Data: Extending the Cox Model. Springer-Verlag; New York: 2000. [Google Scholar]
- 69.Yuan S, Cohen DB, Ravel J, Abdo Z, Forney LJ. Evaluation of methods for the extraction and purification of DNA from the human microbiome. PloS one. 2012;7:e33865. doi: 10.1371/journal.pone.0033865. [DOI] [PMC free article] [PubMed] [Google Scholar]
- 70.Caesar R, Tremaroli V, Kovatcheva-Datchary P, Cani PD, Backhed F. Crosstalk between Gut Microbiota and Dietary Lipids Aggravates WAT Inflammation through TLR Signaling. Cell metabolism. 2015;22:658–668. doi: 10.1016/j.cmet.2015.07.026. [DOI] [PMC free article] [PubMed] [Google Scholar]
- 71.Bergstrom A, et al. Introducing GUt low-density array (GULDA): a validated approach for qPCR-based intestinal microbial community analysis. FEMS microbiology letters. 2012;337:38–47. doi: 10.1111/1574-6968.12004. [DOI] [PubMed] [Google Scholar]
- 72.Bindels LB, et al. Restoring specific lactobacilli levels decreases inflammation and muscle atrophy markers in an acute leukemia mouse model. PloS one. 2012;7:e37971. doi: 10.1371/journal.pone.0037971. [DOI] [PMC free article] [PubMed] [Google Scholar]
- 73.Duniere L, et al. Impact of adding Saccharomyces strains on fermentation, aerobic stability, nutritive value, and select lactobacilli populations in corn silage. Journal of animal science. 2015;93:2322–2335. doi: 10.2527/jas.2014-8287. [DOI] [PubMed] [Google Scholar]
- 74.Byun R, et al. Quantitative analysis of diverse Lactobacillus species present in advanced dental caries. Journal of clinical microbiology. 2004;42:3128–3136. doi: 10.1128/JCM.42.7.3128-3136.2004. [DOI] [PMC free article] [PubMed] [Google Scholar]
- 75.Cui Y, et al. Different Effects of Three Selected Lactobacillus Strains in Dextran Sulfate Sodium-Induced Colitis in BALB/c Mice. PloS one. 2016;11:e0148241. doi: 10.1371/journal.pone.0148241. [DOI] [PMC free article] [PubMed] [Google Scholar]
- 76.Matsuda K, et al. Establishment of an analytical system for the human fecal microbiota, based on reverse transcription-quantitative PCR targeting of multicopy rRNA molecules. Applied and environmental microbiology. 2009;75:1961–1969. doi: 10.1128/AEM.01843-08. [DOI] [PMC free article] [PubMed] [Google Scholar]
Associated Data
This section collects any data citations, data availability statements, or supplementary materials included in this article.
Supplementary Materials
Data Availability Statement
Raw files of the bacterial V4-V5 16S rRNA data and the L. murinus genome have been uploaded to the NCBI Sequence Read Archive as Bioproject PRJNA400793. Raw metagenomic data of the human study are available in the European Nucleotide Archive (ENA, accession number PRJEB22348). Reference datasets for the human metagenome analysis are accessible via ENA (accession number ERP009422) and via http://hmpdacc.org/. Numerical source data for all figures are provided with the paper.


