Figure 6.
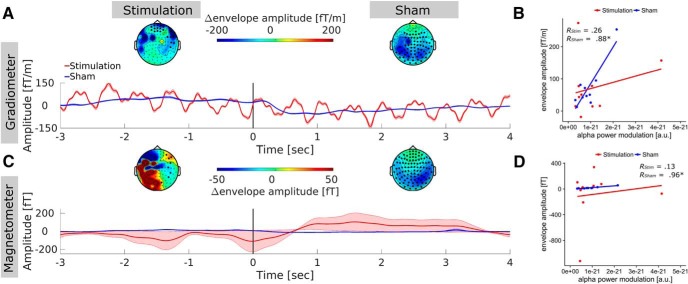
Event-related artifact envelope. A, Topography and time course of the artifact envelope around stimulus onset in gradiometer sensors. Topographies represent the amplitude difference of the envelope, around the stimulation frequency between the reference (–2.5 to –0.5 s) and the testing periods (0–2 s). Darkened sensors mark locations in which this difference was significant. Data of the sham group is depicted for comparison and reflects the task-related modulation of endogenous alpha oscillations (visible shortly after stimulus onset, vertical black bar at 0 s) as no stimulation artifact was introduced to the data. Envelope epochs of all subjects were demeaned before averaging to enhance comparability of the envelope modulation. Shaded areas depict standard error of the mean (SEM). Gradiometer time courses were strongly dominated by rhythmic modulation around 1–2 Hz that potentially reflects a technical artifact in this sensor type. B, Correlation between event-related modulation of the artifact envelope in gradiometer sensors and event-related alpha-power modulation within the ROI after beamforming. The absence of a significant (or even moderately high) correlation in the stimulation group provides supporting evidence that the effects observed in source-space are not driven by systematic event-related modulations of tACS artifact strength. C, Topography and time course of the artifact envelope around stimulus onset in magnetometer sensors. D, Correlation between event-related modulation of the artifact envelope in magnetometers and alpha-power modulation within ROI after beamforming. Similar to the gradiometer data, no correlation between source-level effects and artifact tACS artifact modulation was observed.

