Abstract
Both deep understanding and reliable prediction of postoperative soft tissue changes are crucial for planning orthognathic surgery. Instead of estimating soft tissue responses by measuring individual landmark changes, this study aimed to investigate the relationship (ratio) between soft and hard tissue movements in different facial regions through three-dimensional cone-beam computed tomography (CBCT). Preoperative and postoperative CBCT images were superimposed using the surface registration method on the basis of the cranial base, and 10 facial regions of interest were defined. Region-based volumetric subtractions between the preoperative and postoperative segments were performed. The volumetric differences and surface of each region were used to estimate the average movement. Correlation and regression analyses were performed to examine the relationships between the corresponding soft and hard tissue movements. An overall pattern of facial soft tissue movement was observed in patients with prognathism who underwent orthognathic surgery. The experiment results have shown that mean ratios for the average soft-to-hard tissue movements in the facial regions varied, which may not exactly be similar to the published reports because of the population biocharacteristics and study methods, but the trend is in agreement with the previous studies. Additionally, the prediction capability of the regression model was significantly high, ranging from 0.786 to 0.857, in upper lip, upper vermilion, and chin regions, thus demonstrating that the skin outline changes in these critical regions could be reliably predicted from the underlying bone movements. These results could likely be applied in future soft tissue simulation in orthognathic surgery.
Introduction
Orthognathic surgery corrects maxillomandibular deformity associated with dental malocclusion through osteotomy and repositioning of the maxilla and mandible to achieve an ideal occlusal relationship and facial appearance. A change in the facial appearance relies on the underlying skeletal movement. Comprehensive understanding of the relationship between the bone movement and soft tissue response is crucial for predicting postoperative facial change and useful for treatment planning and patient consultation.
Published studies have investigated the relationship between the soft tissue profile change and the underlying skeletal movement by using two-dimensional (2D) cephalometric analysis [1–7]. A widely used method is to manually measure several selected landmarks on the hard and soft tissues in superimposed preoperative and postoperative images. However, numerous 2D approaches have extensively focused on the linear and angular measurements of certain facial landmarks in the mid-sagittal plane and have neglected the three-dimensional (3D) anisotropic behavior of soft tissues as well as the inherent limitations of the presentation of a complex 3D craniomaxillofacial structure in 2D [8–15].
3D images have been increasingly used in clinical settings to present complex facial structures composed of hard and soft tissues. In particular, cone-beam computed tomography (CBCT) captures both soft and hard tissues, and is becoming commonly used to assess surgical outcomes and to evaluate the 3D facial changes caused by orthognathic surgery according to the underlying bone movement [16–26]. In similar studies, 3D landmarks associated with the nose, upper and lower lips, and mandible have been selected to determine the correlations and proportions of soft-to-hard tissue changes in patients with class III malocclusion undergoing two-jaw orthognathic surgery [27–31]. However, previous methods have converted 2D cephalometric landmarks to a 3D cephalometric system but have not comprehensively addressed the 3D change. Recent advances in virtual surgical planning combined with commercial software opened up new possibilities in predicting facial soft tissue changes following orthognathic surgery based on the mass sprung model, finite element model, and mass tensor mode algorithms. However, the prediction accuracy in critical regions such as the lips, and chin is required to improve [32,33].
Prognathism with class III dental malocclusion is a common facial deformity, requiring orthognathic surgery for correction. The estimation and prediction of the facial outcome is imperative for both clinicians and patients. However, the use of commercial software has its limitations, especially in predicting soft tissue profile changes, since the default relationship (ratio) of soft to hard tissue movements is not realistic. This study aimed to investigate a general trend of relationship (ratio) of the facial soft tissue changes with the underlying skeletal movement in the designated facial regions of interest after two-jaw orthognathic surgery for patients with prognathism through 3D CBCT.
Materials and methods
Ethics statement
This retrospective study was conducted and approved by Chang Gung Craniofacial Center, Taiwan. All experiments were performed with the approval of the Institutional Review Board (IRB) of Chang Gung Memorial Hospital (IRB Nos.: 100-2842B and 103-6475C) and the study methods were carried out in accordance with the approved guidelines of the IRB. Written informed consent documents were obtained from the patients or from the guardians of patients younger than 20 years. The patient depicted in the Figures provided informed consent for the publication of his medical images (S1 File).
Patient collection
This study was based on CBCT images of 24 selected patients (8 females and 16 males) enrolled from the Craniofacial Center, Chang Gung Memorial Hospital. The patient age was 18–35 years, with a mean age of 24.0 ± 4.8 years at the time of surgery. The inclusion criteria comprised the skeletal maturity of the patients prognathism with class III malocclusion, and the status of undergoing two-jaw orthognathic surgery. In this study, facial asymmetry was defined as absolute distance difference between both U6 (the most inferior point of the mesiobuccal cusp of each first upper molar in the profile plane.) perpendicular to the FH plane on each side being equal to or larger than 2 mm. Four patients (case no. 5, 10, 19, 21) were found to have facial asymmetry [34]. The angle ANB is the difference between SNA and SNB representing the relative position of the maxilla to the mandible. The mean and standard deviation of preoperation and postoperation ANB were -4.24 ± 2.15 and 2.57 ± 1.86, respectively. Patients with a cleft lip, cleft palate, or other craniofacial anomalies, major medical diseases, regular administration of medication, a history of facial trauma, degenerative or inflammatory conditions, previous orthognathic surgery, or inadequate imaging were excluded. All patients were treated with maxillary advancement and posterior impaction through LeFort I osteotomy and mandibular setback through BSSO to achieve a normal dentoskeletal relationship. The extent of skeletal movement achieved using the treatment plan was 1–3 mm for the maxillary advancement, 2–5 mm for the maxillary posterior intrusion, and 3–12 mm for the mandibular setback. Genioplasty was performed in 13 patients, with a movement of 1–8 mm for the advancement.
Image acquisition
3D maxillofacial images of patients were acquired using an i-CAT CBCT scanner (Imaging Sciences International, Hatfield, PA, USA). The extended field of view was 22 cm (height) × 16 cm (depth), 120 kV, 5 mA, 50 Hz for a scanning time of 40 seconds and a voxel size of 0.4 × 0.4 × 0.4 mm. The CBCT scans were obtained within 1 month preoperatively and at a minimum of 9 months postoperatively when the brackets had been removed. During image acquisition, the patients were asked to relax their facial musculature, keep their eyes closed, and place the teeth in habitual occlusion. Patient data were stored in the digital imaging and communications in medicine (DICOM) format and subsequently imported to SimPlant Pro (Materialize Dental, Leuven, Belgium). Threshold segmentation was used for 3D model reconstruction of data obtained from DICOM files by identifying and delineating the anatomical structures of interest in the CBCT images. The resulting CBCT models were 3D representations of soft or hard tissues (bones and teeth) of each patient by defining a range of threshold values (Hounsfield units, HU). Threshold values of 300–400 HU and 800–900 HU were selected to identify the hard and soft tissues, respectively. The 3D models were subsequently exported to stereolithography (STL) files for registering preoperative and postoperative images.
Image registration
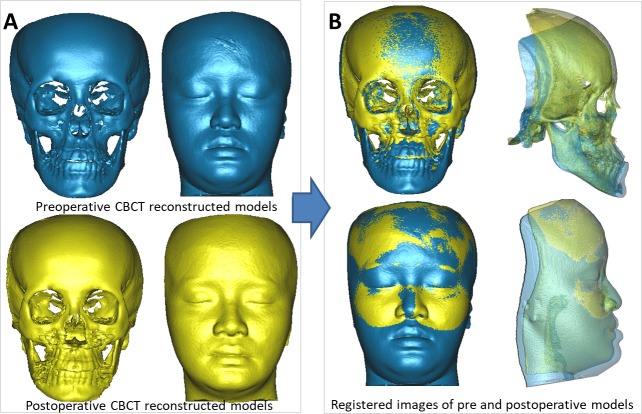
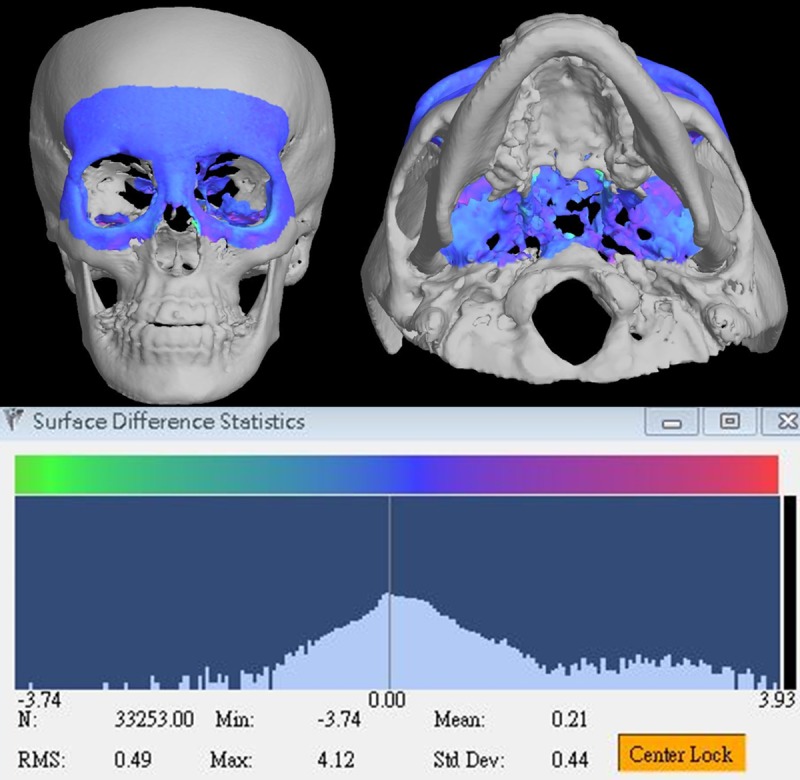
To evaluate the soft tissue changes associated with hard tissue movements, the first step was to determine the volumetric changes in facial images caused by the orthognathic surgery. The preoperative and postoperative CBCT models were superimposed using the surface registration method on the basis of the cranial base, which was stable and unaffected by the surgery (Fig 1, case no. 21) [35]. The accuracy of the cranial base registration was verified by observing the distance color map in terms of the root-mean-square deviation (RMSD) between the registered preoperative and postoperative images (Fig 2, case no. 21). The RMSD errors between the registered surfaces ranged from 0.38 to 0.49 mm (with a mean of 0.41 mm) for the 24 patients. The deviation value was automatically calculated, and any value of 0.5 mm or less was considered acceptable to ensure that the corresponding reference areas had the maximum possible accuracy [36,37]. After the registration, 3D preoperative and postoperative models for soft and hard tissues were subtracted, resulting in volumetric differences for further measurement.
Fig 1. Cranial base registration of preoperative and postoperative CBCT images (case no. 21).
3D preoperative and postoperative models (A). Registration of preoperative and postoperative CBCT models (B).
Fig 2. Accuracy of the cranial base registration in the color map of distance between the registered pre- and postoperative CBCT images (case no. 21).
Defining the facial regions of interest
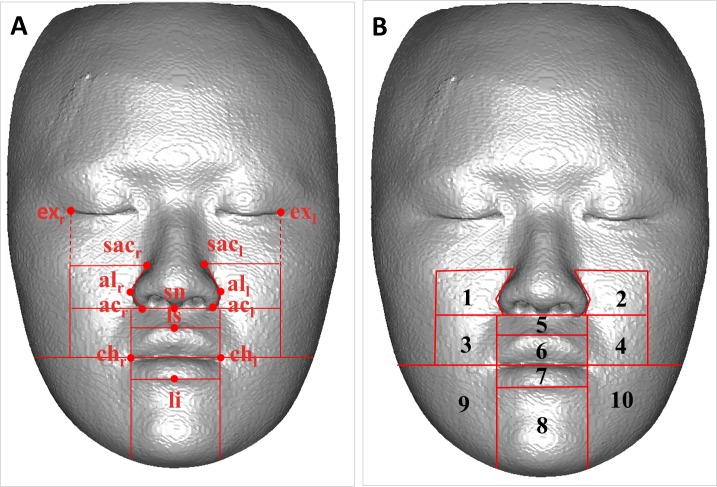
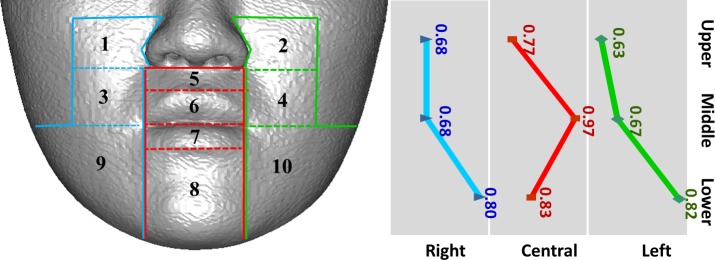
Published studies have reported that soft tissue changes depend on several variables related to the facial structures, and the change are different in various facial regions; therefore, dividing the maxillofacial space into several subunits for practical examination is imperative [38]. First, a hard tissue-based reference system was developed and used for adjusting the head position of the registered images [39]. Subsequently, 10 separated regions of interest were defined and constructed on the basis of specific anatomical landmarks on the preoperative soft tissue surface to investigate the changes in each region. The regions were divided according to the original facial esthetic unit theory stated by Gonzles-Ulloa [40]; however, modifications were conducted in this study. Exocanthion (exl and exr) and cheilion (chl and chr) landmarks were indicated; they formed the borders parallel to the vertical plane of the reference frame. Lateral landmarks were indicated as the superior alar curvature (sacl and sacr), alar curvature (acl and acr), and cheilion and central landmarks were indicated as the subnasale (sn), labiale superior (ls), and labiale inferius (li); they formed borders parallel to the horizontal plane of the reference frame (Fig 3). Lateral areas outside the border of exocanthion and above the cheilion line were not computed because the underlying hard tissue was small and inappropriate for movement measurement. Table 1 lists the definitions of the cephalometric landmarks in the 3D soft tissue model, and Table 2 presents the definitions of the 10 isolated facial regions of interest. The nasal zone had different change patterns after orthognathic surgery and therefore was excluded from this study [41].
Fig 3. Definition of face regions of interest.
The identification of cephalometric landmarks in the 3D soft model and the border of face regions (A). The frontal view of 10 isolated face regions (B).
Table 1. Definition of 3D soft tissue landmarks.
| Landmark | Abbreviation | Definition |
|---|---|---|
| Exocanthion | exl, exr | The leftmost and rightmost points at the outer commissure of the eye fissure |
| Superior alar curvature | sacl, sacr | The leftmost and rightmost points at the upper margin of the curved base line of each alar |
| Alare | all, alr | The most lateral point on each alar contour |
| Alar curvature | acl, acr | The most lateral point in the curved base line of each ala, indicating the facial insertion of the nasal wing base |
| Subnasale | sn | The midpoint on the nasolabial soft tissue contour between the columella crest and the upper lip |
| Labiale superius | ls | The midpoint of the upper vermilion line |
| Labiale inferius | li | The midpoint of the lower vermilion line |
| Cheilion | chl, chr | The leftmost and rightmost points located at each labial commissure |
Table 2. Definition of the 10 isolated face regions of interest.
| Region no. | Region | Definition |
|---|---|---|
| 1 | Right paranasal region | Region of the right cheek adjacent to the ala of the nose |
| 2 | Left paranasal region | Region of the left cheek adjacent to the ala of the nose |
| 3 | Right supracommissural region | Right anterior cheek region adjacent to upper lip, inferior to ala and above oral commissure |
| 4 | Left supracommissural region | Left anterior cheek region adjacent to upper lip, inferior to ala and above oral commissure |
| 5 | Upper lip region | Region below the nose and above the upper vermilion |
| 6 | Upper vermilion region | Vermilion region of the upper lip |
| 7 | Lower vermilion region | Vermilion region of the lower lip |
| 8 | Chin region | Region of chin between both commissures |
| 9 | Right infracommissural region | Right lower facial region below the oral commissure and lateral to the chin |
| 10 | Left infracommissural region | Left lower facial region below the oral commissure and lateral to the chin |
Computing skin and bone movements in the defined facial regions
The volumetric difference was measured on the lower half of the face, which was altered by the orthognathic surgery. After superimposition, the volume of the 3D preoperative image was subtracted from that of the 3D postoperative image, resulting in an overall volumetric difference of the backward movement because of mandibular setback. To obtain the overall volumetric difference of the forward movement because of the maxillary advancement, the volume of the postoperative 3D image was subtracted from that of preoperative 3D image. The overall volumetric difference was divided into the 10 defined regions. The volumetric changes in soft and hard tissues in each region were subsequently exported as STL files for further evaluation (Fig 4).
Fig 4. Volumetric difference of isolated soft and hard tissue regions.
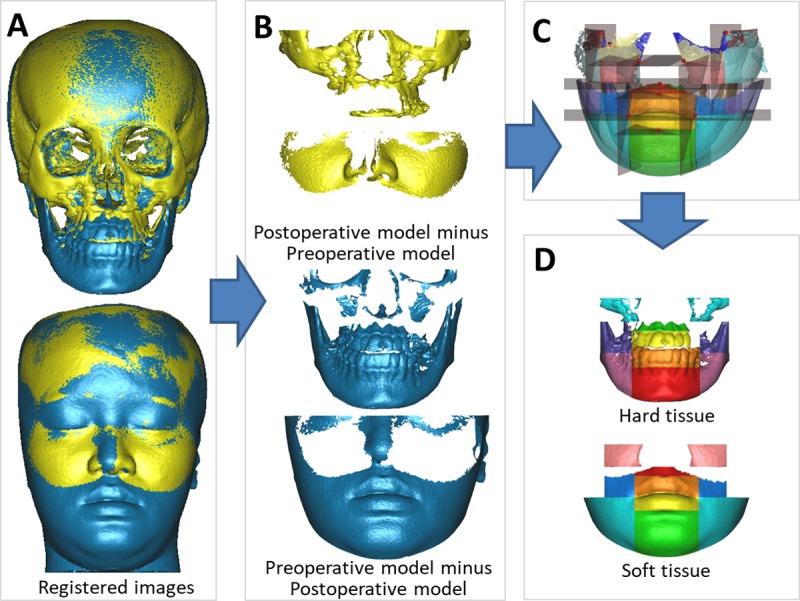
Registered CBCT models (A), the volumetric differences after orthognathic surgery (B), the overall volumetric difference divided into 10 isolated regions based on the constructed planes (C), and 10 isolated regions of soft tissue and hard tissue (D).
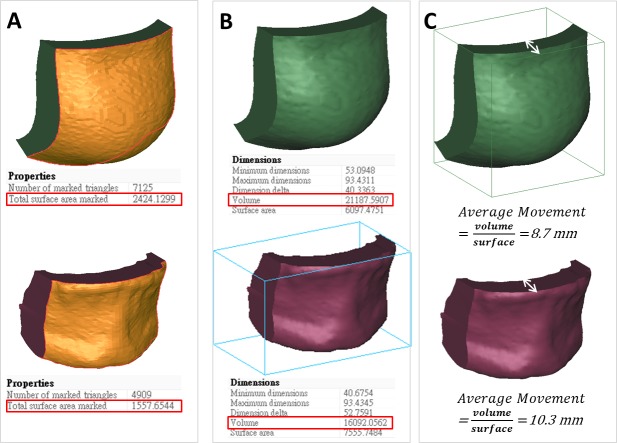
The value of volumetric change (mm3) and surface area (mm2) of preoperative images for each facial region were automatically computed using 3-matic software (Materialize Dental). The average movement (mm) of soft (skin) or hard tissues (the underlying bone) in each facial region was defined as the volume divided by the preoperative surface area. The area defined in the preoperative image surface was used for calculating the movement of the postoperative surface area of each region (Fig 5). The hypothesis of this study was that all point in the same region is in a uniform movement distance.
Fig 5. Volumetric difference and average movement of soft and hard tissue for chin region.
The model of volumetric change (A), volumetric difference (B), and average movement (C).
Statistical analysis
The ratios of the average soft and hard tissue movements were evaluated for the 10 facial regions of all patients. Scatter plots were used to investigate the relationship of the soft tissue changes with the underlying hard tissue movements, and the Pearson correlation coefficient was calculated for each corresponding pair. Regression analysis was used to evaluate the associations between the average soft and hard tissue movements, resulting in a coefficient of determination (denoted by R squared, R2). Statistical significance of the overall fit was determined using the F-test, followed by t tests for individual parameters. Statistical significance was established at 95% confidence intervals (P < .05). Statistical analyses were performed using SPSS (released in 2008, SPSS statistics for Windows, Version 17.0, SPSS Inc, Chicago, USA).
Results
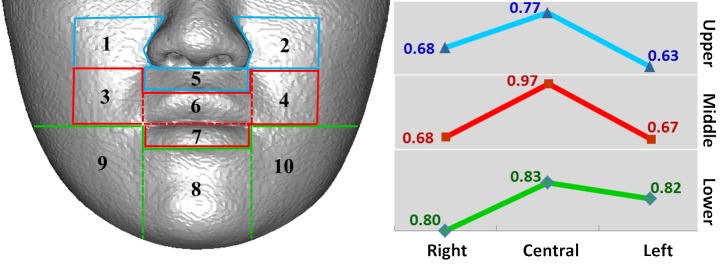
Tissue changes in males and females were not considerably different; therefore, the data were combined for analysis. Table 3 presents the mean and standard deviation of the ratio of the average soft to hard tissue movements in each region. For further demonstration, the 10 regions were classified into three horizontal sections on the basis of the location for LeFort I osteotomy or BSSO: upper, middle, and lower (Fig 6). The regions were also classified into three vertical sections according to the distance from the midsagittal plane: right, central, and left (Fig 7). The results revealed a tendency of the mean ratio in the central region to be larger than that in the lateral regions for all horizontal sections (Fig 6). The mean ratio increased from upper to lower regions, except in the central section (Fig 7).
Table 3. Average volumetric difference, the average surface, and average calculated movement of 24 patients in relevant face region.
Although the paranasal and upper lip region are forward, other areas are mostly backward.
| Region no. | Region | Volumetric difference (mm3) |
Preoperative region surface (mm2) | Average movement (mm) |
Average movement ratio | |||
|---|---|---|---|---|---|---|---|---|
| Hard tissue | Soft tissue | Hard tissue | Soft tissue | Hard tissue(H) | Soft tissue(S) | S/H ratio(%) | ||
| 1 | Right paranasal | 485±146 | 476±324 | 355±84 | 506±209 | 1.4±0.4 | 0.9±0.4 | 0.68±0.36 |
| 2 | Left paranasal | 464±160 | 399±280 | 363±102 | 463±189 | 1.3±0.3 | 0.8±0.3 | 0.63±0.33 |
| 3 | Right supracommissural | -1899±850 | -954±688 | 833±349 | 535±181 | -2.5±1.5 | -1.6±0.8 | 0.68±0.20 |
| 4 | Left supracommissural | -1918±1031 | -1039±720 | 796±398 | 594±155 | -2.6±1.5 | -1.6±0.9 | 0.67±0.34 |
| 5 | Upper lip | 119±613 | -65±520 | 460±130 | 350±180 | 0.3±1.2 | 0.0 ±1.2 | 0.77±0.35 |
| 6 | Upper vermilion | -681±835 | -799±748 | 539±189 | 563±176 | -1.2±1.3 | -1.3±1.2 | 0.99±0.48 |
| 7 | Lower vermilion | -3533±1293 | -3732±1314 | 622±180 | 697±169 | -5.7±1.6 | -5.4±1.6 | 0.95±0.19 |
| 8 | Chin | -12597±4263 | -14503±5572 | 1586±291 | 2211±506 | -8.0±2.4 | -6.5±2.1 | 0.83±0.11 |
| 9 | Right infracommissural | -6580±3706 | -10994±4145 | 1677±417 | 3357±679 | -4.2±1.2 | -3.2±0.9 | 0.80±0.23 |
| 10 | Left infracommissural | -7464±3463 | -12416±5485 | 1682±451 | 3406±742 | -4.3±1.2 | -3.6±1.0 | 0.82±0.19 |
Positive values of the surface distance indicate displacement in the forward direction and negative values indicate displacement in the backward direction.
S/H ratio is the ratio of soft tissue movement to hard tissue movement
Fig 6. Horizontal trend of average movement ratio of 10 regions.
Fig 7. Vertical trend of average movement ratio of 10 regions.
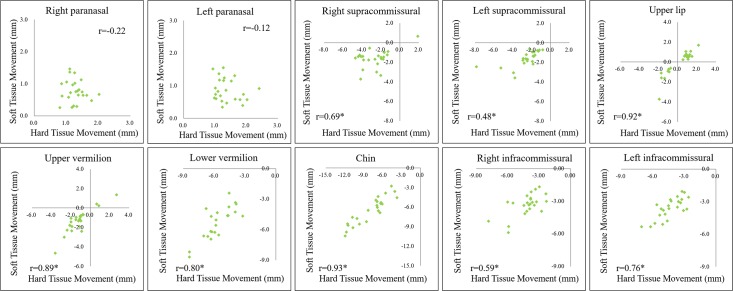
The scatter plots of the 10 regions showed linear relationships between the soft and hard tissue movements; each the correlation coefficient is denoted by r (Fig 8). The results revealed extremely strong correlations among upper lip, upper vermilion, lower vermilion, and chin regions (r ≥ 0.8); strong correlations between right supracommissural and left infracommissural regions (0.6 < r < 0.8); moderate correlations between left supracommissural and right infracommissural regions (0.3 ≤ r ≤ 0.6); and weak or no correlation between right and left paranasal regions.
Fig 8. Scatter plots of the soft tissue average movements with respect to underlying hard tissue average movements for 10 regions; r denotes the correlation coefficient for each plot.
Table 4 displays the results of linear regression analysis. The results showed that high R2 values in the upper lip, upper vermilion, and chin regions, ranging from 0.786 to 0.857, were associated with statistical significance. The results revealed that the regression models could be used to predict the soft tissue movement from the corresponding hard tissue movements. For other regions, R2 values were lower, ranging from 0.229 to 0.641, indicating that the regression models had weak prediction capabilities in these regions. These regression models could not be used to accurately predict the soft tissue movements from the corresponding hard tissue movements.
Table 4. Linear regression model of the soft tissue average movements and underlying hard tissue average movements for the regions.
| Region no. | Region | Regression model | Coefficient of determination (R2) |
Significance level (P) |
|---|---|---|---|---|
| 1 | Right paranasal | y = -0.206x+1.152 | 0.048 | 0.306 |
| 2 | Left paranasal | y = -0.150x+0.963 | 0.015 | 0.568 |
| 3 | Right supracommissural | y = 0.359x – 0.697 | 0.476 | 0.000 |
| 4 | Left supracommissural | y = 0.304x – 0.837 | 0.229 | 0.018 |
| 5 | Upper lip | y = 0.901x – 0.279 | 0.848* | 0.000 |
| 6 | Upper vermilion | y = 0.843x – 0.331 | 0.786* | 0.000 |
| 7 | Lower vermilion | y = 0.824x | 0.641 | 0.000 |
| 8 | Chin | y = 0.788x | 0.857* | 0.000 |
| 9 | Right infracommissural | y = 0.441x –1.440 | 0.353 | 0.002 |
| 10 | Left infracommissural | y = 0.646x | 0.581 | 0.000 |
x denotes the soft tissue average movement.
y denotes the hard tissue average movement.
R2<0.5 is meaningful, R2 = 0.7 may be interpreted as follows: 70% of the variance in the response variable can be explained by the explanatory variables. The remaining thirty percent can be attributed to unknown factor.
*: P ≤ 0.05 statistically significant, and if P > 0.05, that hypothesis must be rejected and the alternative hypothesis must be accepted as true.
To calculate the effective sample size, a power analysis for linear regression was conducted using G*Power 3.1.6 (Heinrich-Heine-Universität Düsseldorf, Düsseldorf, Germany). The analysis indicated that at least 23 samples would be required for an α of 0.05 and a power of 0.7, showing that our study sample size was adequate.
Discussion
Patients are sensitive to any changes in facial esthetics after orthognathic surgery. Therefore, highly reliable prediction of the soft-tissue results of surgery plays a principal role in improving treatment planning and patient–doctor communication. Soft tissue changes occur because of the underlying skeletal movements. The evaluation and prediction of soft tissue responses following orthognathic surgery have been widely studied. However, 2D cephalometric analysis has inherent limitations regarding the presentation of complex 3D changes in hard and soft tissues [8–14]. Recently, soft tissue responses to underlying skeletal changes have been evaluated using 3D imaging technology, such as 3D landmarks, color mapping, and volumetric difference [15, 17–20]. However, these results did not completely represent the 3D relationship between the corresponding soft-to-hard tissue changes in various face subunits [42–46]. 3D CBCT imaging is suitable for evaluating the facial soft tissue changes caused by orthognathic surgery according to the underlying bone movements because CBCT simultaneously displays both soft and bone tissues. In this study, a source of bias is whether orthodontic appliances affect the appearance of the soft tissues, particularly the position of the lips. Based on some previous quantitative studies, the changes in the perioral soft tissues after appliance removal are not clinically significant, but individual variations do exist. Thus, the effect of orthodontic brackets removal on lip positions was not considered relevant in this study [47–48].
Mean ratio of the average soft to hard tissue movement
An overall trend was observed. Soft tissue changes followed hard tissue movements. The results revealed that the average movements of soft tissues were smaller than those of hard tissues, and ratios varied for different regions (Table 3). Our mean ratios may not exactly be similar to previously reported values because of the population biocharacteristics and study methods, but the trend is in agreement.
The mean ratios of the average movements of soft-to-hard tissues revealed that the values in central regions were higher than those in lateral regions for all horizontal sections (Fig 6), which was in accordance with previous 3D studies [26–31, 38, 42–44]. This observation explains why the soft tissues in the central regions are thinner and the adherence to the underlying bone is firm and less flexible. Therefore, the soft tissues in the central regions follow the underlying hard tissue movements more closely than do the soft tissues in the lateral regions, which are relatively loose and thick. Through laser imaging, Soncul et al. evaluated soft tissue changes and reported that the amount of soft tissue changes relative to hard tissue movements gradually decreased toward the lateral aspect after surgical correction of class III deformity [38]. Furthermore, Kim et al. used 121 representative points and revealed a similar pattern in patients with mandibular setback, stating that the farther the setback was located, the smaller was the movement ratio of the soft tissue [26].
Considering all vertical sections, the mean ratios of the average soft-to-hard tissue movements increased from upper to lower regions (Fig 7). This finding was similar to the finding of 2D cephalometric studies conducted using the midline landmarks; however, our ratios were unlike those of the 2D studies because our study used 3D region-based measurements [7, 9, 49].
Relationship between ratios of the average soft to hard tissue movements
The scatter plots showed extremely strong relationships among the upper lip (r = 0.92), upper vermilion (r = 0.89), lower vermilion (r = 0.80), and chin (r = 0.93) regions. The results of regression analysis supported significant linear relationships of the average soft-to-hard tissue movements corresponding to the upper lip (R2 = 0.848), upper vermilion (R2 = 0.786), and chin (R2 = 0.857) regions. This finding provides evidence for using linear regression equations for predicting the average soft-to-hard tissue movements in these regions. Except for the lower vermilion region, results of all regions were in concordance with previous 2D cephalometric landmark studies [11, 50, 51], which reported linear relationships between soft-to-hard tissue changes in the maxillary incisor tip–labrale superius, mandibular incisor tip–labrale inferius, ponit B–mentolabial sulcus, and hard pogonion–soft pogonion over a wide range of skeletal changes [11]. Koh et al. indicated that when using a computer-assisted simulation system for orthognathic surgery, prediction errors are likely to be caused by the underestimation of the vertical position and overestimation of the horizontal position of the lower lip for bimaxillary surgery in patients with class III malocclusion50. Barakat et al. reported larger prediction differences in the lower lip and postulated that the reasons for the discrepancy were lip tonicity, length, posture, and mass [51].
As shown in Table 4, the linear relationships were significant among the right supracommissural (R2 = 0.476, P = .000), left supracommissural (R2 = 0.229, P = .018), lower vermilion (R2 = 0.641, P = .000), right infracommissural (R2 = 0.353, P = .002), and left infracommissural (R2 = 0.581, P = .000) regions. In these regions, the prediction capability was not consistent for estimating the overlying soft tissue changes. In right and left paranasal regions, the soft tissue moved with the bone tissue; however, the linear relationship was not significant for prediction. Altogether, these results might have been caused by the sample size and population biocharacteristics. Additional studies are required to analyze more patients and develop novel imagingmethods.
One limitation derived from the retrospective study design, patients CBCT scans were acquired at a minimum of 9 months postoperatively in order to avoid the surgical swelling. The predicted result should not be the same as the actual postoperative outcome due to the variance between surgical changes and the individual changes caused by skeletal relapse and postoperative orthodontics. Instead of estimating soft tissue responses by measuring individual landmark changes, our study aimed to find a general trend of relationship (ratio) between soft and hard tissue movements for various facial regions and provide a detailed information that can help to guide surgical planning. Nevertheless, this tolerance could be ignored. Additionally, the ratios can be effectively applied to commercial software as the parameters for orthognathic surgery simulation in predicting 3D soft tissue profile changes (S1 Fig). Using commercial software tools, the prediction of postoperative soft tissue movement values were converted to a vector diagram as shown in S2 Fig, and the magnitude, direction, and location of the postoperative soft-tissue movement in a color-scale plot was automatically displayed. As can be seen in S1 Fig, we can find the movement of the lateral area (1,2,3,4,9,10) has stronger curvature than center area (5, 6, 7, 8).
Predicting soft-to-hard tissue changes is difficult, however, our study provides comprehensive evidence from the linear regression model for predicting such movements, and the prediction is consisted to the upper lip, upper vermilion, and chin regions. The results focused on the skin profile changes in above-mentioned critical regions, which could be reliably predicted from the underlying bone movements. However, the experience of providing a more realistic soft tissue prediction for all regions will be collected for our future study, and the method still requires improvement for in the further.
Supporting information
(PDF)
(TIF)
(TIF)
Acknowledgments
We thank Drs. Yu-Ray Chen and Chiung-Shing Huang for sharing their cases, Miss Ya-Fang Chuang for working on the imaging data during the study period, and Pei-Ju Lin and Yu-Jr Lin for statistical consultation supported.
Data Availability
Data are available from the Ethics Committee of the Chang Gung Memorial Hospital for researchers who meet the criteria for access to confidential data. Requests for the data may be sent to the Chang Gung Medical Foundation Institutional Review Board, Taoyuan City, Taiwan (e-mail: irb1@cgmh.org.tw).
Funding Statement
This research was supported by Chang Gung Memorial Hospital under Grant CRRPG5C0271-3 and CRRPG5C0281-3 and by Ministry of Science and Technology grants MOST 106-2314-B-182-060 and MOST 106-2314-B-182A-154. The funders had no role in study design, data collection and analysis, decision to publish, or preparation of the manuscript.
References
- 1.Ayoub AF, Mostafa YA, el-Mofty S. Soft tissue response to anterior maxillary osteotomy. Int J Adult Orthodon Orthognath Surg. 1991;6: 183–190. [PubMed] [Google Scholar]
- 2.Dewan SK, Marjadi UK. Soft tissue changes in surgically treated cases of bimaxillary protrusion. J Oral Maxillofac Surg. 1983;41, 116–118. [DOI] [PubMed] [Google Scholar]
- 3.Kim JR, Son W S, Lee SG. A retrospective analysis of 20 surgically corrected bimaxillary protrusion patients. Int J Adult Orthodon Orthognath Surg. 2002;17: 23–27. [PubMed] [Google Scholar]
- 4.Lee RT, Kyi CS, Mack GJ. A controlled clinical trial of the effects of the Twin Block and Dynamax appliances on the hard and soft tissues. Eur J Orthod. 2007;29: 272–282. 10.1093/ejo/cjm004 [DOI] [PubMed] [Google Scholar]
- 5.Okudaira M, Kawamoto T, Ono T, Moriyama K. Soft-tissue changes in association with anterior maxillary osteotomy: a pilot study. Oral Maxillofac Surg. 2008;12: 131–138. 10.1007/s10006-008-0121-9 [DOI] [PubMed] [Google Scholar]
- 6.Park JU, & Hwang YS. Evaluation of the soft and hard tissue changes after anterior segmental osteotomy on the maxilla and mandible. J Oral Maxillofac Surg. 2008;66: 98–103. 10.1016/j.joms.2005.09.007 [DOI] [PubMed] [Google Scholar]
- 7.Joss CU, Joss-Vassalli IM, Kiliaridis S, Kuijpers-Jagtman A. Soft tissue profile changes after bilateral sagittal split osteotomy for mandibular advancement: a systematic review. J Oral Maxillofac Surg. 2010;68: 1260–1269. 10.1016/j.joms.2010.01.005 [DOI] [PubMed] [Google Scholar]
- 8.Bergman RT, Cephalometric soft tissue facial analysis. Am J Orthod Dentofac Orthop. 1999;116: 373–389. [DOI] [PubMed] [Google Scholar]
- 9.Louis PJ, Austin RB, Waite P D, Mathews CS. Soft tissue changes of the upper lip associated with maxillary advancement in obstructive sleep apnea patients. J Oral Maxillofac Surg. 2001;59: 151–156. 10.1053/joms.2001.20485 [DOI] [PubMed] [Google Scholar]
- 10.Altug-Atac AT, Bolatoglu H, Memikoglu UT. Facial soft tissue profile following bimaxillary orthognathic surgery. Angle Orthod 2008;78: 50–57. 10.2319/122206-525.1 [DOI] [PubMed] [Google Scholar]
- 11.Chew MT, Sandham A, Wong H B. Evaluation of the linearity of soft- to hard-tissue movement after orthognathic surgery. Am J Orthod Dentofacial Orthod. 2008;134: 665–670. [DOI] [PubMed] [Google Scholar]
- 12.Papadopoulos MA, Lazaridou-Terzoudi T, Øland J, Athanasiou AE, Melsen B. Comparison of soft and hard tissue profiles of orthognathic surgery patients treated recently and 20 years earlier. Oral Surg Oral Med Oral Pathol Oral Radiol Endod. 2009;108: e8–e13. 10.1016/j.tripleo.2009.03.025 [DOI] [PubMed] [Google Scholar]
- 13.Aydil B, Özer. N, Marşan G. Bimaxillary surgery in Class III malocclusion: soft and hard tissue changes. J Craniomaxillofac Surg. 2013;41: 254–257. 10.1016/j.jcms.2012.10.004 [DOI] [PubMed] [Google Scholar]
- 14.Becker OE, Avelar RL, Dolzan Ado N, Haas OL Jr, Scolari N, Oliveira RB. Soft and hard tissue changes in skeletal Class III patients treated with double-jaw orthognathic surgery-maxillary advancement and mandibular setback. Int J Oral Maxillofac Surg. 2014;43: 204–212. 10.1016/j.ijom.2013.06.006 [DOI] [PubMed] [Google Scholar]
- 15.Storms AS, Miclotte A, Grosjean L, Cadenas de Llano-Pérula M, Alqerban A, Fieuws S, et al. Short-term hard and soft tissue changes after mandibular advancement surgery in Class II patients: a retrospective cephalometric study. Eur J Orthod. 2017. February 14 10.1093/ejo/cjx003 [DOI] [PubMed] [Google Scholar]
- 16.Oh KM, Seo SK, Park JE, Sim HS, Cevidanes LH, Kim YJ, et al. Post-operative soft tissue changes in patients with mandibular prognathism after bimaxillary surgery. J Craniomaxillofac Surg. 2013;41: 204–211. 10.1016/j.jcms.2012.09.001 [DOI] [PubMed] [Google Scholar]
- 17.Shafi M, Ayoub A, Ju X, Khambay B. The accuracy of 3D prediction planning for the surgical correction of facial deformities using Maxilim. Int J Oral Maxillofac Surg. 2013;42: 801–816. 10.1016/j.ijom.2013.01.015 [DOI] [PubMed] [Google Scholar]
- 18.Kim BR, Oh KM, Cevidanes LH, Park JE, Sim HS, Seo SK, et al. Analysis of 3D soft tissue changes after 1- and 2-jaw orthognathic surgery in mandibular prognathism patients. J Oral Maxillofac Surg. 2013;71: 151–161. 10.1016/j.joms.2012.02.005 [DOI] [PubMed] [Google Scholar]
- 19.de Paula LK, Ruellas AC, Paniagua B, Styner M, Turvey T, Zhu H, et al. One-year assessment of surgical outcomes in Class III patients using cone beam computed tomography. Int J Oral Maxillofac Surg. 2013;42: 780–789. 10.1016/j.ijom.2013.01.002 [DOI] [PMC free article] [PubMed] [Google Scholar]
- 20.Gerbino G, Bianchi FA, Verzé L, Ramieri G. Soft tissue changes after maxillo-mandibular advancement in OSAS patients: a three-dimensional study. J Craniomaxillofac Surg. 2014;42: 66–72. 10.1016/j.jcms.2013.02.004 [DOI] [PubMed] [Google Scholar]
- 21.Choi JW, Lee JY, Oh TS, Kwon SM, Yang SJ, Koh KS. Frontal soft tissue analysis using a 3 dimensional camera following two-jaw rotational orthognathic surgery in skeletal class III patients. J Craniomaxillofac Surg. 2014;42: 220–226. 10.1016/j.jcms.2013.05.004 [DOI] [PubMed] [Google Scholar]
- 22.San Miguel Moragas J, Oth O, Büttner M, Mommaerts MY. A systematic review on soft-to-hard tissue ratios in orthognathic surgery part II: Chin procedures. J Craniomaxillofac Surg. 2015;43: 1530–1540. 10.1016/j.jcms.2015.07.032 [DOI] [PubMed] [Google Scholar]
- 23.Suzuki-Okamura E, Higashihori N, Kawamoto T, Moriyama K. Three-dimensional analysis of hard and soft tissue changes in patients with facial asymmetry undergoing 2-jaw surgery. Oral Surg Oral Med Oral Pathol Oral Radiol. 2015;120: 299–306. 10.1016/j.oooo.2015.05.020 [DOI] [PubMed] [Google Scholar]
- 24.Van Hemelen G. et al. Three-dimensional virtual planning in orthognathic surgery enhances the accuracy of soft tissue prediction. J Craniomaxillofac Surg. 2015;43: 918–925. 10.1016/j.jcms.2015.04.006 [DOI] [PubMed] [Google Scholar]
- 25.Jeon EG, Lee ST, Kwon TG. Perioral soft tissue change after isolated mandibular surgery for asymmetry patients. J Craniomaxillofac Surg. 2017;45: 962–968. 10.1016/j.jcms.2017.01.039 [DOI] [PubMed] [Google Scholar]
- 26.Kim NK, Lee C, Kang SH, Park JW, Kim MJ, Chang YI. A three-dimensional analysis of soft and hard tissue changes after a mandibular setback surgery. Comput Methods Programs Biomed. 2006;83: 178–817. 10.1016/j.cmpb.2006.06.009 [DOI] [PubMed] [Google Scholar]
- 27.Jung YJ, Kim MJ, Baek S. H. Hard and soft tissue changes after correction of mandibular prognathism and facial asymmetry by mandibular setback surgery: three-dimensional analysis using computerized tomography. Oral Surg Oral Med Oral Pathol Oral Radiol Endo. 2009;107: 763–771. [DOI] [PubMed] [Google Scholar]
- 28.Lee TY, Kim KH, Yu HS, Kim KD, Jung YS, Baik HS. Correlation analysis of three-dimensional changes of hard and soft tissues in class III orthognathic surgery patients using cone beam computed tomography. J Craniofac Surg. 2014;25: 1530–1540. 10.1097/SCS.0000000000000620 [DOI] [PubMed] [Google Scholar]
- 29.Kim YK, Moon SW, Yun PY, Lee YS, Larson BE, Lee NK. Evaluation of soft tissue changes around the lips after mandibular setback surgery with minimal orthodontics using three-dimensional stereophotogrammetry. J Oral Maxillofac Surg. 2016;74: 1044–1054. 10.1016/j.joms.2015.11.023 [DOI] [PubMed] [Google Scholar]
- 30.Chang YJ, Ruellas ACO, Yatabe MS, Westgate PM, Cevidanes LHS, Huja SS. Soft Tissue Changes Measured With Three-Dimensional Software Provides New Insights for Surgical Predictions. J Oral Maxillofac Surg. 2017;1–11. 10.1016/j.joms.2016.10.016 [DOI] [PMC free article] [PubMed] [Google Scholar]
- 31.Jeon EG, Lee ST, Kwon TG. Perioral soft tissue change after isolated mandibular surgery for asymmetry patients. J Oral Maxillofac Surg. 2017. May 24 pii: S0278-2391(17)30539–6. 10.1016/j.joms.2017.05.010 [DOI] [PubMed] [Google Scholar]
- 32.Kim D, Ho DC, Mai H, Zhang X, Shen SGF, Shen S, et al. A clinically validated prediction method for facial soft-tissue changes following double-jaw surgery. Med Phys. 2017;44: 4252–4261. 10.1002/mp.12391 [DOI] [PMC free article] [PubMed] [Google Scholar]
- 33.Mundluru T, Almukhtar A, Ju X, Ayoub A. The accuracy of three-dimensional prediction of soft tissue changes following the surgical correction of facial asymmetry: An innovative concept. Int J Oral Maxillofac Surg. 2017. May 22 pii: S0901-5027(17)31439–X. 10.1016/j.ijom.2017.04.017 [DOI] [PubMed] [Google Scholar]
- 34.Lonic D, Sundoro A, Lin HH, Lin PJ, Lo LJ, Selection of a horizontal reference plane in 3D evaluation: Identifying facial asymmetry and occlusal cant in orthognathic surgery planning. Sci Rep. 2017. May 19;7(1):2157 10.1038/s41598-017-02250-w [DOI] [PMC free article] [PubMed] [Google Scholar]
- 35.Cevidanes LH, Motta A, Proffit WR, Ackerman JL, Styner M. Cranial base superimposition for 3-dimensional evaluation of soft-tissue changes. Am J Orthod Dentofacial Orthop. 2010;137: S120–S129. 10.1016/j.ajodo.2009.04.021 [DOI] [PMC free article] [PubMed] [Google Scholar]
- 36.Van Heerbeek N, Ingels KJ, van Loon B, Plooij JM, Bergé SJ. Three dimensional measurement of rhinoplasty results. Rhinology. 2009;47: 121–125. [PubMed] [Google Scholar]
- 37.Bared A, Rashan A, Caughlin BP, Toriumi DM. Lower lateral cartilage repositioning: objective analysis using 3-dimensional imaging. JAMA Facial Plast Surg. 2014;16: 261–267. 10.1001/jamafacial.2013.2552 [DOI] [PubMed] [Google Scholar]
- 38.Soncul M, Bamber MA. Evaluation of facial soft tissue changes with optical surface scan after surgical correction of Class III deformities. J Oral Maxillofac Surg. 2004;62: 1331–1340. [DOI] [PubMed] [Google Scholar]
- 39.Lin HH, Chuang YF, Weng JL, Lo LJ. Comparative validity and reproducibility study of various landmark-oriented reference planes in 3-dimensional computed tomographic analysis for patients receiving orthognathic surgery. PLOS ONE 2015;10: 1–16. [DOI] [PMC free article] [PubMed] [Google Scholar]
- 40.Gonzales-Ulloa M. Restoration of the face covering by means of selected skin in regional aesthetic units. Br J Plast. 1956;9: 212–221. [DOI] [PubMed] [Google Scholar]
- 41.Worasakwutiphong S, Chuang YF, Chang HW, Lin HH, Lin PJ, Lo LJ. Nasal changes after orthognathic surgery for patients with class III malocclusion and prognathism: Analysis using three-dimensional photography. J Formos Med Assoc. 2015;114: 112−123. 10.1016/j.jfma.2014.10.003 [DOI] [PubMed] [Google Scholar]
- 42.Almeida RC, Cevidanes LH, Carvalho FA, Motta AT, Almeida MA, Styner M, et al. Soft tissue response to mandibular advancement using 3D CBCT scanning. Int J Oral Maxillofac Surg. 2011;40: 353–359. 10.1016/j.ijom.2010.11.018 [DOI] [PMC free article] [PubMed] [Google Scholar]
- 43.Solem RC, Marasco R, Guiterrez-Pulido L, Nielsen I, Kim SH, Nelson G, et al. Three-dimensional soft-tissue and hard-tissue changes in the treatment of bimaxillary protrusion. Am J Orthod Dentofacial Orth. 2013;144: 218–228. [DOI] [PubMed] [Google Scholar]
- 44.Maal TJ, de Koning MJ, Plooij JM, Verhamme LM, Rangel FA, Bergé SJ, et al. One year postoperative hard and soft tissue volumetric changes after a BSSO mandibular advancement. Int J Oral Maxillofac Surg. 2012;41: 1137–1145. 10.1016/j.ijom.2012.04.004 [DOI] [PubMed] [Google Scholar]
- 45.Almukhtar A, Ayoub A, Khambay B, McDonald J, Ju X. State-of-the-art three-dimensional analysis of soft tissue changes following Le Fort I maxillary advancement. 2016;54: 812–817. [DOI] [PubMed] [Google Scholar]
- 46.Elnagar MH, Elshourbagy E, Ghobashy S, Khedr M, Kusnoto B, Evans CA. Three-dimensional assessment of soft tissue changes associated with bone-anchored maxillary protraction protocols. Am J Orthod Dentofacial Orthop. 2017;152: 336–347. 10.1016/j.ajodo.2017.01.022 [DOI] [PubMed] [Google Scholar]
- 47.Eidson L, Cevidanes LHS, De Paula LK, Hershey HG, Welch G, Rossouw PE. Three-dimensional evaluation of changes in lip position from before to after orthodontic appliance removal. Am J Orthod Dentofacial Orthop. 2012; 142: 410–418. 10.1016/j.ajodo.2012.01.018 [DOI] [PMC free article] [PubMed] [Google Scholar]
- 48.Kim YK, Lee NK, Moon SW, Jang MJ, Kim HS, Yun PY. Evaluation of soft tissue changes around the lips after bracket debonding using three-dimensional stereophotogrammetry. Angle Orthod. 2015;85: 833–840. 10.2319/090414.622.1 [DOI] [PMC free article] [PubMed] [Google Scholar]
- 49.Chew MT. Soft and hard tissue changes after bimaxillary surgery in Chinese Class III patients. Angle Orthod. 2005;75: 959–963. 10.1043/0003-3219(2005)75[959:SAHTCA]2.0.CO;2 [DOI] [PubMed] [Google Scholar]
- 50.Koh CH, Chew MT. Predictability of soft tissue profile changes following bimaxillary surgery in skeletal class III Chinese patients. J Oral Maxillofac Surg. 2004;62: 1505–1509. [DOI] [PubMed] [Google Scholar]
- 51.Barakat AA, Refai WM, Mekhemar S T. Accuracy of profile prediction using computer software in orthognathic surgery. Egypt J Oral Maxillofac Surg. 2010;1: 7–11. [Google Scholar]
Associated Data
This section collects any data citations, data availability statements, or supplementary materials included in this article.
Supplementary Materials
(PDF)
(TIF)
(TIF)
Data Availability Statement
Data are available from the Ethics Committee of the Chang Gung Memorial Hospital for researchers who meet the criteria for access to confidential data. Requests for the data may be sent to the Chang Gung Medical Foundation Institutional Review Board, Taoyuan City, Taiwan (e-mail: irb1@cgmh.org.tw).


