Abstract
Background: Oncogenic infection by HPV, eventually leads to cervical carcinogenesis, associated by deregulation of specific pathways and protein expression at the intracellular and secretome level. Thus, secretome analysis can elucidate the biological mechanisms contributing to cervical cancer. In the present study we systematically analyzed its constitution in four cervical cell lines employing a highly sensitive proteomic technology coupled with bioinformatics analysis. Materials and Methods: LC/MS-MS proteomics and bioinformatics analysis were performed in the secretome of four informative cervical cell lines SiHa (HPV16+), HeLa (HPV18+), C33A (HPV−) and HCK1T (normal). Results: The proteomic pattern of each cancer cell line compared to HCK1T was identified and a detailed bioinformatics analysis disclosed inhibition of matrix metalloproteases in cancer cell lines. This prediction was further confirmed via zymography for MMP-2 and MMP-9, western blot analysis for ADAM10 and by ΜRM for TIMP1. The differential expression of important secreted proteins such as CATD, FUCA1 and SΟD2 was also confirmed by western blot analysis. MRM-targeted proteomics analysis confirmed the differential expression of CATD, CATB, SOD2, QPCT and NEU1. Conclusion: High resolution proteomics analysis of cervical cancer secretome revealed significantly deregulated biological processes and proteins implicated in cervical carcinogenesis.
Keywords: Cervical cancer, secretome, proteomics, LC/MS-MS, MRM, matrix metalloproteases
The vast majority of cervical cancer incidents are related to a group of 13 high-risk oncogenic human papilloma virus (HPV) types, classified according to sequence similarity, based on established criteria by the International Committee on the Taxonomy of Viruses (1). Types HPV16 and HPV18 represent the most common high-risk types causing cervical cancer (2,3). Microabrasions on the cervical epithelium surface, allow the entry of HPV and the ensuing infection of the basal membrane epithelium. The initial overexpression of E6 and E7 HPV oncoproteins in the upper layers of the epithelium, leads to the production of viral particles and the establishment of productive infection, associated with the formation of low-grade squamous intraepithelial lesions (LSIL). Subsequent integration of the virus in the host cells, results in progression to high-grade squamous intraepithelial lesions (HSIL), leading eventually to cervical cancer (4-7).
Proteomics technologies offer an holistic approach through the identification of many critical proteins, that could facilitate the understanding of biological mechanisms underlying cervical cancer pathogenesis. Proteomic tools have been utilized to study the mechanisms of action of drugs and the discovery of putative biomarkers for cervical cancer (8). However, in the above approaches, only the two-dimensional gel electrophoresis (2DE) coupled to MALDI-TOF has been utilized in most studies so far, whereas the LC–MS/MS technology, a very sensitive technology, has not been widely used. Furthermore, in these few studies where LC-MS/MS was applied, only the intracellular proteome was analyzed, whereas secreted and membrane proteins containing equally valuable information, have not been studied yet.
Therefore, the aim of the present study was to characterize the secretome pattern of cervical cancer cells –reflecting the acquisition of the hallmarks of cancer, with a potential contribution to the delineation of the distinctive stages of cancer progression (9). Furthermore, the secretome can be a source of putative biomarkers that can be easily detected in biological fluids, such as serum of cancer patients (10,11). We have recently compared the secretome of three representative cervical cancer cell lines (12), such as the C33A (HPV negative), SiHa (HPV16+), and HeLa (HPV18+) cell lines, to a normal cervical keratinocyte cell line, HCK1T (13), by employing two-dimensional gel electrophoresis coupled to MALDI-TOF mass spectrometry. This initial analysis revealed aberration of several canonical pathways involving metabolic processes and the activation of NRF2-mediated oxidative stress response in cervical cancer cells (12).
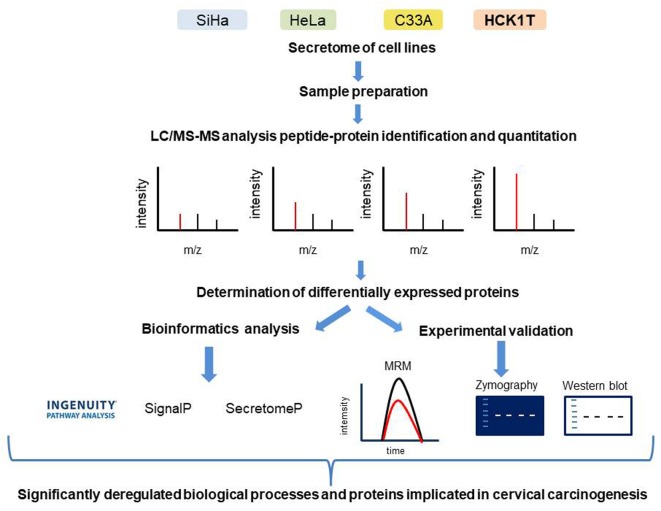
In the present study, we further investigated in detail the secretome of the above representative and informative cell lines, by employing the highly sensitive proteomic technology of liquid chromatography coupled to an Orbitrap mass analyzer (LC-MS/MS). In addition, a systematic bioinformatics analysis revealed significant pathways involved in cervical cancer pathogenesis, such as the inhibition of matrix metalloproteases. Finally, the multiple putative targets identified, were further validated by independent methods such as zymography, western blot analysis and the targeted proteomic method of multiple reaction monitoring (MRM). An overview of all the experimental procedures performed, are summarized in Figure 1.
Figure 1. Graphical representation of the experimental procedures that were performed. A highly sensitive proteomic technology of liquid chromatography coupled to an Orbitrap mass analyzer (LC-MS/MS) was applied in the secretome analysis of cell lines. Furthermore, a systematic bioinformatics analysis of the differentially expressed proteins, identified in the proteomics analysis, revealed significant pathways involved in cervical cancer pathogenesis, such as the inhibition of matrix metalloproteases. Finally, the multiple putative targets identified, were further validated by independent methods such as zymography, western blot analysis and the targeted proteomic method of multiple reaction monitoring (MRM).
Materials and Methods
Cell culture and sample preparation for proteomics analysis. SiHa, HeLa and C33A cells (ATCC, Manassas, VA, USA) were cultured in DMEM, supplemented with 10% FBS, 1% P/S, supplied by Gibco-Invitrogen (Waltham, MA, USA) at 37˚C and 5% CO2, as previously described (14). ΗCK1T cells were a kind gift of Dr. Tohru Kiyono (13), and were cultured as proposed (13), in Defined Keratinocyte Serum-Free Medium (Gibco BRL, San Francisco, CA, USA), supplemented with 5 ng/ml Epidermal Growth Factor (Gibco BRL) and 50 μg/ml of Bovine Pituitary Extract (Gibco BRL). The collection of secretome as well as the total cell extract was performed as previously described by our group (12,15).
GeLC-MS analysis. Secretome samples were solubilized in the isoelectric focusing (IEF) sample buffer (7 M urea, 2 M thiourea, 4% CHAPS, 1% DTE) and 3.6% Protease inhibitors. The protein concentration was determined by Bradford Assay. Samples were analyzed with the GeLC-MS method as described by Lawlor et al. (16) with minor modifications. Briefly, samples were run in 12% SDS PAGE, and stained with Coomassie Colloidal Blue overnight. Bands were excised from the gels and cut in small pieces (1-2 mm). Gel pieces were destained in 40% acetonitrile, 50 mM NH4HCO3, reduced in 10 mM DTE, 100 mM NH4HCO3, and alkylated in 50 mM IAA, 100 mM NH4HCO3. Samples were dried using the Savant Speedvac™ concentrator (ThermoFisher Scientific, Waltham, MA, USA) and trypsinized overnight with 600 ng trypsin, using a trypsin stock solution of 10 ng/μl in 10 mM NH4HCO3. Peptide extraction was performed with sequential washes of the trypsinized gel pieces with 50 mM NH4HCO3, followed by two washes with 50% acetonitrile, 5% formic acid for 15 min at room temperature under shaking conditions. Extracted peptides were dried using the Savant Speedvac™ concentrator (ThermoFisher Scientific) and analyzed by LC-MS/MS analysis.
LC-MS/MS (Liquid Chromatography coupled to tandem Mass Spectrometry) analysis. All LC-MS/MS experiments were performed on the Dionex Ultimate 3000 UHPLC system coupled with the high resolution nano-ESI Orbitrap-Elite mass spectrometer (Thermo Finnigan, Bremen, Germany), as previously described (17). Briefly, 5 μl corresponding to 5 μg of the peptide mixture were analyzed on a Dionex Ultimate 3000 RSLS nanoflow system (Dionex™, Camberly, UK). After loading on a Dionex 0.1×20 mm, 5 μm C18 nanotrap column at a flow rate of 5 μl/min in 98% mobile phase A (0.1% formic acid) and 2% mobile phase B (100% acetonitrile, 0.1% formic acid), the sample was eluted into an Acclaim PepMap C18 nanocolumn 75 μm × 50 cm (Dionex™, Sunnyvale, CA, USA), 2 μm 100 Å, at a flow rate of 0.3 μl/min. The trap and the nanoflow column were maintained at 35˚C. The samples were eluted with a gradient of solvent A:solvent B starting at 2%B for 10 min, rising to 5%B at 11 min, 15%B at 73 min and 55%B at 95 min. The column was then washed and re-equilibrated prior to injection of the next sample. The eluant was ionized using a Proxeon nanospray ESI source, operating in positive ion mode into an Orbitrap Elite FTMS (Thermo Finnigan, Bremen, Germany). Ionization voltage was at 2.2 kV and the capillary temperature was at 250˚C. The mass-spectrometer was operated in MS/MS mode scanning from 300 to 2200 amu. The resolution of ions in MS1 was 60,000 and 15,000 for HCD MS2. The top 10 multiply-charged ions were selected from each scan for MS/MS analysis using HCD at 33% collision energy. Data analysis was performed with Proteome Discoverer 1.4 software package (Thermo Finnigan), using the Sequest search engine and the Uniprot human reviewed database, updated on May 30, 2016, including 20,204 entries. The search was performed using carbamidomethylation of cysteine as static and oxidation of methionine as dynamic modifications. Two missed cleavage sites, a precursor mass tolerance of 10 ppm and fragment mass tolerance of 0.05 Da were allowed. False discovery rate (FDR) validation was based on q value: target FDR (strict): 0.01, target FDR (relaxed): 0.05. SEQUEST results were filtered for false-positive identifications.
Quantification and statistical analysis. Quantification analysis was performed at the peptide level as previously described (17). Only proteins being present in 75% of the samples in at least one group were further processed for quantification and statistical analysis (Mann-Whitney). As differentially expressed proteins selected for further analysis, were considered those with a fold change of >2 or <0.5, and a p-value of <0.05.
Classification of secreted proteins. SignalP 4.1 (18) and SecretomeP 2.0 (19) were used for the prediction of classical and non-classical secretion of identified proteins. SignalP predicts the presence and location of signal peptide cleavage sites in amino acid sequences. The SecretomeP server provides predictions for non-classical, i.e. non-signal peptide triggered protein secretion.
Ingenuity® Pathway Analysis (IPA). The identified differentially expressed proteins were subjected to IPA® analysis (IPA®, QIAGEN, Redwood City, CA, USA; www.qiagen.com/ingenuity). A manually annotated database of protein interactions and metabolic reactions obtained from the scientific literature is included in IPA®. Entry names of differentially expressed proteins were converted to gene names after their entry in the Retrieve/ID mapping of the Uniprot database (http://www.uniprot.org/). The processed gene names were listed in MS Excel and imported into IPA to map the canonical pathways and generate biological networks. Data were submitted as fold change values, i.e. ratios, calculated against the control group (HCK1T). Hypothetical networks were built among the experimental proteins and the IPA® database proteins. Following the core analysis, statistically significant (p≤0.05, Fisher’s Exact Test) canonical pathways were selected.
Zymography assays. Zymography was performed using 8% polyacrylamide gels, containing 0.2% (w/v) gelatin. Three μg of secretome protein was loaded. The gels were incubated with the equilibration buffer (25 mM Tris HCl, pH 7.8, 2.5% (v/v) Triton-X 100) for about 1.5 h at 4˚C for renaturation of MMPs, since SDS was exchanged with Triton-X100. Gels were incubated with the activation buffer (25 mM Tris HCl pH 7.8, 5 mM CaCl2) for 24h at 37˚C. Gels were washed and fixed with a solution of 40% ethanol, 10% acetic acid for 1 h, and then stained overnight with Coomassie Colloidal Blue. Finally, the gels were destained with water and scanned with a Bio-Rad GS800 densitometer in transmission mode (Bio-Rad, Hercules, CA, USA). The areas of digestion appeared as clear bands against a darkly-stained background where gelatin was degraded by the MMPs. Images were analyzed using the Quantity One software (Bio-Rad). Four biological replicates were used for each cell line.
Western blot analysis. A protein amount of 10 μg of secretome from SiHa, HeLa, C33A and HCK1T cell lines or 20 μg of total cell extract from the same cell lines were analyzed. The following four primary antibodies were used. A rabbit anti-human FUCA1 polyclonal (Proteintech Group, Inc., Chicago, IL, USA) in a dilution 1:250, Cat. No. ab13534, antigen Ag9612. A rabbit anti-human SOD2 polyclonal (Abcam, Cambridge, MA, USA) in a dilution 1:1000, Cat. No. ab13534, antigen full length protein (Rat). A mouse anti-human ADAM10 monoclonal (Santa Cruz Biotechnology, Inc., Dallas, TX, USA) in a dilution 1:500, Cat. No. sc-28358, antigen of amino acids 1-300 of ADAM10 of human origin. A goat anti-human cathepsin D polyclonal, (R&D Systems, Inc., Minneapolis, MN, USA) in a dilution 1:200, Cat. No. AF1014, antigen mouse myeloma cell line NS0-derived recombinant human cathepsin D. Furthermore, the following HRP-conjugated secondary antibodies were used. A donkey anti-rabbit (GE Healthcare Bio-Sciences, Pittsburgh, PA, USA) in a dilution 1:5,000, Cat. No. NA9340, antigen Rabbit IgG) or goat anti-mouse (Santa Cruz Biotechnology), in a dilution 1:2,000, Cat. No. sc-2005, antigen mouse IgG or rabbit anti-goat (Sigma-Aldrich Corp., St. Louis, MO, USA) in a dilution 1:10,000, Cat. No. A5420, antigen goat IgG. For the analysis in the total cell extract, a mouse anti-human tubulin monoclonal (Sigma-Aldrich Corp.) in a dilution 1:6,000, Cat. No. T6199, antigen chick brain tubulin was used as a loading control for the normalization of samples. In the case of secretome samples, equal loading was confirmed by Ponceau S staining of the nitrocellulose membranes. In all cases, membranes were blocked with 5% non-fat dried milk in TBS-0.1% Tween solution and incubated with the primary antibody overnight at 4˚C. Subsequently, membranes were washed with TBS-0.1% Tween and incubated with the secondary antibody for 2h at room temperature. A final wash with TBS-0.1% Tween was performed and target protein was detected by the Enhanced Chemiluminescence (ECL) detection system. Films were scanned and images were analyzed using Quantity One software (Bio-Rad). Different secretome samples to the ones used for the LC-MS/MS analysis were employed. Four biological replicates were analyzed for each cell line. The p-values were calculated using Student’s t-test.
Multiple reaction monitoring (MRM) LC-MS/MS. Peptides corresponding to 40 μg of secretome protein were used for multiple reaction monitoring (MRM) LC-MS/MS analysis as previously described by us (12). Different secretome samples to the ones used for the western blot analysis were employed for the validation of six proteins (TIMP1, CATD, CATB, SOD2, QPCT and NEU1). At least three biological replicates were analyzed for each cell line. The MRM LC-MS/MS assay design and method development has been described in details previously (12). In brief, 2-5 transitions were recorded for each peptide. Optimum collision energies for each transition were automatically calculated by the Skyline software (20). Peptide selection for MRM LC-MS/MS has been previously described (12). One proteotypic peptide with 2-5 transitions was selected to be tested for each target, originating from a list of unique proteotypic peptides found in PeptideAtlas (www.peptideatlas.org). Only the optimum MRM transition for each protein was selected for quantification after comparing the peak shape, intensity and specificity of the top 2-5 most intense MRM ion transitions for each protein (21). MRM specificity was ensured with the use of a heavy peptide standard. Data analysis was performed using Skyline software and all chromatograms were manually inspected to ensure the quality and accurate peak picking. Finally, the ratio of Light/Heavy (Light: endogenous, Heavy: synthetic) peptides was used for quantification.
Results
Analysis of protein differential expression in the SiHa, HeLa, C33A and HCK1T secretomes. Comparison of the expression levels of the proteins in the secretome of the four cell lines was conducted using a total of four samples per category, corresponding to different biological replicates. Each cancer cell line was compared to the normal cell line HCK1T. Differentially expressed and statistical significant proteins (fold change >2 or &0.05, p&/italic>0.05, Mann-Whitney) were identified by this analysis. Two-hundred thirty-three differentially expressed proteins were detected in the SiHa vs. HCK1T comparison, whereas 231 were identified only in SiHa and 55 only in HCK1T. Furthermore, one-hundred twenty differentially expressed proteins were detected in the HeLa vs. HCK1T comparison, whereas 49 were identified only in HeLa and 180 only in HCK1T. Finally, two-hundred four differentially expressed proteins were detected in the C33A vs. HCK1T comparison, whereas 134 were identified only in C33A and 161 only in HCK1T. Comparisons between the differentially expressed proteins among the four cell lines, are presented by a Venn diagram (Figure 2). There were 121 common identifications that correspond to 23.3% of proteins in the SiHa vs. HCK1T comparison, 34.7% of proteins in the HeLa vs. HCK1T comparison and 24.2% of proteins in the C33A vs. HCK1T comparison. Also, there were unique differentially expressed proteins identified in all comparisons (243 in SiHa vs. HCK1T, 78 in HeLa vs. HCK1T and 221 in C33A vs. HCK1T) corresponding to 46.8% in SiHa vs. HCK1T, 22.3% in HeLa vs. HCK1T and 44.3% in C33A vs. HCK1T, respectively.
Figure 2. Venn diagram depicting common and unique differentially expressed proteins between the different comparisons of each cancer cell line vs. the normal HCK1T cell line. Proteins with fold change >2 or <0.05 and a statistically significant p-value of <0.05, as well as qualitative differences, were included. One hundred twenty one proteins were common among all comparisons corresponding to 23.3% of proteins in the SiHa vs. HCK1T comparison, 34.7% of proteins in the HeLa vs. HCK1T comparison and 24.2% of proteins in the C33A vs. HCK1T comparison. The number of unique identifications detected for each comparison (243 in SiHa vs. HCK1T, 78 in HeLa vs. HCK1T and 221 in C33A vs. HCK1T) provided further validation to the proteomics analysis.
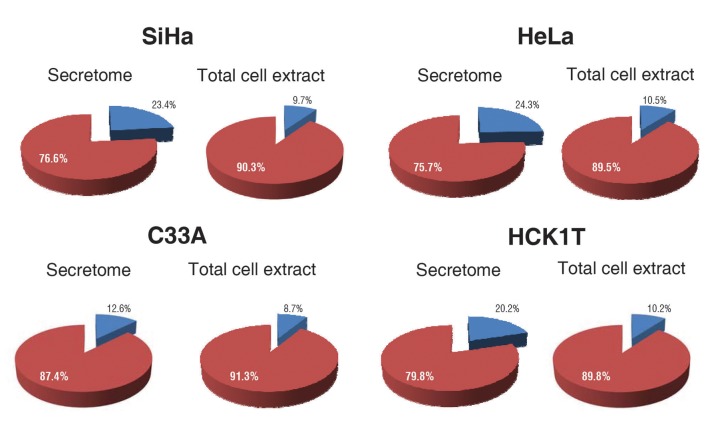
To confirm putative differences to the total cell extract, a parallel analysis of the respective cell extracts was performed (Lygirou et al., in preparation). All identifications from four biological replicates for each cell line were subjected to bioinformatics analysis via the SignalP software (18) in order to assess the enrichment of the extracellular proteins both in the secretome and in the total cell extract fractions. This analysis disclosed that in SiHa cell line, 23.4% of the proteins originating from the secretome analysis were predicted to be classically secreted, in comparison to 9.7% in the total cell extract analysis. In HeLa cell line, 24.3% of the proteins originating from the secretome analysis were predicted to be classically secreted, in comparison to 10.5% in the total cell extract analysis. In C33A cell line, 12.6% of the proteins originating from the secretome analysis were predicted to be classically secreted, in comparison to 8.7% in the total cell extract analysis. Finally, in the HCK1T cell line, 20.2% of the proteins originating from the secretome analysis were predicted to be classically secreted, compared to 10.2% in the total cell extract analysis. The enrichment factor, i.e. the percentage of extracellular proteins in the secretome, divided by the percentage of extracellular proteins in the total cell extract, was 2.4 for SiHa, 2.3 for HeLa, 1.4 for C33A and 1.9 for the normal HCK1T cell line (Figure 3).
Figure 3. Secreted protein analysis for all identifications in each cell line via SignalP. Extracellular proteins were detected (blue colour) in the secretome fraction and the total cell extract fraction by SignalP. The red colour corresponds to the intracellular proteins in the two fractions (secretome and total cell extract). The percentage of extracellular proteins in the secretome was divided by the percentage of extracellular proteins in the total cell extract for each cell line, and the enrichment factor was calculated. The enrichment factor was 2.4 for SiHa, 2.3 for HeLa, 1.4 for C33A and 1.9 for HCK1T.
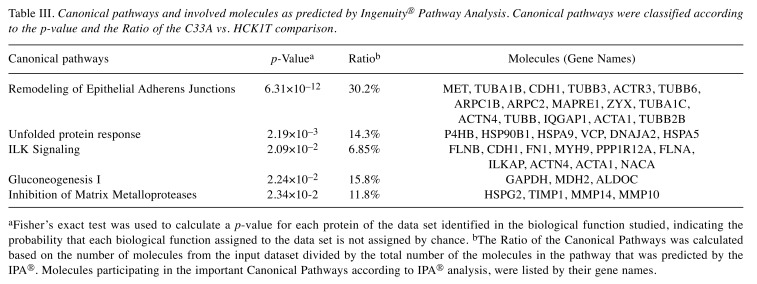
Ingenuity® Pathway Analysis (IPA). To further characterize the biological functions and pathways relevant for the regulation of the differentially expressed proteins, we employed the Ingenuity® Pathway Analysis (IPA®) software. We compared each cancer cell line with the control (HCK1T). The most interesting predicted pathways by IPA®, as well as the molecules involved in them are presented in Table I for SiHa vs. HCK1T, in Table II for HeLa vs. HCK1T and in Table III for C33A vs. HCK1T. Among the predicted pathways is the inhibition of matrix metalloproteases in SiHa vs. HCK1T (p=1.10×10⁻⁴), in HeLa vs. HCK1T (p=1.15×10⁻³) and in C33A vs. HCK1T (p=2.34×10⁻²) comparisons, a biologically relevant process that takes place in the extracellular matrix (Figure 4A). Also, a common pathway that was predicted in all comparisons was the remodeling of epithelial adherens junctions in SiHa vs. HCK1T (p=1.32×10⁻⁹), in HeLa vs. HCK1T (p=3.47×10⁻⁸) and in C33A vs. HCK1T (p=6.31×10⁻¹²) comparisons, as shown in Tables I, II and III, respectively).
Table I. Canonical pathways and involved molecules as predicted by Ingenuity® Pathway Analysis. Canonical pathways were classified according to the p-value and the Ratio of the SiHa vs. HCK1T comparison.
aFisher’s exact test was used to calculate a p-value for each protein of the data set identified in the biological function studied, indicating the probability that each biological function assigned to the data set is not assigned by chance. bThe Ratio of the Canonical Pathways was calculated based on the number of molecules from the input dataset divided by the total number of the molecules in the pathway that was predicted by the IPA®. Molecules participating in the important Canonical Pathways according to IPA® analysis, were listed by their gene names.
Table II. Canonical pathways and involved molecules as predicted by Ingenuity® Pathway Analysis. Canonical pathways were classified according to the p-value and the Ratio of the HeLa vs. HCK1T comparison.
aFisher’s exact test was used to calculate a p-value for each protein of the data set identified in the biological function studied, indicating the probability that each biological function assigned to the data set is not assigned by chance. bThe Ratio of the Canonical Pathways was calculated based on the number of molecules from the input dataset divided by the total number of the molecules in the pathway that was predicted by the IPA®. Molecules participating in the important Canonical Pathways according to IPA® analysis, were listed by their gene names.
Table III. Canonical pathways and involved molecules as predicted by Ingenuity® Pathway Analysis. Canonical pathways were classified according to the p-value and the Ratio of the C33A vs. HCK1T comparison.
aFisher’s exact test was used to calculate a p-value for each protein of the data set identified in the biological function studied, indicating the probability that each biological function assigned to the data set is not assigned by chance. bThe Ratio of the Canonical Pathways was calculated based on the number of molecules from the input dataset divided by the total number of the molecules in the pathway that was predicted by the IPA®. Molecules participating in the important Canonical Pathways according to IPA® analysis, were listed by their gene names.
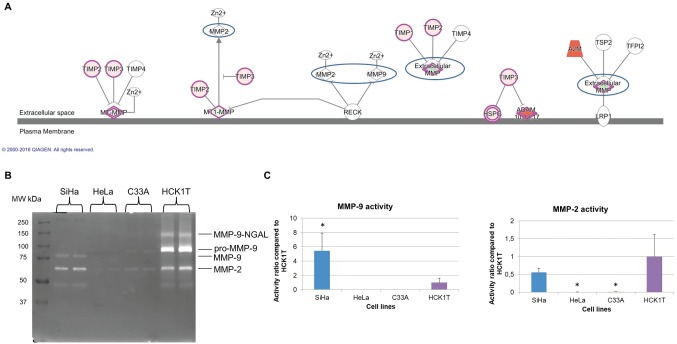
Figure 4. Deregulation of the matrix metalloproteases. A. The pathway of inhibition of matrix metalloproteases was predicted by IPA® in cancer cell lines vs. HCK1T. The inhibitors of MMP-2 and MMP-9, TIMP1 and TIMP2, were up-regulated in the cervical cancer cells vs. HCK1T. B. A collagen zymography assay for the validation of the deregulated pathway, since MMP-2 and MMP-9 were not detected in the secretome. MMP9 catalytic activity was reduced in cancer cell lines in comparison to HCK1T. The active form of MMP-9 was increased in SiHa (5.45 activity ratio, p<0.05) in comparison to HCK1T, whereas the active form of MMP-9 was not present in HeLa and C33A cell lines. MMP-2 activity was reduced in SiHa, in HeLa and in C33A compared to HCK1T, confirming the bioinformatics analysis. A representative zymography of two biological replicates for each cell line is presented. C. Graphical representation of zymography results for MMP-9 and MMP-2 (fold change vs. HCK1T; mean±SD, *p<0.05, Student’s t-test), is presented for each cell line.
Zymography. Among the top pathways predicted to be regulated in cancer cells, was the inhibition of matrix metalloproteases pathway. The inhibitors of MMP-2 and MMP-9 (TIMP1 and TIMP2) were up-regulated in cancer cells vs. HCK1T. However, MMP-2 and MMP-9 were not identified in the secretome (Figure 4A). We decided to perform a zymography assay in order to assess their collagenase activity and validate the Bioinformatics prediction. The MMP-9-NGAL complex was identified at 130 kDa, the pro-MMP-9 at 92 kDa, whereas the active form of MMP-9 at 82 kDa. In Figure 4B and C, it is apparent that the active form of MMP-9 was increased in SiHa (5.45 activity ratio, p</italic>0.05), compared to HCK1T, whereas it was absent in both HeLa and C33A cell lines. Furthermore, the activity of MMP-2 (66 kDa) was reduced in SiHa (0.56 activity ratio, p>0.05), in HeLa (0.01 activity ratio, p</italic>0.05) and in C33A cell lines (0.01 activity ratio, p</italic>0.05), compared to HCK1T. These results confirm the bioinformatics prediction for MMP-2 in all cell lines, as well as for MMP-9 in HeLa and C33A cell lines, since the up-regulation of MMP-2 and MMP-9 inhibitors (TIMP1 and TIMP2) results either to reduced or no catalytic activity of MMP-2 and MMP-9, respectively in the secretome of cancer cell lines.
Validation of putative biomarkers by western blot analysis. Among the proteins that were found to be differentially expressed in the secretome of cancer cell lines vs. HCK1T, we chose to validate tissue α-L-fucosidase (FUCA1), superoxide dismutase [Mn], mitochondrial (SOD2), disintegrin and metalloproteinase domain-containing protein 10 (ADAM10), and cathepsin D (CTSD). FUCA1, ADAM 10, and cathepsin D are classically secreted proteins according to SignalP (18) whereas SOD2 is a non-classically secreted protein according to SecretomeP (19).
First we wished to test the validity of our proteomic findings, by choosing to validate a classically secreted protein such as FUCA1, and a non-classically secreted protein, such as SOD2.
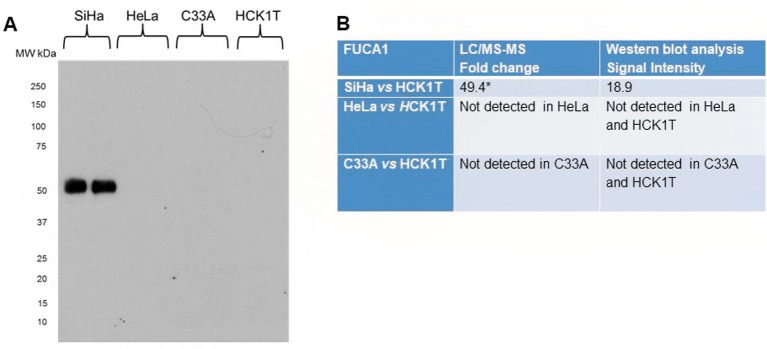
FUCA1 was particularly chosen for validation as it plays an active role in human carcinogenesis (22-25). Specifically proteomics analysis showed significant up-regulation in SiHa (49.4-fold change, p</italic>0.05), when compared to HCK1T. The proteomics result was verified by western blot analysis as a specific band of ~54 kDa corresponding to FUCA1, that was present only in SiHa cell line (Figure 5). Equal loading of secretome samples was confirmed by Ponceau S staining.
Figure 5. Validation of proteomics results by western blot analysis of the secretome for FUCA1. A. Western blot for FUCA1 confirming FUCA1 expression only in SiHa cells. B. Table depicting the LC/MS-MS results confirmed by western blot analysis. The results of LC/MS-MS are presented as fold change compared to HCK1T (mean±SD; *p<0.05, Mann Whitney). Representative images of two biological replicates are shown for each cell line. Equal loading of the secretome was confirmed by Coomassie Colloidal Blue-stained gels, or by Ponceau S- stained membranes.
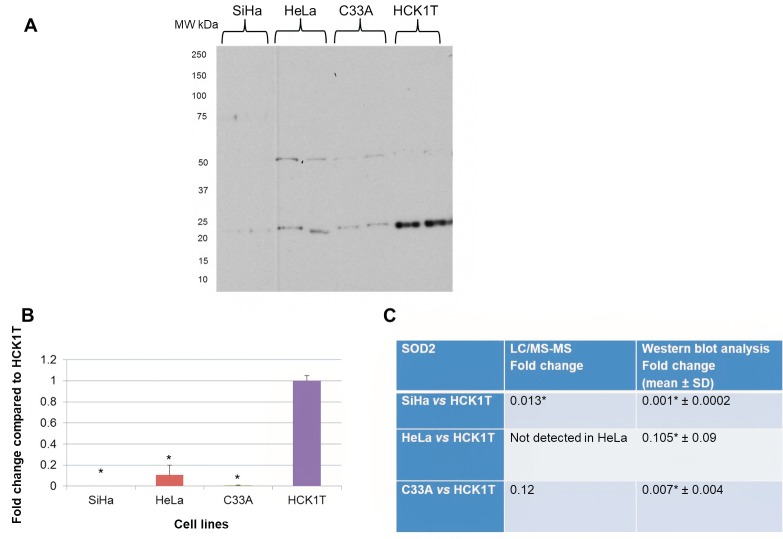
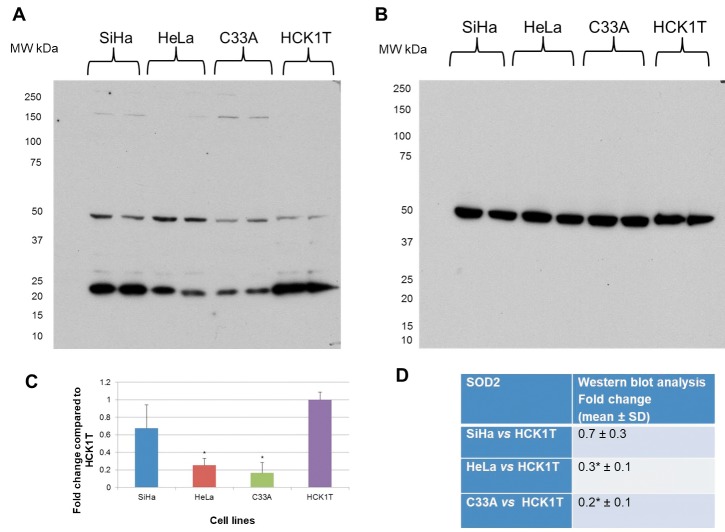
SOD2 was chosen for validation as it has been previously linked to cervical carcinogenesis (26). Also, it has been documented as secreted by human hepatocytes (27). In the secretome proteomic analysis, SOD2 was down-regulated in SiHa vs. HCK1T (0.013-fold change, p</italic>0.05) as well as in C33A vs. HCK1T (0.12-fold change, p>0.05), while it was not identified in HeLa cells. The proteomics result was verified by western blot analysis as a specific band of 22 kDa corresponding to SOD2, thus confirming the proteomics analysis (Figure 6). We also performed a western blot analysis for SOD2 in the total cell extract, since it is a non-classically secreted protein, as a direct comparison of the expression trend between the secretome and the total cell extract fractions (Figure 7). SOD2 was down-regulated in cancer cell lines when compared to HCK1T (0.7-fold change, p>0.05 in SiHa vs. HCK1T, 0.3-fold change, p</italic>0.05 in HeLa vs. HCK1T and 0.2-fold change, p</italic>0.05 in C33A vs. HCK1T). The results for the total cell extract western blot analysis (Figure 7) are in agreement with those of the secretome western blot analysis (Figure 6). Equal loading of total cell extract samples was assessed by a tubulin western blot analysis (Figure 7B).
Figure 6. Western blot analysis of the secretome for SOD2. A. A specific band of 22 kDa was detected. B. Graphical representation of western blot analysis for each cell line (mean±SD; *p<0.05, Student’s t-test). C. LC/MS-MS results confirmed by western blot analysis. The results of LC/MS-MS are presented by fold change compared to HCK1T (mean±SD; *p<0.05, Mann Whitney) as well as the western blot analysis data (mean±SD; *p<0.05, Student’s t-test). Representative images of two biological replicates are shown for each cell line. Equal loading of the secretome was confirmed by Coomassie Colloidal Blue-stained gels, or by Ponceau S- stained membranes.
Figure 7. Western blot analysis in total cell extract for SOD2. A. A specific band of 22 kDa was detected. B. Equal loading confirmation performed by tubulin expression. C. Graphical representation for western blot analysis for each cell line, as fold change compared to HCK1T (mean±SD; *p<0.05, Student’s t-test). D. Western blot analysis data for the detected 22 kDa band, as fold change compared to HCK1T (mean±SD; *p<0.05, Student’s t-test).
ADAM10 was chosen for validation as it is involved in the inhibition of matrix metalloproteases pathway. The LC-MS/MS analysis identified it in the secretome of SiHa and HeLa, whereas it was absent in C33A and HCK1T. The western blot analysis results were in agreement, since a specific band of ~80 kDa corresponding to ADAM 10 was identified, which was present only in SiHa and HeLa cell lines (Figure 8).
Figure 8. Validation of proteomics results for ADAM10, by western blot analysis of the secretome. A. Western blot for ADAM10 confirming its presence only in SiHa and HeLa. B. Table of LC/MS-MS results confirmed by western blot analysis. Representative images of two biological replicates are shown for each cell line. Equal loading of the secretome was confirmed by Coomassie Colloidal Blue-stained gels, or by Ponceau Sstained membranes.
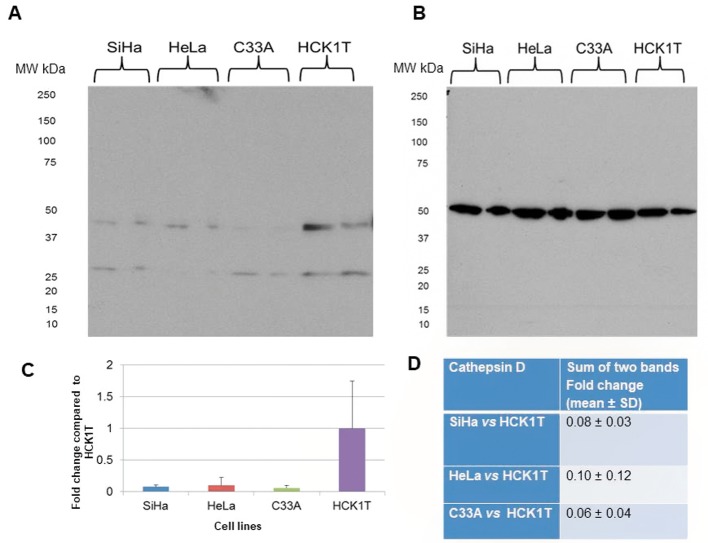
Cathepsin D was chosen for validation as it performs an active role in extracellular matrix remodeling (28). Proteomic analysis showed up-regulation in SiHa (2.9-fold change, p</italic>0.05), down-regulation in C33A (0.4-fold change, p</italic>0.05), and a pattern of down-regulation in HeLa (0.5-fold change, p>0.05) when each cell line was compared to HCK1T. The proteomics result was verified by western blot analysis in C33A (0.3-fold change, p</italic>0.05), when compared to HCK1T, and in HeLa vs. HCK1T (0.3-fold change, p</italic>0.05), whereas there was a 0.6-fold change, p</italic>0.05 in SiHa vs. HCK1T (Figure 9). A western blot analysis for cathepsin D in total cell extract was also conducted, as cathepsin D can also be found in lysosomes (Figure 10). Direct comparison of the expression trend between the secretome and the total cell extract fractions, revealed that cathepsin D was down-regulated in all cancer cell lines when compared to HCK1T (fold change 0.08, p>0.05 in SiHa vs. HCK1T; 0.10, p>0.05 in HeLa vs. HCK1T and 0.06, p>0.05 in C33A vs. HCK1T). The results for the total cell extract by western blot analysis were in agreement with those of the secretome, as far as the HeLa vs. HCK1T and C33A vs. HCK1T comparisons are concerned. In the total cell extract, two bands were detected, a heavy one of 46 kDa and a light one of 28 kDa, whereas in the secretome a single band was detected (Figure 9), probably corresponding to the secreted form of pro-cathepsin D, which is approximately 50 kDa (28).
Figure 9. Validation of proteomics results for cathepsin D by western blot analysis of the secretome. A. Western blot for cathepsin D. B. Graphical representation for western blot analysis for each cell line (mean±SD, *p<0.05, Student’s t-test). C. Confirmation of the LC/MSMS data by Western blot analysis. The LC/MS-MS data are presented by fold change compared to HCK1T (mean±SD; *p<0.05, Mann Whitney), as well as the western blot analysis results (fold change compared to HCK1T; mean±SD, *p<0.05, Student’s t-test). Representative images of two biological replicates are shown for each cell line. Equal loading of secretome was confirmed by Coomassie Colloidal Blue-stained gels, or by Ponceau S-stained membranes.
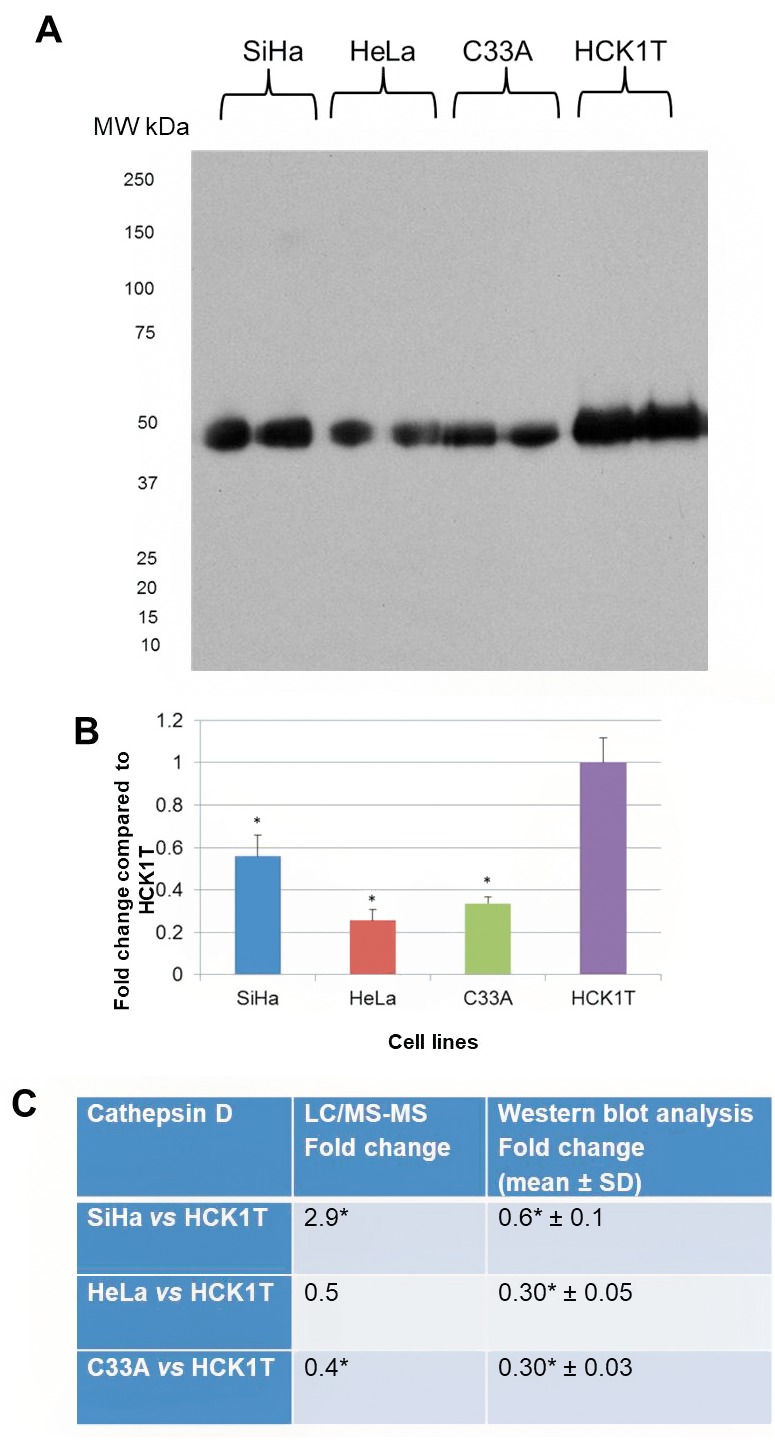
Figure 10. Western blot analysis for cathepsin D in the total cell extract. A. Western blot of cathepsin D. Two isoforms of cathepsin D (heavy and light) were detected. B. Equal loading was confirmed by tubulin expression. C. Graphical representation for western blot analysis is presented for each cell line (mean±SD, *p<0.05, Student’s t-test). D. Assessment of the two bands detected, as fold change compared to HCK1T (mean±SD, *p<0.05, Student’s t-test). Cathepsin D is down-regulated in all cancer cell lines when compared to HCK1T.
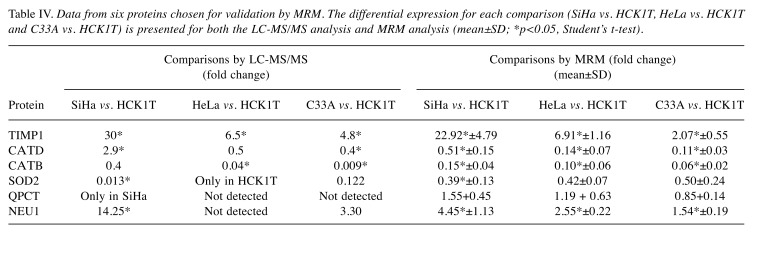
Validation of putative biomarkers by MRM. In order to further increase the validity of our proteomic findings from the secretome analysis, we decided to validate six proteins by MRM assays. First, we focused on the validation of bioinformatics analysis where the pathway inhibition of matrix metalloproteases is predicted to be activated (Figure 4). In the above pathway, metalloproteases inhibitors of MMP-2 and ΜΜP-9, like ΤΙΜP1 were up-regulated. The above up-regulation was confirmed, since TIMP1 was up-regulated in all cancer cell lines compared to HCK1T (fold change 22.92, p</italic>0.05 in SiHa vs. HCK1T; 6.91, p</italic>0.05 in HeLa vs. HCK1T and 2.07, p</italic>0.05 in C33A vs. HCK1T, as shown in Table IV.
Table IV. Data from six proteins chosen for validation by MRM. The differential expression for each comparison (SiHa vs. HCK1T, HeLa vs. HCK1T and C33A vs. HCK1T) is presented for both the LC-MS/MS analysis and MRM analysis (mean±SD; *p<0.05, Student’s t-test).
Following this, we next validated another interesting protein, cathepsin D, as it has an active role in extracellular matrix remodeling (28). Cathepsin D was down-regulated in the two cancer cell lines, HeLa and C33A vs. HCK1T in LC-MS/MS analysis. The above down-regulation was confirmed in MRM analysis (fold change 0.14, p</italic>0.05 in HeLa vs. HCK1T and 0.11, p</italic>0.05 in C33A vs. HCK1T) as shown in Table IV. There was also a down-regulation in SiHa cell line compared to HCK1T (fold change 0.51, p</italic>0.05) shown in Table IV, which is consistent with the western blot analysis data of the cathepsin D in the secretome (Figure 9).
Besides cathepsin D, by employing MRM analysis, we have also confirmed the expression of another form of cathepsin, cathepsin B (CATB) which has an active role in the development of cancer and metastasis (29) and is classically secreted according to SignalP. CΑΤB was down-regulated in all cancer cell lines vs. HCK1T in the LC-MS/MS analysis, and MRM confirmed the above down-regulation (fold change 0.15, p</italic>0.05 in SiHa vs. HCK1T; 0.10, p</italic>0.05 in HeLa vs. HCK1T and 0.06, p</italic>0.05 in C33A vs. HCK1T) as shown in Table IV.
Superoxide dismutase 2 (SOD2) was further confirmed by MRM, besides western blot analysis. SOD2 was down-regulated in cancer cell lines SiHa and C33A vs. HCK1T; however, it was not detected in HeLa at all, by LC-MS/MS analysis. The above trend of down-regulation was confirmed in MRM analysis (fold change 0.39, p</italic>0.05 in SiHa vs. HCK1T; 0.42, p>0.05 in HeLa vs. HCK1T and 0.50, p>0.05 in C33A vs. HCK1T, as shown in Table IV.
Another classically secreted protein (SignalP) is glutaminyl-peptide cyclotransferase (QPCT) exhibiting up-regulated expression in several types of cancers like thyroid cancer (30). According to LC-MS/MS analysis, QPCT displayed a qualitative difference in SiHa cells, which was confirmed by MRM (fold change 1.55, p>0.05 in SiHa vs. HCK1T).
Sialidase-1 (NEU1) a classically secreted protein (SignalP) appears to have a role in multistage oncogenesis when if forms complexes with matrix metalloproteinase-9 (MMP-9) and G protein-coupled receptor (31). According to LC-MS/MS analysis, NEU1 was overexpressed in SiHa and C33A compared to HCK1T, and this was confirmed by MRM, where it was overexpressed in all cancer cell lines compared to HCK1T (fold change 4.45, p</italic>0.05 in SiHa vs. HCK1T; 2.55, p</italic>0.05 in HeLa vs. HCK1T and 1.54, p</italic>0.05 in C33A vs. HCK1T).
The comparisons of each cancer cell line vs. HCK1T for both LC-MS/MS and ΜRM analyses are presented in Table IV.
Discussion
The current study confirmed the deregulation of biological pathways that characterize cancer cells, namely glucose metabolism and unfolded protein response. These pathways and the corresponding proteins were also identified in our previous proteomic analysis (12). In the initial study, the tissue inhibitors of metalloproteases TIMP1 and TIMP2 were also identified as up-regulated in the secretome of the cervical cancer cells.
The high resolution proteomics analysis of the secretome and the subsequent prediction of deregulated biological pathways performed in the present study, indicated that proteolytic events are key processes in cervical cancer. The pathway of inhibition of matrix metalloproteases (MMPs) was predicted to be activated in cancer cell lines (Figure 4). In this pathway, TIMPs, which serve as inhibitors of MMP-2 and MMP-9, as well as ADAM10, were up-regulated in cancer cell lines compared to HCK1T. Metalloproteases constitute a sub-category of proteases that cleave peptide bonds of proteins. The role of matrix metalloproteases has been also studied in several types of cancers such as oral and cervical cancer (32,33). Proteases are classified as extracellular matrix metalloproteases (MMPs), cysteine proteases, serine protease, aspartic acid proteases and threonine proteases (34). Particularly, matrix metalloproteases or MMPs, represent enzymes which contribute to extracellular matrix degradation. MMP-2 and MMP-9 types degrade proteoglycan and non-proteoglycan components of extracellular matrix, like collagen IV and laminin-5. Extracellular matrix degradation facilitates the detachment of cancer cells from the primary tumor and the initiation of metastasis (35,36). ΜΜPs regulated by their inhibitors ΤΙΜPs (37) are generally up-regulated in cancer tissues and contribute to oncogenesis (35). As far as cervical cancer is concerned, there are conflicting data in the literature. Increased expression and activity of MMP-2 and MMP-9 has been reported in cervical cancer tissues (38). In a study that included primary tumors with stages of increasing severity, MMP-2 expression was up-regulated in advanced stage tumors, whereas ΜΜP-9 displayed the highest expression in tumors of early stages. The above observation probably reflects the differential roles of MMP-2 and MMP-9 in oncogenesis, where basically MMP-2 is up-regulated during oncogenesis, while MMP-9 has been shown to be down-regulated after stage I (35).
To further elucidate the role of MMPs in cervical cancer, we focused in the analysis and validation of the pathway inhibition of matrix metalloproteases. TIMPs, the cognate inhibitors of MMP-2 and MMP-9 were found to be up-regulated in all three cancer cell lines compared to HCK1T, and MMP-2 and MMP-9 were not identified in the secretome of the cell lines. A zymography experiment was performed and validated the bioinformatics prediction, as the up-regulation of MMP-2 and MMP-9 inhibitors led either to decreased or to the absence of catalytic activity of MMP-2 and MMP-9 respectively, in the secretome of cancer cell lines. It was confirmed that MMP-9 activity did not exist in the secretome of cancer cell lines HeLa and C33A, and MMP-2 activity was reduced in all cancer cell lines compared to HCK1T (Figure 4B and C). Also, the up-regulation of TIMP1 inhibitor was further confirmed by MRM, as TIMP1 was up-regulated in all cancer cell lines compared to HCK1T (Table IV).
Furthermore, in the same pathway of inhibition of matrix metalloproteases, ADAM10 was up-regulated. ADAM10 belongs to the ADAM family that cleaves extracellular matrix components. ADAM10 attenuates cell signaling by cleaving proteins like TNFα and growth factors like TGFα. TIMPs inhibit the proteolytic potential of ADAMs, following binding to the active catalytic site (39). ADAM10 is significantly overexpressed in breast cancer and colorectal cancer (40). Furthermore, ADAM10 has been reported to be secreted from pancreatic cancer cells (41) and is up-regulated in human hepatocellular carcinoma with an additional role in cancer cell migration and malignant transformation (42). In our study, ΑDAM10 displayed a qualitative difference in SiHa and HeLa cell lines and this pattern was actually validated by western blot analysis (Figure 8).
Besides metalloproteases, cathepsins represent a category of proteases that contribute to tumor aggressiveness and metastasis and thus may be considered as prognostic markers (43). Cathepsins constitute a superfamily of proteins with specific roles in oncogenesis, such as proliferation, angiogenesis, metastasis and aggressiveness (44). Cathepsin D is an aspartic acid protease which has been studied as a potential biomarker with increased expression in colorectal cancer, while its high levels have been linked to metastatic events (45). Furthermore, it has been reported to be highly secreted from lung cancer cell lines (46) and up-regulated in vaginal cancer compared to cervical cancer (47), playing also a role as a biomarker in breast cancer (48). Pro-cathepsin D has been found to be secreted from cancer cells and bound either by stromal cells inducing the proliferation of fibroblasts and further promoting carcinogenesis or by endothelial cells, and promoting angiogenesis. The ratio of pro-cathepsin D/cathepsin D, could be utilized as a prognostic factor in several types of cancers and also as a putative pharmaceutical target (28). Our goal was to study the role of the secreted form of cathepsin D that was down-regulated in the cell lines of HeLa and C33A compared to HCK1T, according to our LC-MS/MS analysis. The above down-regulation was further confirmed in all cancer cell lines vs. HCK1T both by western blot analysis, as well as with MRM. It is interesting that there was a band of ~50 kDa that corresponds to the secreted form of pro-cathepsin D (28). Based on this finding, we next investigated its pattern of expression in the total cell extract, since cathepsin D acts mainly in the lysosome under acidic conditions (28). Although the same expression pattern of down-regulation in cancer cell lines vs. HCK1T was documented in the total cell extract, two bands of lower molecular weight were identified. The first was identified at ~46 kDa, corresponding to the heavy chain and a second one corresponding at ~28 kDa, corresponding to the light chain of cathepsin D. The above experimental observations deriving both from secretome as well as from total cell extract, confirm the following proposed model described in the literature. Specifically, cathepsin D is synthesized in the rough endoplasmic reticulum as pre-procathepsin D. Upon its entrance to the Golgi complex, the signal peptide sequence is cleaved and pro-cathepsin D is glycosylated. Following this step, pro-Cathepsin D enters the lysosomes or the endosomes, where the pro-peptide AP is cleaved, and the enzymatic active form is generated. The subsequent proteolytic cleavage leads to the formation of mature cathepsin D, composed of a heavy and a light chain, as detected in the total cell extract analysis. The non-enzymatic form of pro-cathepsin D is secreted from cancer cells to the extracellular space (28), and this form was actually detected in the secretome analysis.
Cathepsin B is also a cysteine protease with extracellular matrix degradation potential. Cathepsin B is found in macrophages, hepatocytes and in endocrine organs, participating in the catabolism of proteins and in hormone processing (44). Cathepsin B may act synergistically with other cathepsins such as cathepsin Z, as their simultaneous silencing reduced the tumor size and led to inhibition of metastasis in mice models with breast cancer (49). In our study, cathepsin B proteomics exhibited down-regulation in cancer cell lines vs. HCK1T, a finding which was confirmed by MRM analysis.
The differential expression of two additional proteins was also confirmed by western blot analysis. FUCA1 is classically secreted, whereas SOD2 is non-classically secreted. FUCA1 is an enzyme which cleaves terminal fucose in glycan chains. It is involved in several cancers like breast cancer (22), colorectal cancer (23) and gastric cancer, exhibiting down-regulation (25). The up-regulation of FUCA1 in SiHa vs. HCK1T was also confirmed with western blot analysis. On the other hand, Superoxide dismutases (SOD) constitute metalloenzymes that act in the context of a cellular antioxidant system and are expressed both in prokaryotic and eukaryotic cells. These proteins protect cellular mechanisms from oxidative stress by converting superoxide radicals into hydrogen peroxide and oxygen (50). There are three members of the family in mammalians. SOD1 (Cu/ZnSOD), SOD2 (MnSOD) and SOD3 (ecSOD). SOD1 is mostly cytoplasmic, SOD2 is mitochondrial, whereas SOD3 is secreted (51). SOD2 has a very interesting role in oncogenesis, since in some cases its up-regulation acts as a protective mechanism, whereas in other cases its down-regulation contributes to the accumulation of reactive oxygen species (ROS), inhibiting cell death and favoring oncogenesis. Also, SOD2 expression levels depend on the stage of oncogenesis, since reduced levels of SOD2 are observed in the initial stages, whereas increased levels are observed in the late stages and particularly in metastatic tumors (51). Our goal was to study the SOD2 expression pattern as a secreted protein. SOD2 was down-regulated in cancer cell lines compared to HCK1T and this down-regulation was confirmed both in the secretome and in total cell extract. Furthermore, there was a down-regulation trend for SOD2 in all cancer cell lines vs. HCK1T as observed with MRM.
Glutaminyl-peptide cyclotransferase (QPCT) is a secreted protein implicated in biosynthesis of pyroglutamyl peptides. Its role is extensively studied in carcinogenesis. Recently, both QPCT mRNA and protein levels have been documented to be increased in thyroid carcinoma (30). In our model, QPCT was found to represent a qualitative difference in SiHa cell line and its overexpression was confirmed via MRM analysis.
Finally, sialidase-1 (NEU1) represents a secreted protein that catalyzes the removal of sialic acid from glycoproteins and glycolipids. NEU1 forms a complex with MMP9 and the receptor of GPCR that modulates tyrosine kinases RTK, and constituting a therapeutic target for multistage oncogenesis (31). Similar interactions of ΝΕU1, GPCR and EGFR have been studied in a pancreatic cancer model and it appears that NEU1 is a putative pharmaceutical target (52). NEU1 overexpression observed in our study in the comparisons of SiHa vs. HCK1T and of C33A vs. HCK1T, and was again confirmed via the MRM method.
In conclusion, the high resolution proteomics study of cervical cell lines secretome employed in the present study, confirmed previous findings and revealed a series of novel differentially expressed proteins, as well as deregulated pathways, –such as the inhibition of matrix metalloproteases, with significant and critical roles in cervical cancer.
Acknowledgements
This study was funded by the European Union’s European Social Fund (ESF) and Greek National Funds through the Program THALIS, under the Operational Program Education and Lifelong Learning of the National Strategic Reference Framework (NSRF), Grant No. 70-3-11830 to Kalliopi I. Pappa, and by the Oncology Program of the Central Council of Health of the Ministry of Health, Grant No. 70-3-9209 to Nicholas P. Anagnou. The authors wish to thank Dr. Tohru Kiyono (National Cancer Centre Research Institute, Tokyo, Japan) for his generous gift of the HCK1T normal cervical cell line.
References
- 1.de Villiers EM. Cross-roads in the classification of papillomaviruses. Virology. 2013;445:2–10. doi: 10.1016/j.virol.2013.04.023. [DOI] [PubMed] [Google Scholar]
- 2.Ferlay J, Soerjomataram I, Dikshit R, Eser S, Mathers C, Rebelo M, Parkin DM, Forman D, Bray F. Cancer incidence and mortality worldwide: Sources, methods and major patterns in GLOBOCAN 2012. Int J Cancer. 2015;136:E359–386. doi: 10.1002/ijc.29210. [DOI] [PubMed] [Google Scholar]
- 3.Schiffman MH, Castle P. Epidemiologic studies of a necessary causal risk factor: Human papillomavirus infection and cervical neoplasia. J Natl Cancer Inst. 2003;95:E2. doi: 10.1093/jnci/95.6.e2. [DOI] [PubMed] [Google Scholar]
- 4.Doorbar J, Quint W, Banks L, Bravo IG, Stoler M, Broker TR, Stanley MA. The biology and life-cycle of human papillomaviruses. Vaccine. 2012;30(Suppl 5):F55–70. doi: 10.1016/j.vaccine.2012.06.083. [DOI] [PubMed] [Google Scholar]
- 5.Stanley MA. Epithelial cell responses to infection with human papillomavirus. Clin Microbiol Rev. 2012;25:215–222. doi: 10.1128/CMR.05028-11. [DOI] [PMC free article] [PubMed] [Google Scholar]
- 6.Egawa N, Egawa K, Griffin H, Doorbar J. Human papillomaviruses; epithelial tropisms, and the development of neoplasia. Viruses. 2015;7:3863–3890. doi: 10.3390/v7072802. [DOI] [PMC free article] [PubMed] [Google Scholar]
- 7.Schiffman M, Doorbar J, Wentzensen N, de Sanjose S, Fakhry C, Monk BJ, Stanley MA, Franceschi S. Carcinogenic human papillomavirus infection. Nat Rev Dis Primers. 2016;2:16086. doi: 10.1038/nrdp.2016.86. [DOI] [PubMed] [Google Scholar]
- 8.Kontostathi G, Zoidakis J, Anagnou NP, Pappa KI, Vlahou A, Makridakis M. Proteomics approaches in cervical cancer: Focus on the discovery of biomarkers for diagnosis and drug treatment monitoring. Expert Rev Proteomics. 2016;13:731–745. doi: 10.1080/14789450.2016.1210514. [DOI] [PubMed] [Google Scholar]
- 9.Paltridge JL, Belle L, Khew-Goodall Y. The secretome in cancer progression. Biochim Biophys Acta. 2013;1834:2233–2241. doi: 10.1016/j.bbapap.2013.03.014. [DOI] [PubMed] [Google Scholar]
- 10.Yoneyama K, Kojima S, Kodani Y, Yamaguchi N, Igarashi A, Kurose K, Kawase R, Takeshita T, Hattori S, Nagata K. Proteomic identification of autoantibodies in sera from patients with ovarian cancer as possible diagnostic biomarkers. Anticancer Res. 2015;35:881–889. [PubMed] [Google Scholar]
- 11.Yoneyama K, Shibata R, Igarashi A, Kojima S, Kodani Y, Nagata K, Kurose K, Kawase R, Takeshita T, Hattori S. Proteomic identification of dihydrolipoamide dehydrogenase as a target of autoantibodies in patients with endometrial cancer. Anticancer Res. 2014;34:5021–5027. [PubMed] [Google Scholar]
- 12.Kontostathi G, Zoidakis J, Makridakis M, Lygirou V, Mermelekas G, Papadopoulos T, Vougas K, Vlamis-Gardikas A, Drakakis P, Loutradis D, Vlahou A, Anagnou NP, Pappa KI. Cervical cancer cell line secretome highlights the roles of transforming growth factor-beta-induced protein ig-h3, peroxiredoxin-2, and NRF2 on cervical carcinogenesis. BioMed Res Int. 2017;2017:731–745. doi: 10.1155/2017/4180703. [DOI] [PMC free article] [PubMed] [Google Scholar]
- 13.Narisawa-Saito M, Handa K, Yugawa T, Ohno S, Fujita M, Kiyono T. HPV16 E6-mediated stabilization of erbb2 in neoplastic transformation of human cervical keratinocytes. Oncogene. 2007;26:2988–2996. doi: 10.1038/sj.onc.1210118. [DOI] [PubMed] [Google Scholar]
- 14.Makridakis M, Gagos S, Petrolekas A, Roubelakis MG, Bitsika V, Stravodimos K, Pavlakis K, Anagnou NP, Coleman J, Vlahou A. Chromosomal and proteome analysis of a new T24-based cell line model for aggressive bladder cancer. Proteomics. 2009;9:287–298. doi: 10.1002/pmic.200800121. [DOI] [PubMed] [Google Scholar]
- 15.Makridakis M, Roubelakis MG, Bitsika V, Dimuccio V, Samiotaki M, Kossida S, Panayotou G, Coleman J, Candiano G, Anagnou NP, Vlahou A. Analysis of secreted proteins for the study of bladder cancer cell aggressiveness. J Proteome Res. 2010;9:3243–3259. doi: 10.1021/pr100189d. [DOI] [PubMed] [Google Scholar]
- 16.Lawlor K, Nazarian A, Lacomis L, Tempst P, Villanueva J. Pathway-based biomarker search by high-throughput proteomics profiling of secretomes. J Proteome Res. 2009;8:1489–1503. doi: 10.1021/pr8008572. [DOI] [PubMed] [Google Scholar]
- 17.Filip S, Vougas K, Zoidakis J, Latosinska A, Mullen W, Spasovski G, Mischak H, Vlahou A, Jankowski J. Comparison of depletion strategies for the enrichment of low-abundance proteins in urine. PloS One. 2015;10:e0133773. doi: 10.1371/journal.pone.0133773. [DOI] [PMC free article] [PubMed] [Google Scholar]
- 18.Petersen TN, Brunak S, von Heijne G, Nielsen H. Signalp 4.0: Discriminating signal peptides from transmembrane regions. Nat Methods. 2011;8:785–786. doi: 10.1038/nmeth.1701. [DOI] [PubMed] [Google Scholar]
- 19.Bendtsen JD, Jensen LJ, Blom N, Von Heijne G, Brunak S. Feature-based prediction of non-classical and leaderless protein secretion. Prot Eng Des Sel. 2004;17:349–356. doi: 10.1093/protein/gzh037. [DOI] [PubMed] [Google Scholar]
- 20.MacLean B, Tomazela DM, Shulman N, Chambers M, Finney GL, Frewen B, Kern R, Tabb DL, Liebler DC, MacCoss MJ. Skyline: An open source document editor for creating and analyzing targeted proteomics experiments. Bioinformatics. 2010;26:966–968. doi: 10.1093/bioinformatics/btq054. [DOI] [PMC free article] [PubMed] [Google Scholar]
- 21.Shao Y, Yin X, Kang D, Shen B, Zhu Z, Li X, Li H, Xie L, Wang G, Liang Y. An integrated strategy for the quantitative analysis of endogenous proteins: A case of gender-dependent expression of P450 enzymes in rat liver microsome. Talanta. 2017;170:514–522. doi: 10.1016/j.talanta.2017.04.050. [DOI] [PubMed] [Google Scholar]
- 22.Cheng TC, Tu SH, Chen LC, Chen MY, Chen WY, Lin YK, Ho CT, Lin SY, Wu CH, Ho YS. Down-regulation of α-l-fucosidase 1 expression confers inferior survival for triple-negative breast cancer patients by modulating the glycosylation status of the tumor cell surface. Oncotarget. 2015:21283–21300. doi: 10.18632/oncotarget.4238. [DOI] [PMC free article] [PubMed] [Google Scholar]
- 23.Otero-Estevez O, Martinez-Fernandez M, Vazquez-Iglesias L, Paez de la Cadena M, Rodriguez-Berrocal FJ, Martinez-Zorzano VS. Decreased expression of α-l-fucosidase gene fuca in human colorectal tumors. Int J Mol Sci. 2013;14:16986–16998. doi: 10.3390/ijms140816986. [DOI] [PMC free article] [PubMed] [Google Scholar]
- 24.Vesce F, Biondi C. α-l-fucosidase activity in endometrial, cervical and ovarian cancer. Eur J Gynaecol Oncol. 1983;4:135–138. [PubMed] [Google Scholar]
- 25.Zhao YP, Xu XY, Fang M, Wang H, You Q, Yi CH, Ji J, Gu X, Zhou PT, Cheng C, Gao CF. Decreased core-fucosylation contributes to malignancy in gastric cancer. PloS One. 2014;9:e94536. doi: 10.1371/journal.pone.0094536. [DOI] [PMC free article] [PubMed] [Google Scholar]
- 26.Wang W, Jia HL, Huang JM, Liang YC, Tan H, Geng HZ, Guo LY, Yao SZ. Identification of biomarkers for lymph node metastasis in early-stage cervical cancer by tissue-based proteomics. Brit J Cancer. 2014;110:1748–1758. doi: 10.1038/bjc.2014.92. [DOI] [PMC free article] [PubMed] [Google Scholar]
- 27.Nakata K, Saitoh R, Amano J, Ichibangase T, Ishigai M, Imai K. Comprehensive and temporal analysis of secreted proteins in the medium from IL-6 exposed human hepatocyte. Biomed Chromatogr. 2014;28:742–750. doi: 10.1002/bmc.3103. [DOI] [PubMed] [Google Scholar]
- 28.Benes P, Vetvicka V, Fusek M. Cathepsin D--many functions of one aspartic protease. Crit Rev Oncol Hematol. 2008;68:12–28. doi: 10.1016/j.critrevonc.2008.02.008. [DOI] [PMC free article] [PubMed] [Google Scholar]
- 29.Reinheckel T, Peters C, Kruger A, Turk B, Vasiljeva O. Differential impact of cysteine cathepsins on genetic mouse models of de novo carcinogenesis: Cathepsin B as emerging therapeutic target. Front Pharmacol. 2012;3:133. doi: 10.3389/fphar.2012.00133. [DOI] [PMC free article] [PubMed] [Google Scholar]
- 30.Kehlen A, Haegele M, Menge K, Gans K, Immel UD, Hoang-Vu C, Klonisch T, Demuth HU. Role of glutaminyl cyclases in thyroid carcinomas. Endocr Relat Cancer. 2013;20:79–90. doi: 10.1530/ERC-12-0053. [DOI] [PubMed] [Google Scholar]
- 31.Haxho F, Neufeld RJ, Szewczuk MR. Neuraminidase-1: A novel therapeutic target in multistage tumorigenesis. Oncotarget. 2016;7:40860–40881. doi: 10.18632/oncotarget.8396. [DOI] [PMC free article] [PubMed] [Google Scholar]
- 32.Huang AC, Hsu SC, Kuo CL, Liao CL, Lai KC, Lin TP, Wu SH, Lu HF, Tang NY, Yang JS, Chung JG. Involvement of matrix metalloproteinases in the inhibition of cell invasion and migration through the inhibition of NF-κΒ by the new synthesized ethyl 2-[N-p-chlorobenzyl-(2’-methyl)]anilino-4-oxo-4,5-dihydrofuran-3-carboxylate (JOTO1007) in human cervical cancer Ca Ski cells. In Vivo. 2009;23:613–619. [PubMed] [Google Scholar]
- 33.Hung YW, Tsai CW, Wu CN, Shih LC, Chen YY, Liu YF, Hung HS, Shen MY, Chang WS, Bau DT. The contribution of matrix metalloproteinase-8 promoter polymorphism to oral cancer susceptibility. In Vivo. 2017;31:585–590. doi: 10.21873/invivo.11098. [DOI] [PMC free article] [PubMed] [Google Scholar]
- 34.Lopez-Otin C, Matrisian LM. Emerging roles of proteases in tumour suppression. Nat Rev Cancer. 2007;7:800–808. doi: 10.1038/nrc2228. [DOI] [PubMed] [Google Scholar]
- 35.Rauvala M, Aglund K, Puistola U, Turpeenniemi-Hujanen T, Horvath G, Willen R, Stendahl U. Matrix metalloproteinases-2 and -9 in cervical cancer: Different roles in tumor progression. Int J Gynecol Cancer. 2006;16:1297–1302. doi: 10.1111/j.1525-1438.2006.00448.x. [DOI] [PubMed] [Google Scholar]
- 36.Schropfer A, Kammerer U, Kapp M, Dietl J, Feix S, Anacker J. Expression pattern of matrix metalloproteinases in human gynecological cancer cell lines. BMC Cancer. 2010;10:553. doi: 10.1186/1471-2407-10-553. [DOI] [PMC free article] [PubMed] [Google Scholar]
- 37.Yamamoto K, Murphy G, Troeberg L. Extracellular regulation of metalloproteinases. Matrix Biol. 2015;44-46:255–263. doi: 10.1016/j.matbio.2015.02.007. [DOI] [PubMed] [Google Scholar]
- 38.Ghosh A, Moirangthem A, Dalui R, Ghosh T, Bandyopadhyay A, Dasgupta A, Banerjee U, Jana N, Basu A. Expression of matrix metalloproteinase-2 and 9 in cervical intraepithelial neoplasia and cervical carcinoma among different age groups of premenopausal and postmenopausal women. J Cancer Res Clin Oncol. 2014;140:1585–1593. doi: 10.1007/s00432-014-1695-2. [DOI] [PMC free article] [PubMed] [Google Scholar]
- 39.Miller MA, Sullivan RJ, Lauffenburger DA. Molecular pathways: Receptor ectodomain shedding in treatment, resistance, and monitoring of cancer. Clin Cancer Res. 2017;23:623–629. doi: 10.1158/1078-0432.CCR-16-0869. [DOI] [PMC free article] [PubMed] [Google Scholar]
- 40.Herrlich P, Herrlich A. ADAM metalloprotease-released cancer biomarkers. Trends Cancer. 2017;3:482–490. doi: 10.1016/j.trecan.2017.05.001. [DOI] [PubMed] [Google Scholar]
- 41.Wojtalewicz N, Sadeqzadeh E, Weiss JV, Tehrani MM, Klein-Scory S, Hahn S, Schmiegel W, Warnken U, Schnolzer M, de Bock CE, Thorne RF, Schwarte-Waldhoff I. A soluble form of the giant cadherin fat1 is released from pancreatic cancer cells by ADAM10 mediated ectodomain shedding. PloS One. 2014;9:e90461. doi: 10.1371/journal.pone.0090461. [DOI] [PMC free article] [PubMed] [Google Scholar]
- 42.Yuan S, Lei S, Wu S. ADAM10 is overexpressed in human hepatocellular carcinoma and contributes to the proliferation, invasion and migration of hepg2 cells. Oncol Rep. 2013;30:1715–1722. doi: 10.3892/or.2013.2650. [DOI] [PubMed] [Google Scholar]
- 43.Duffy MJ. Proteases as prognostic markers in cancer. Clin Cancer Res. 1996;2:613–618. [PubMed] [Google Scholar]
- 44.Tan GJ, Peng ZK, Lu JP, Tang FQ. Cathepsins mediate tumor metastasis. World J Biol Chem. 2013;4:91–101. doi: 10.4331/wjbc.v4.i4.91. [DOI] [PMC free article] [PubMed] [Google Scholar]
- 45.Kirana C, Shi H, Laing E, Hood K, Miller R, Bethwaite P, Keating J, Jordan TW, Hayes M, Stubbs R. Cathepsin D expression in colorectal cancer: From proteomic discovery through validation using western blotting, immunohistochemistry, and tissue microarrays. Int J Proteomics. 2012;2012:245819. doi: 10.1155/2012/245819. [DOI] [PMC free article] [PubMed] [Google Scholar]
- 46.Lou X, Xiao T, Zhao K, Wang H, Zheng H, Lin D, Lu Y, Gao Y, Cheng S, Liu S, Xu N. Cathepsin D is secreted from M-BE cells: Its potential role as a biomarker of lung cancer. J Proteome Res. 2007;6:1083–1092. doi: 10.1021/pr060422t. [DOI] [PubMed] [Google Scholar]
- 47.Lomnytska MI, Becker S, Hellman K, Hellstrom AC, Souchelnytskyi S, Mints M, Hellman U, Andersson S, Auer G. Diagnostic protein marker patterns in squamous cervical cancer. Proteomics Clin Appl. 2010;4:17–31. doi: 10.1002/prca.200900086. [DOI] [PubMed] [Google Scholar]
- 48.Dian D, Heublein S, Wiest I, Barthell L, Friese K, Jeschke U. Significance of the tumor protease cathepsin D for the biology of breast cancer. Histol Histopathol. 2014;29:433–438. doi: 10.14670/HH-29.10.433. [DOI] [PubMed] [Google Scholar]
- 49.Sevenich L, Schurigt U, Sachse K, Gajda M, Werner F, Muller S, Vasiljeva O, Schwinde A, Klemm N, Deussing J, Peters C, Reinheckel T. Synergistic antitumor effects of combined cathepsin B and cathepsin Z deficiencies on breast cancer progression and metastasis in mice. Proc Natl Acad Sci USA. 2010;107:2497–2502. doi: 10.1073/pnas.0907240107. [DOI] [PMC free article] [PubMed] [Google Scholar]
- 50.Termini L, Filho AL, Maciag PC, Etlinger D, Alves VA, Nonogaki S, Soares FA, Villa LL. Deregulated expression of superoxide dismutase-2 correlates with different stages of cervical neoplasia. Dis Markers. 2011;30:275–281. doi: 10.3233/DMA-2011-0784. [DOI] [PMC free article] [PubMed] [Google Scholar]
- 51.Che M, Wang R, Li X, Wang HY, Zheng XF. Expanding roles of superoxide dismutases in cell regulation and cancer. Drug Discov Today. 2016;21:143–149. doi: 10.1016/j.drudis.2015.10.001. [DOI] [PMC free article] [PubMed] [Google Scholar]
- 52.Gilmour AM, Abdulkhalek S, Cheng TS, Alghamdi F, Jayanth P, O’Shea LK, Geen O, Arvizu LA, Szewczuk MR. A novel epidermal growth factor receptor-signaling platform and its targeted translation in pancreatic cancer. Cell Signal. 2013;25:2587–2603. doi: 10.1016/j.cellsig.2013.08.008. [DOI] [PubMed] [Google Scholar]


