. 2018 Jul 18;7:e32948. doi: 10.7554/eLife.32948

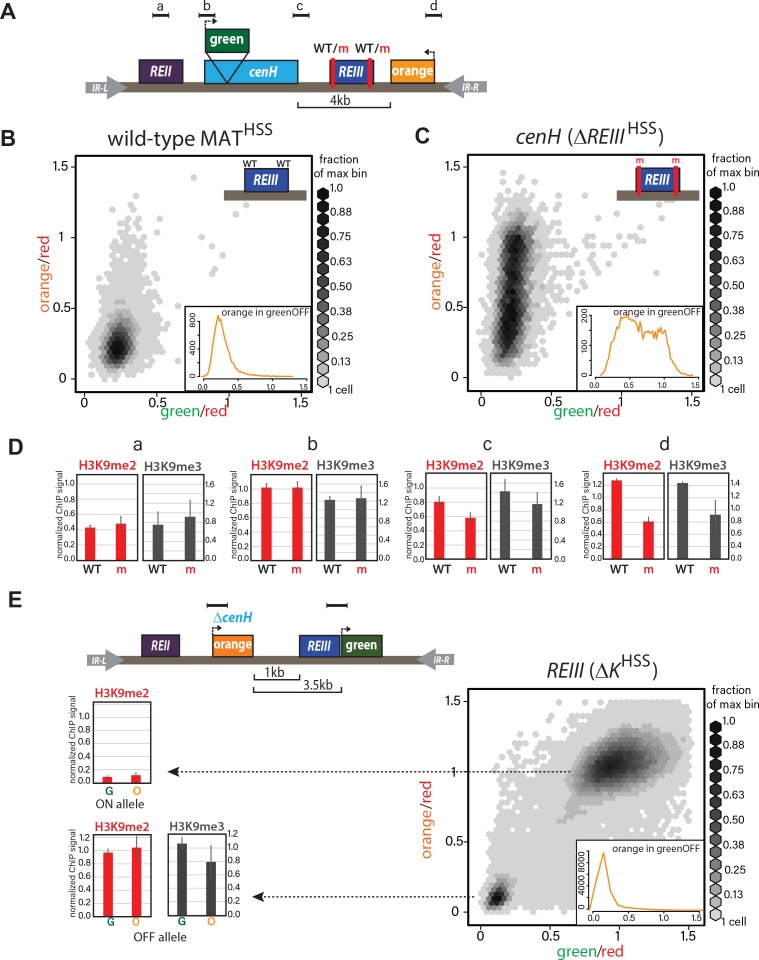
Figure 2. ncRNA-dependent and independent nucleation yields qualitatively different spreading reactions in the MAT locus.

(A) Diagram of the reporters within MATHSS and ΔREIIIHSS. WT and m for REIII indicate the presence or deletion of the Atf1/Pcr1 binding sites, respectively. (B) 2D-density hexbin plot showing the ‘red’-normalized ‘green’ and ‘orange’ fluorescence for wild-type MATHSS cells. Scale bar shows every other bin cutoff as a fraction of the bin with the most cells. Inset: histogram of the ‘red’-normalized ‘orange’ fluorescence distribution of ‘green'OFF cells. (C) 2D-density hexbin plot and inset as above for ΔREIIIHSS, which contains two 7 bp Atf1/Pcr1-binding site deletions (m) within the REIII element. (D) ChIP for H3K9me2 (red) and H3K9me3 (grey) for amplicons indicated in (A). normalized to dh. WT, wild-type MATHSS, m, ΔREIIIHSS. (E) TOP: diagram of the reporters within ΔKHSS. The cenH nucleator and additional 5’ sequence is deleted and replaced by ‘orange’. ‘green’ is located directly proximal to REIII and serves as the nucleation clamp. ChIP amplicons are indicated as black bars. BOTTOM: 2D- density hexbin plot and inset as above. LEFT: ChIP for H3K9me2 (red) and H3K9me3 (grey) for ‘green’ and ‘orange’ in isolated ΔKHSS-ON or ΔKHSS-OFF alleles. In hexbin plots, the Δclr4 derivative of each strain was used to normalize the X- and Y-axes to = 1. Error bars indicate standard deviation of technical replicates.

Figure 2.

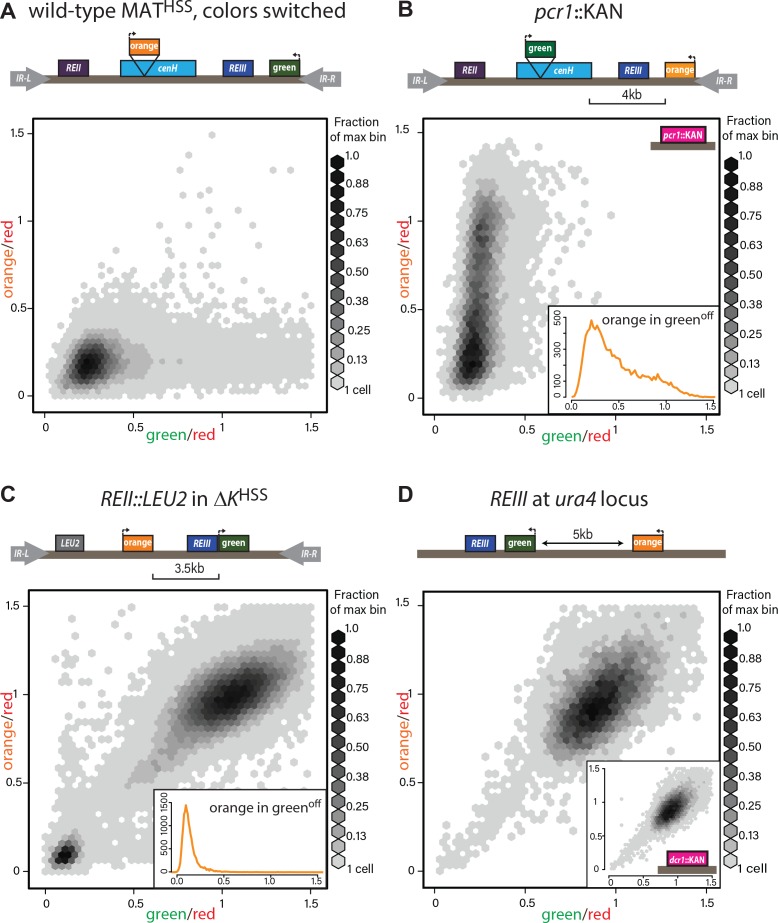
Figure 2—figure supplement 1. Heterochromatin spreading characteristics of cis-acting elements at the tightly repressed MAT locus.

Figure 2—figure supplement 1.

(A) The MATHSS documents tight repression of the wild-type MAT locus. As in Figure 2A and B, with ‘green’ and ‘orange’ switched. (B) Stochastic spreading with intermediate states in pcr1::KAN. pcr1 transcription factor was knocked-out in the PAS217 wild-type MATHSS. Plot and inset as in Figure 2B. (C) REII does not contribute to bimodal distribution seen for ΔKHSS. The REII locus (1 kb) was replaced with the LEU2 gene before clr4+ was introduced by cross. (D) REIII is unable to establish spreading at an ectopic site. 2D density hexbin plots of ura4::REIIIHSS5kb. Normalized green and orange are near 1.0, indicating a failure to repress both reporters. Inset: 2D density hexbin plots of ura4::REIIIHSS5kb dcr1::KAN. dcr1 was deleted to release extra heterochromatin factors from RNAi- repressed loci. No additional silencing is detected.
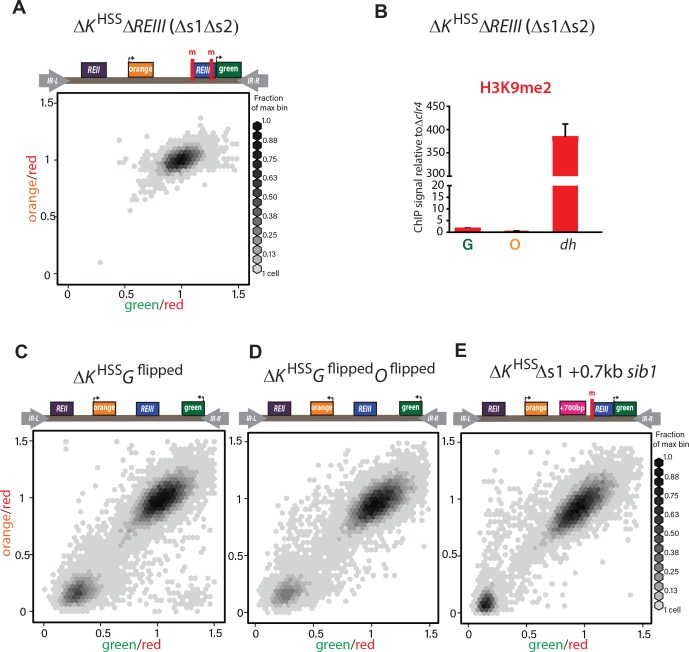
Figure 2—figure supplement 2. REIII is required for heterochromatin formation in ΔKHSS.

Figure 2—figure supplement 2.

(A) Deletion of both Atf1-/Pcr1-binding sites before introduction of clr4+ in ΔKHSS blocks gene silencing. In 34/34 strains tested (one representative shown), ΔKHSSΔs1Δs2 cannot form repressed states. (B) H3K9me2 does not accumulate when both Atf1/Pcr1-binding sites are deleted in ΔKHSS. H3K9me2 ChIP in ΔKHSSΔs1Δs2 at ‘green’, ‘orange’ and dh. (ΔKHSS-OFF accumulates H3K9me2 to similar extent as dh, Figure 2E). Error bars indicate standard deviation of technical replicates. (C) ‘green’ orientation and position does not substantially affect ΔKHSS behavior. In ΔKHSS Gflipped‘green’ is flipped in orientation with respect to ΔKHSS. (D) ‘green’ and ‘orange’ orientations do not substantially affect ΔKHSS behavior. In ΔKHSS Gflipped Oflipped‘green’ is located as in C and ‘orange’ is flipped in orientation with respect to ΔKHSS. ‘green’ in (C) and (D) is 2.1 kb downstream from its location in ΔKHSS now on the distal side of the mat3m cassette. (E) Increasing distance between REIII and ‘orange’ does not substantially affect ΔKHSS behavior. The Atf1/Pcr1-binding site proximal to ‘orange’ was deleted (Δs1) and 700 bp of the sib1 ORF inserted to the left of the Δs1 site. 2D-hexbin plots as in Figure 2.