. 2018 Jul 18;7:e32948. doi: 10.7554/eLife.32948

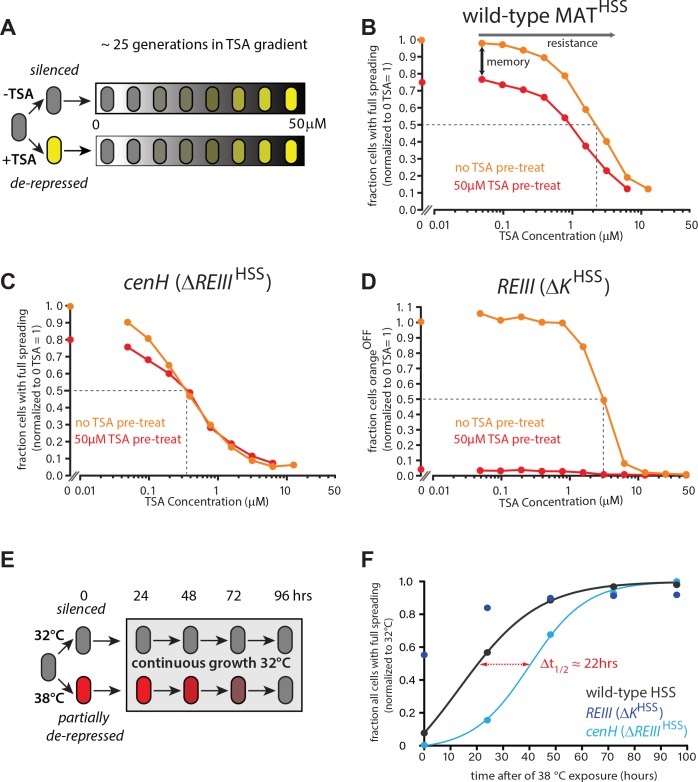
Figure 4. ncRNA-nucleated spreading exhibits weak memory and resistance in the absence of REIII.

(A) Experimental schematic for memory and resistance measurements. Cells in log phase were treated with TSA (50 μM) for 10 generations to erase all heterochromatin (de-repressed, yellow) or kept untreated (repressed, gray). Both populations are then grown in a gradient of TSA concentration from 0 to 50 μM for 25 generations. (B) The wild-type MAT locus exhibits memory in silencing ‘orange’ throughout the TSA gradient. The fraction of ‘green'OFF cells that fully silence ‘orange’ normalized to the no TSA pre-treatment, 0 μM TSA point are plotted for each TSA concentration. Red line: cell ancestrally TSA pre-treated; light orange line: cells without pre-treatment. (C) Spreading from cenH exhibits weak memory and low resistance. Cell populations as above. (D) ncRNA-independent spreading exhibits high resistance. The fraction of ‘orange'OFF for all cells is plotted, because in the TSA pre-treatment almost no ‘green'OFF cells can be detected. Dotted lines indicate the half-resistance points: TSA concentration at which 50% of non-pretreated cells fail to form heterochromatin at ‘orange’. Memory is the difference between orange and red lines. One of two full biological repeats of the experiment is shown.( E) Experimental schematic for heat stress and recovery. Cells were grown at either 32 or 38°C for 10 generations and strains subsequently grown continuously for 96 hr at 32°C. (F) The fraction of cells with full spreading (‘green'OFF and ‘orange'OFF) after 38°C exposure and recovery normalized to the fraction of cells with full spreading at 32°C for each strain is plotted over time. For wild-type MATHSS and ΔREIIIHSS strains, we fit a simple sigmoidal dose response curve and determined a t1/2 value. The difference in t1/2 values or Δt1/2 is ~22 hr or ~9–10 generations.

Figure 4.

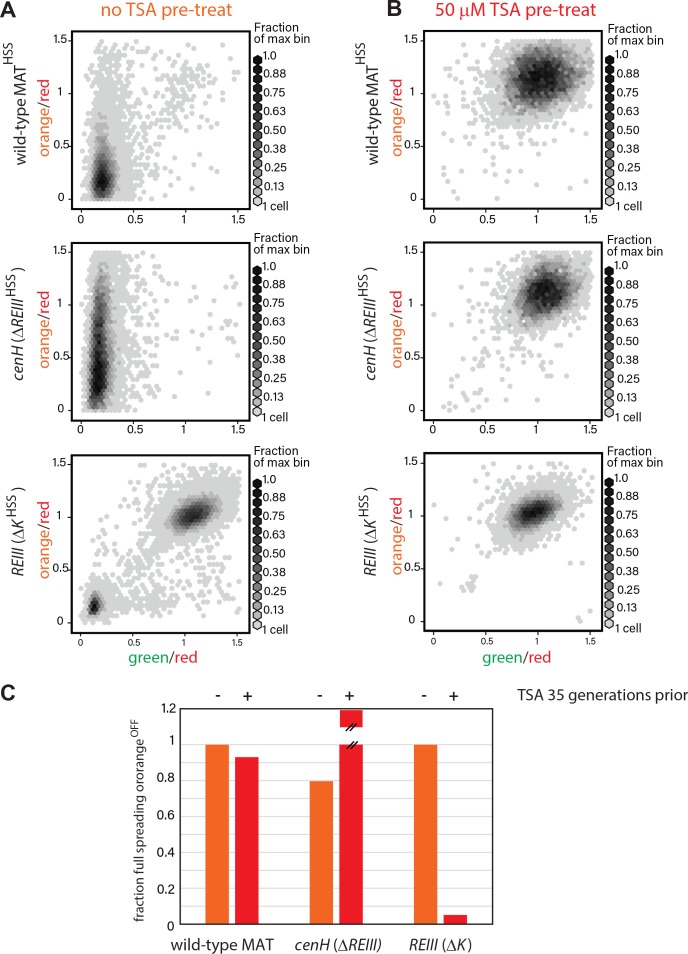
Figure 4—figure supplement 1. heterochromatin behaviors during TSA treatment and after 35 generations.

Figure 4—figure supplement 1.

(A) 2D density hexbin plots of wild-type MATHSS, ΔREIIIHSS, and ΔKHSS strains grown 10 generations without TSA. (B) 2D density hexbin plots of wild-type MAT locusHSS, ΔREIIIHSS, and ΔKHSS strains grown 10 generations in 50 μM TSA. The density distributions are near 1.0 in all strains indicating complete erasure of heterochromatin. (C) History dependence at 35 generations after pretreatments. The fraction of cells with full spreading (wild-type MAT and ΔREIII) or fraction of cells with orangeOFF (ΔK) normalized to the highest value for ancestrally untreated cells (=1) is shown for the 0 µM TSA point. TSA pretreated cells for ΔREIIIHSS show higher repression than untreated cells. We interpret this to indicate experimental variations in silencing in the absence of memory. This is because for all other circumstances, TSA treatment results in reduced spreading, including for ΔREIIIHSS at 25 generations post-treatment.
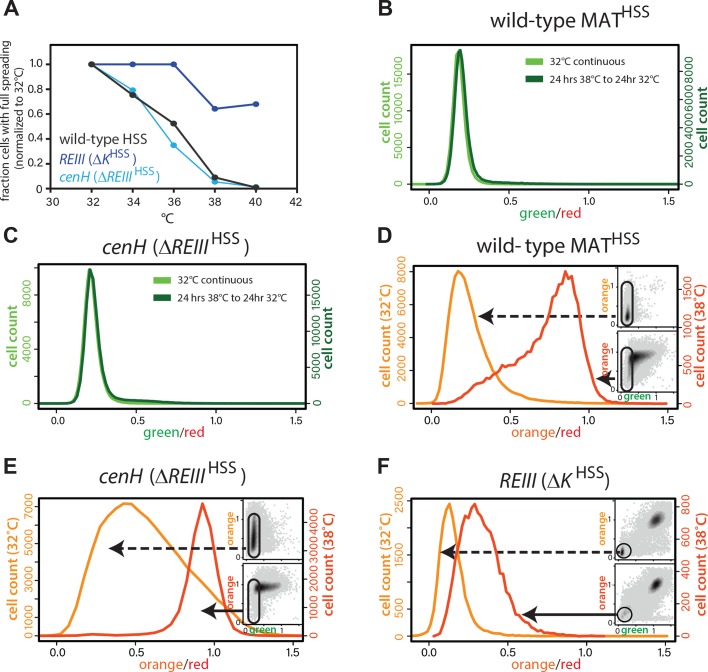
Figure 4—figure supplement 2. Behavior of MAT heterochromatin at elevated temperature.

Figure 4—figure supplement 2.

(A) The resistance of the heterochromatin state from 32°C to 40°C in wild-type MATHSS, ΔKHSS, and ΔREIIIHSS. The fraction of cells that fully repress both ‘orange’ and ‘green’ (full spreading) at each temperature is plotted normalized to the given strains value at 32°C. (B and C) nucleation is recovered within 24 hr at 32°C. 1-D histogram showing the distribution of green fluorescence in wild-type MAT locusHSS (B) or ΔREIIIHSS (C) cells grown either for 48 hr continuously at 32°C (left y-axis, light green) or heat stressed for 24 hr at 38°C followed by 24 hr growth at 32°C (right y-axis, dark green). (D–F) Histograms of ‘red’-normalized ‘orange’ fluorescence distribution in ‘green'OFF cells are shown for cells grown at both 32°C (light orange) and 38°C (dark orange). Insets: 2D density hexbin plots, ‘green'OFF cells are schematically circled. (C-E) represent t = 0 in Figure 4F.