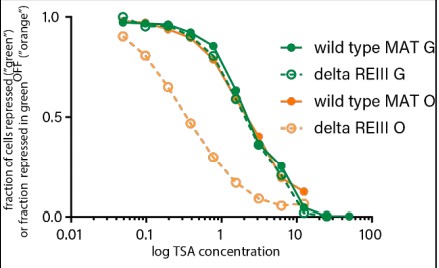
Author response image 2. “green” at cenH shows the same resistance to TSA irrespective of spreading behavior.

The same cells plotted in Figure 4B and C are plotted for the 0 TSA condition. Note that green lines represent fraction of total “green”OFF, orange lines represent fraction of “orange” repressed cells within “green”OFF.
