

Summary
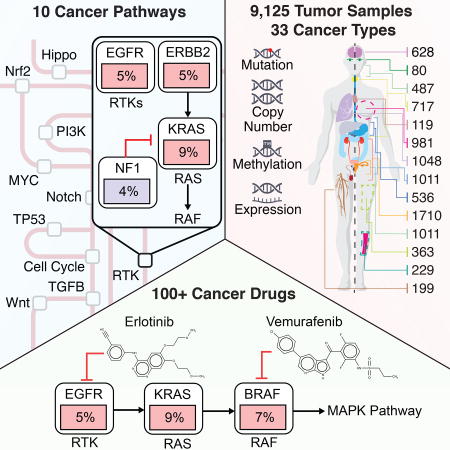
Genetic alterations in signaling pathways that control cell cycle progression, apoptosis, and cell growth are common hallmarks of cancer, but the extent, mechanisms, and co-occurrence of alterations in these pathways differ between individual tumors and tumor types. Using mutations, copy-number changes, mRNA expression, gene fusions and DNA methylation in 9,125 tumors profiled by The Cancer Genome Atlas (TCGA), we analyzed the mechanisms and patterns of somatic alterations in 10 canonical pathways: cell cycle, Hippo, Myc, Notch, NRF2, PI-3-Kinase/Akt, RTK-RAS, TGFβ signaling, P53 and β-catenin/WNT. We charted the detailed landscape of pathway alterations in 33 cancer types, stratified into 64 subtypes, and identified patterns of co-occurrence and mutual exclusivity. Eighty-nine percent of tumors had at least one driver alteration in these pathways, and 57% percent of tumors had at least one alteration potentially targetable by currently available drugs. Thirty percent of tumors had multiple targetable alterations, indicating opportunities for combination therapy.
Keywords: pan-cancer, signaling pathways, whole exome sequencing, therapeutics, combination therapy, TCGA, PanCanAtlas, cancer genome atlas, cancer genomics, precision oncology
ITI
An integrated analysis of genetic alterations in 10 signaling pathways in >9,000 tumors profiled by TCGA highlights significant representation of individual and co-occurring actionable alterations in these pathways, suggesting opportunities for targeted and combination therapies.
Introduction
Cancer is a disease in which cells have acquired the ability to divide and grow uncontrollably (Hanahan and Weinberg, 1998), (Hanahan and Weinberg, 2011), usually through genetic alterations in specific genes. Advances in DNA sequencing over the past decade have made it possible to systematically study these genetic changes, and we now have a better understanding of the commonly involved processes and signaling pathways (Garraway and Lander, 2013; Vogelstein et al., 2013). As more genetic alterations become targetable by specific drugs, DNA sequencing is becoming part of routine clinical care (Hartmaier et al., 2017; Schram et al., 2017; Sholl et al., 2016; Zehir et al., 2017). However, there is considerable variation in the genes and pathways altered across different tumor types and individual tumor samples, and a complete understanding of the genes and pathways altered in all cancer types is essential to identify potential therapeutic options and vulnerabilities.
Several important signaling pathways have been identified as frequently genetically altered in cancer, including the RTK/RAS/MAP-Kinase (hereafter also called RTK-RAS for brevity) pathway, PI3K/Akt signaling, and others (Vogelstein and Kinzler, 2004). Members of these pathways and their interactions have been captured in a number of pathway databases, such as Pathway Commons (Cerami et al., 2011), which aggregates a number of ~20 databases, including REACTOME (Joshi-Tope et al., 2005) and KEGG (Kanehisa and Goto, 2000). Genes in key pathways are not altered at equal frequencies, with certain genes recurrently altered and well-known in cancer, while others are only rarely or never altered.
Recurrence of rare alterations often requires large numbers of samples for detection (Lawrence et al., 2014). This is confounded by the challenge to distinguish between functionally relevant (or “driver” alterations) from non-oncogenic “passenger” events (Gao et al., 2014), especially in tumor types with a high background mutation burden (Alexandrov et al., 2013; Lawrence et al., 2013). In these cases, many mutations, even when they occur in cancer genes, may have no functional effect. This topic is further addressed in Bailey et al (Bailey et al., 2017).
Previous studies by The Cancer Genome Atlas (TCGA) have incrementally mapped out the alterations landscape in signaling pathways. Certain pathways, such as RTK-RAS signaling or the cell cycle pathway, are altered at high frequencies across many different tumor types, whereas other pathways are altered in more specific subsets of malignancies (e.g., alterations in the oxidative stress response pathway are strongly associated with squamous histologies). With >10,000 samples characterized by TCGA, there is an opportunity to systematically characterize and define the alterations within well-known cancer pathways across all tumor types and map out commonalities and differences across pathways. The existence of shared genomic features across histologies has been highlighted previously (Ciriello et al., 2013; Hoadley et al., 2014, 2018), but these studies traditionally used a gene-centric, as opposed to pathway-centric, approach. Identifying relationships of inter- and intra-pathway recurrence, co-occurrence or mutual exclusivity across different types of cancers can help elucidate functionally relevant mechanisms of oncogenic pathway alterations that might inform treatment options.
Here, we worked within the framework of the TCGA PanCanAtlas initiative (Cancer Genome Atlas Research Network et al., 2013) to build a uniformly processed data set and a unified data analysis pipeline aimed at exploring similarities and differences in canonical cancer pathway alterations across 33 cancer types. The focus of this effort is on mitogenic signaling pathways with evidence for functional alterations; other oncogenic processes, such as alterations in DNA repair (Monnat et al., 2017), the spliceosome (Seiler et al., 2017), ubiquitination (Ge et al., 2017a) or metabolic pathways (Peng et al., 2017), as well as the effects of splicing mutations (Jayasinghe et al., 2017), are covered by other efforts of the TCGA PanCanAtlas project.
Results
Data Set
We evaluated all samples in the TCGA PanCanAtlas collection for which the following data types were available: somatic mutations (whole exome sequencing), gene expression levels (RNA-Seq), DNA copy-number alterations (Affymetrix SNP6 arrays), and DNA methylation (Infinium arrays). This resulted in a final set of 9,125 samples from 33 different cancer types (Figure 1A, Table S1). In order to account for molecular or histological subtypes, these cancer types were further stratified into a total of 64 genomically distinct tumor subtypes, as previously defined by the individual TCGA analysis working groups (Figure 1A, Table S1). All genomic data and clinical attributes per sample can be visualized through the cBioPortal for Cancer Genomics at http://cbioportal.org/pancanatlas (Cerami et al., 2012).
Figure 1. TCGA PanCanAtlas Pathways data set and workflow.

(A) Distribution of cancer types in the cohort, including molecular subtypes analyzed. (B) Workflow for pathway curation and analysis. Genes were curated from previous TCGA efforts and the scientific literature. Only genes with evidence for statistically recurrent or known driver alterations in the uniformly processed TCGA PanCanAtlas data set were included in the curated pathway templates. TCGA disease codes and abbreviations: AML: Acute Myeloid Leukemia; ACC:Adrenocortical carcinoma; BRCA:Breast cancer; CESC:Cervical cancer; KICH:Chromophobe renal cell carcinoma; KIRC:Clear cell kidney carcinoma; CRC: colorectal adenocarcinoma; SKCM:Cutaneous melanoma; DLBC:Diffuse large B-cell lymphoma; GBM:Glioblastoma multiforme; HNSC:Head and neck squamous cell carcinoma; LIHC:Liver hepatocellular carcinoma; LGG:Lower Grade Glioma; LUAD:Lung adenocarcinoma; LUSC:Lung squamous cell carcinoma; OV:Ovarian serous cystadenocarcinoma; KIRP:Papillary kidney carcinoma; THCA:Papillary thyroid carcinoma; STAD:Stomach adenocarcinoma; PRAD:Prostate adenocarcinoma; BLCA:Urothelial bladder cancer; UCS:Uterine carcinosarcoma; UCEC:Uterine corpus endometrial carcinoma; ESCA:Esophageal cancer; PCPG:Pheochromocytoma & Paraganglioma; PAAD:Pancreatic ductal adenocarcinoma; MESO:Mesothelioma; UVM:Uveal melanoma; SARC:Sarcoma; CHOL:Cholangiocarcinoma; TGCT:Testicular germ cell cancer; THYM:Thymoma; STES:Stomach and esophageal cancer; EBV:Epstein-Barr Virus; HPV:Human Papillomavirus; DDLPS:Dedifferentiated liposarcoma; LMS:Leiomyosarcoma; MFS/UPS:Myxofibrosarcoma/Undifferentiated Pleomorphic Sarcoma; ESCC:Esophageal Squamous Cell Carcinoma; GS:Genomically Stable; CIN:Chromosomal Instability; MSI:Microsatellite Instability.
Definition of pathways and alterations
We evaluated 10 canonical signaling pathways with frequent genetic alterations, starting with key cancer genes explored in these pathways in previous TCGA publications, and focused on pathway members likely to be cancer drivers (functional contributors) or therapeutic targets. The pathways analyzed are: 1) cell cycle, 2) Hippo signaling, 3) Myc signaling, 4) Notch signaling, 5) oxidative stress response / NRF2, 6) PI-3-Kinase signaling, 7) receptor-tyrosine kinase (RTK) / RAS / MAP-Kinase signaling, 8) TGFβ signaling, 9) P53 and 10) β-catenin / WNT signaling (Figures 2 and S1, Table S2). Alterations in DNA repair pathways, epigenetic modifiers, splicing and other cellular processes frequently altered in cancer were not included, as these primarily provide a background of genomic instability, rather than specifically proliferative potential.
Figure 2. Curated Pathways.

Pathway members and interactions in the ten selected pathways. Genes are altered at different frequencies (color intensity indicates the average frequency of alteration within the entire data set) by oncogenic activations (red) and tumor suppressor inactivations (blue). The types of somatic alteration considered for each gene (copy-number alterations, mutations, fusions or epigenetic silencing) are specified using a set of four vertical dots on the left of each gene symbol. An expanded version including cross-pathways interactions is provided as Figure S1.
We began by compiling and reviewing the full set of cancer-type specific pathway diagrams from the compendium of TCGA manuscripts published between 2008 and 2017 (Brennan et al., 2013; Cancer Genome Atlas Network, 2012a, 2012b, 2015a, 2015b, Cancer Genome Atlas Research Network, 2008, 2013, 2014c, 2014a, 2014b, 2014d; Cancer Genome Atlas Research Network, 2017; Davis et al., 2014; Network, 2010, 2013, Network et al., 2017, 2009), each of which included the pathway genes found to be genetically altered in the individual tumor types. These pathway diagrams are publicly available as pre-defined network templates within the www.PathwayMapper.org visualization tool (Bahceci et al., 2017). By taking the union of pathway members across multiple TCGA studies, we produced a consolidated list of candidate member genes for each of the ten pathways. These were then further curated based on updated literature (including but not limited to the references in Table S2), public pathway databases and expert opinion (Figure 1B).
The selected genes in the ten pathways were then assessed for recurrent alterations within and across different tumor types as follows (Figure 1B): Alterations of pathway members were classified as activating events (usually specific recurrent missense mutations, i.e., hotspot mutations, amplifications or fusions involving oncogenes) or inactivating events (truncating mutations, specific recurrent missense or inframe mutations, deletions, as well as fusions and promoter hypermethylation of tumor suppressor genes). Individual alterations were also scrutinized for two features: statistical recurrence across sets of tumor samples and presumed functional impact. We first assessed statistical recurrence using MutSigCV (Lawrence et al., 2014) for mutations and GISTIC 2.0 (Mermel et al., 2011) for copy-number alterations. In order to identify likely functional variants, we then used recurrence across tumor samples at the residue level (linear and 3D mutational hotspots, (Chang et al., 2016a, 2018; Gao et al., 2017a), see Methods) and prior knowledge about specific variants via the OncoKB knowledge base, which contains information about the oncogenic effects and treatment implications of variants in >400 cancer genes (Chakravarty et al., 2017a). Epigenetic silencing through promoter DNA hypermethylation of tumor suppressor genes was evaluated using the RESET algorithm (see Methods). Gene fusions and structural rearrangements were called from RNA-Seq data using a combination of the STAR-Fusion, EricScript and BreakFast algorithms (Gao et al., 2017b), see Methods), and likely passenger events were filtered out based on OncoKB annotation. Through this process, genes without evidence for recurrent or previously known oncogenic alterations were removed from the preliminary pathway templates. The resulting curated pathway templates and the identified genetic alterations were vetted for functional importance by individual pathway experts or the corresponding TCGA-PanCanAtlas pathway-specific analysis working groups, when applicable (Figure 1B). The pathway member genes and the genetic alterations considered as oncogenic are listed in Table S3, and binary genomic alteration matrices are provided as Table S4 (see Methods).
The resulting comprehensive dataset of different types of alterations across many tumor types form the basis of all subsequent analyses regarding pathways, patterns of co-occurrence and mutual exclusivity, as well as potential therapeutic implications. The simplified pathway diagrams in Figure 2 show the most frequently altered genes in the ten pathways, including alteration frequencies as well as the types of oncogenic alterations identified in each of the genes.
Pathway alteration frequencies per tumor-type
For each tumor type and subtype, we computed the fraction of samples with at least one alteration in each of the 10 signaling pathways (Figure 3). A tumor sample was considered as altered in a given pathway if one or more genes in the pathway contained a recurrent or known driver alteration (as described above). Despite the fact that non-recurrent and not previously known alterations were filtered out as likely passenger events and were not included in the alteration frequencies, the microsatellite instability (MSI) and polymerase ε (POLE) mutant subtypes of gastrointestinal and uterine tumors, which had the highest mutation burden, also had the highest overall frequencies of pathway alterations. This is possibly due to the frequent inactivating mutations introduced by the predominant mutation mechanisms in these tumor types (Boland and Goel, 2010; Rayner et al., 2016)
Figure 3. Pathway alteration frequencies.

Fraction of altered samples per pathway and tumor subtype. Pathways are ordered by decreasing median frequency of alterations. Increasing color intensities reflect higher percentages. Average mutation count, as well as number of unbalanced segments and fraction genome altered (two measures of the degree of copy-number alterations) per cancer subtype are also provided. The MSI and POLE subtypes were grouped in this figure in colorectal, stomach and endometrial cancers.
The RTK-RAS pathway was the signaling pathway with the highest median frequency of alterations (46% of samples) across all cancer types. The tumor subtypes with the highest fraction of alterations in this pathway were (in descending order): melanoma (SKCM, 95% altered), the genomically-stable subtype of colorectal cancer (CRC GS, 88%), Her2-enriched breast cancer (BRCA Her2-enriched, 82%), pancreatic cancer (PAAD, 78%), IDH1-wild-type glioma (LGG IDHwt, 82%), lung adenocarcinoma (LUAD, 74%), and thyroid carcinoma (THCA, 84%). Some tumor types, such as lung squamous cell carcinoma (LUSC), EBV-positive esophagogastric cancer (STES EBV), and non-hypermutated uterine cancer (UCEC CN high and CN low), had high rates of alterations in the PI3K pathway, altered in 68%, 80%, 86%, and 95% of samples, respectively. While cell cycle alterations were common in many tumor types, the pathway was only rarely altered in uveal melanoma (UVM), thymoma (THYM), testicular cancer (TGCT) and acute myeloid leukemia (AML). Alterations in the WNT pathway were the most variable across cancer types. Colorectal cancer had near universal activation of this pathway, while others, such as renal cell carcinomas and breast cancer, had very low frequencies of alteration in genes in this pathway. The oxidative stress response / NRF2 pathway had the lowest overall frequency of alteration (4% of samples), and it was altered most frequently in lung squamous (25% altered) and esophagogastric squamous cell carcinoma (STES ESCC, 23%).
Particularly interesting gene alterations across tumor types were observed in the RTK-RAS pathway. KRAS was the most frequently altered gene (9% across all samples), followed by BRAF (7%) and EGFR (4%) (Figure 4A). KRAS alterations were most common in pancreatic carcinoma (PAAD, 72%), genomically stable colorectal cancer (69%), and lung adenocarcinoma (33%) (Figure 4B). BRAF alterations (predominantly known hotspot mutations) were found in melanoma and thyroid carcinoma, altered in 51% and 62% of samples, respectively. EGFR alterations were predominantly found in glioblastoma (GBM, 50%), low grade glioma IDHwt (52%), HPV-negative head and neck cancer (HNSC HPV−, 13%), lung adenocarcinoma (13%), and esophagogastric squamous carcinoma (14%), while ERBB2 alterations were found most commonly in breast cancer and chromosomally unstable esophagogastric carcinoma (STES CIN 26% altered), as well as cervical carcinoma (CESC 23% altered). While most of the alterations described here were previously reported as functional contributors, we identified relatively rare potentially oncogenic alterations in SOS1 (<1%). SOS1 encodes a guanine-nucleotide-exchange factor (GEF) involved in the activation of Ras proteins. Specific germline mutations in this gene are involved in Noonan syndrome (Lepri et al., 2011), and recurrent somatic mutations in SOS1 were recently identified in otherwise RAS-pathway driver-negative lung adenocarcinoma samples (Campbell et al., 2016). We identified recurrent (hotspot) mutations (A90V/T, N233Y/S) and other known activating mutations (M269I/V, G434R, R552S/K/G/M, E846K) in SOS1 in a total of 1% of lung adenocarcinoma samples, 1% of uterine carcinomas, independent of subtype, and at lower frequencies in several other cancer types (Figure 4C). This finding suggests that rarely altered novel cancer genes can be identified as more tumor samples are profiled. A more detailed analysis of RAS pathway alterations is published separately, including a description of downstream transcriptional changes due to malfunctioning Ras signaling and results suggesting that multiple hits in the Ras pathway are capable of increasing overall Ras activity in RAS wildtype tumors (Way and Greene, 2017).
Figure 4. RTK-RAS pathway alterations.

(A) Altered genes and their functional relationships in the RTK-RAS pathway. Shades of red indicate frequencies of activating events (known or likely activating mutations or fusions, amplifications) and shades of blue indicate frequencies of inactivating events (known or likely inactivating mutations or fusions, homozygous losses). (B) Detailed heatmap of alteration frequencies in members of the RTK-RAS pathway. Only known or likely oncogenic alterations in each gene are considered, as described in Methods. The individual gene alteration frequencies may add up to more than the total for each tumor type, as some tumor samples may have multiple alterations. Color side bars show the fraction of samples affected by each type of somatic alteration (or a combination of them) for each pathway gene. Top color bars show the proportion of different types of alterations for each cancer subtype. (C) Recurrent or known functional mutations in SOS1. Recurrent or known mutations are color-coded by tumor type, all other mutations observed in the gene are considered variants of unknown significance (grey). Three singleton mutations involved in a 3D hotspot are not shown for space reasons: D89A in a UCS sample, A93D in CRC, and S92P in UCEC.
The alteration frequencies of the most commonly altered genes in the other nine pathways are in Figure 5 (full heat maps providing frequencies of alteration for every gene in each pathway are in Figures S2 and S3). In some pathways, the alterations are distributed over many genes (e.g., cell cycle, PI3K), while in others the alterations mainly affect only a few genes (WNT, MYC, NRF2). Several pathways are featured in more detail as separate publications, including: 1) PI3K pathway (Zhang et al., 2017): aberrations in the PI3K pathway were found predominantly as activating events in PIK3CA (less commonly in PIK3CB) and inactivating events in PTEN or PIK3R1 with PIK3CA and PTEN alterations being most commonly found in head and neck cancer, breast cancer, gastrointestinal and gynecological tumors; 2) TGFβ pathway (Korkut et al., 2017): The TGFβ pathway had the highest alteration rate in pancreatic and gastrointestinal cancers, while renal and brain cancers, among others, had almost no alterations in this pathway; and 3) MYC pathway(Schaub et al., 2017): MYC pathway alterations were most common in tumor types with amplification of chromosome 8, which contains MYC, such as breast cancer, ovarian cancer (OV), and others.
Figure 5. The most commonly altered genes in nine signaling pathways.

Oncogenic alteration frequencies per gene and tumor subtype for the most frequently altered genes in each pathway (for RTK-RAS see Figure 4). Red: activating events; blue: inactivating events; frequency of occurrence scale with color intensity. Last row for each pathway: overall alteration frequency of that pathway per tumor type. The individual gene alteration frequencies may add up to more than the total for each tumor type, as some tumor samples have multiple alterations. Color side bars show the fraction of samples affected by each type of somatic alteration (or a combination of them) for each pathway gene. Comprehensive heat maps with alterations for every gene in each pathway are in Figure S2 and Figure S3.
Mutual exclusivity and co-occurrence among pathway alterations
Individual tumors typically have multiple functional alterations affecting more than a single pathway. Some pathways may be the target of more than one alteration per patient or distinct pathways may be co-altered in one tumor. Patterns of mutual exclusivity between alterations across large patient cohorts have been associated either with functional redundancy, indicating that once one occurred and is selected the second will not provide a further selective advantage, or with synthetic lethality, indicating that cells cannot survive with both alterations (Etemadmoghadam et al., 2013; Mina et al., 2017). Patterns of co-occurrence of alterations in many tumor samples, on the other hand, indicate functional synergies and, importantly, may reflect resistance to therapy targeting one of the alterations (Nissan et al., 2014)
To explore significantly co-occurring and mutually exclusive alterations by pathway or by gene, we used the SELECT method (Mina et al., 2017). Among the 416 alterations characterized, we identified 152 pairs of mutually exclusive alterations and 116 pairs of co-occurring alterations (Table S5).
Upon mapping these significant pairs to the affected pathways, we found numerous mutually exclusive pairs within the P53, cell cycle, RAS, and PI3K pathways, suggesting that one alteration is sufficient to functionally alter each of these pathways or that more than one might be disadvantageous (Figure 6A). On the other hand, the Hippo, RTK, and, to a lesser extent, Wnt pathways often had multiple alterations per tumor sample, suggesting co-occurring events that mediate synergistic activation of each pathway (Figure 6A). The SELECT method also identified several significant interdependencies between distinct pathways (Figure S4). For example, activation of RTKs was significantly mutually exclusive with alterations that promote either RAS or PI3K signaling, consistent with RTKs being able to activate either pathway without the need for additional alterations. Notable exceptions were significant co-occurrent alterations in the FGF receptors FGFR2 and FGFR3 and alterations in the PI3K pathway (Figure S4A). The P53 and cell cycle pathways were frequently co-altered. Indeed, numerous alterations affecting Rb-mediated cell cycle control were found co-occurring with TP53 mutations. These included amplification of CCNE1, mutation of CDKN2A, RB1 loss, and amplification of CDK6 and E2F3 (Figure S4B). Interestingly, TP53 mutations were found mutually exclusive with CDKN2A deletion, consistent with the latter invariably affecting both p16, regulating the cell cycle, and ARF, promoting p53-dependent apoptosis. Similarly, MDM2 amplification was significantly mutually exclusive with RB1 and CDKN2A loss. However, MDM2 is proximal to CDK4 in the genome and the two genes were almost always co-amplified. Overall, these results indicate that p53 signaling and cell cycle control are frequently co-altered across multiple tumor types, either through two independent events (e.g., mutations of TP53 and RB1), or through a single alteration that is able to affect both pathways (e.g., CDKN2A deletion).
Figure 6. Co-occurrence and mutual exclusivity of pathway alterations.

A–B) Mutual exclusivity (purple) and co-occurrence (green) of gene alterations within pathways (A) and between pathways (B). Asterisks indicate significant relationships (Q value < 0.1). (C) Co-occurrence and mutual exclusivity of individual gene alterations in the PI3K and NRF2 pathways. (D) Breakdown of the co-occurrence of gene alterations in the PI3K and NRF2 pathways by tumor subtype. Green bars: percentage of samples with alterations in both PI3K and NRF2 pathways. Pathways are sorted by decreasing percentage of samples with alterations in both pathways. (E) Details of gene alterations in select genes (PIK3CA, STK11, NFE2L2 and KEAP1) within and between PI3K and NRF2 pathways, with co-occurrence and mutual exclusivity between alterations. Samples are shown from left to right, and the number of samples in each group (bottom; note: the changing scale, indicated by solid and dashed lines). (F) Pathway representation of the link between the PI3K and NRF2 pathways. (G) Dependencies between single alterations in the RTK and RAS/ERK pathways. Only the 22 alterations with at least one significant interaction (average sum correction, ASC score > 0.24, (Mina et al., 2017)) included. (H) Breakdown of the interactions involving EGFR amplifications and mutations, corresponding to the bounding boxes in panel G. Left side: mutually exclusive interactions. Right side: co-occurring interactions.
The strongest co-occurrence among pathways was found between alterations of the PI3K and NRF2 pathways. Here, gain of function mutations and amplifications of the NFE2L2 gene (encoding for NRF2) significantly co-occurred with PIK3CA amplification and tended to co-occur with PIK3CA mutations and PIK3CB amplification (Figure 6C). Interestingly, even though NFE2L2 amplification was largely mutually exclusive with loss of STK11 (a.k.a. LKB1), the latter significantly co-occurred with loss of function mutations of KEAP1, a negative regulator of NFE2L2. Co-occurring NRF2-PI3K pathway alterations were most frequent in lung tumors (both squamous cell and adenocarcinoma), esophageal carcinomas, head and neck squamous cell carcinoma and uterine carcinoma, independent of subtype (Figure 6D). In these tumor types, alterations in NFE2L2 and KEAP1 were recurrent and almost perfectly mutually exclusive and they frequently co-occurred with PIK3CA activation or STK11 loss (Figure 6E). PI3K pathway activation promotes NRF2 accumulation, which, in turn, mediates metabolic pathways required to sustain cell proliferation and protection from reactive oxidative species (Mitsuishi et al., 2012). NRF2 is however kept in check by inhibitory molecules such as KEAP1 and CUL3 (Figure 6F). The observed co-occurrence between alterations of the PI3K and NRF2 pathways suggests that bypassing these inhibitory mechanisms (either by loss of KEAP1 or CUL3, or by direct over-activation of NFE2L2) is synergistic with active PI3K signaling. Importantly, tumors with these events might depend on NRF2 activity to tolerate PI3K pathway over-activation.
The RTK-RAS pathway contained numerous and some of the most significantly mutually exclusively altered genes, as well as several gene pairs that were significantly concurrently altered (Figure 6G). In particular, alterations promoting EGFR activation (gain of function mutations, fusion, and amplification) were involved in the highest number of significant pairs. EGFR amplification was significantly mutually exclusive with activation of its paralog growth factor receptor Her2 (ERBB2, Figure 6H - Box 1) and with key drivers of the RAS pathway, including oncogenic mutations in BRAF and KRAS as well as loss of NF1 and RASA1 (Figure 6G). Since oncogenic EGFR can be synthetically lethal with mutated KRAS and can mediate resistance to BRAF inhibition in colon cancer and melanoma (Sun et al., 2014; Unni et al., 2015), these results suggest a similar antagonistic interaction with loss of NF1 or RASA1. Overall, alterations of either of these genes were recurrent across multiple tumor types, although almost never in the same patient (Figure 6H - Box 2). On the other hand, in glioblastoma and IDH wild-type low grade glioma, EGFR amplifications were highly co-occurrent with either EGFR mutations or gene fusions (Figure 6H - Box 3) or with focal amplifications of chromosome 4q12, where both KIT and PDGFRA are located (Figure 6H - Box 4). It should be noted that the majority of EGFR and PDGFRA fusions were found coincident with amplifications in these genes, indicating that, potentially, in these cases the same structural variant was detected as both a copy number gain and a fusion (Alaei-Mahabadi et al., 2016). Interestingly, co-amplification of EGFR and PDGFRA has been proposed to be an early event in glioblastoma development, where the two receptors heterodimerize under EGF stimulation and respond to EGFR-inhibitors (Chakravarty et al., 2017b).
Overall, these results provide a map of the cross-talk between pathways and pathway components, reflecting functional interactions and dependencies that could be therapeutically exploited.
Therapeutic actionability
DNA sequencing has been used routinely to inform the choice of targeted therapy in specific cancer types for several years, and some institutions now apply it more broadly to guide clinical trial enrollment for many additional cancer types. A relatively small number of alterations in a subset of tumor types are currently biomarkers for standard care targeted therapies, and a larger number are potential biomarkers for investigational therapies, some with promising clinical results. Using the OncoKB knowledge base of clinically actionable alterations (Chakravarty et al., 2017a), we systematically assessed all alterations in each sample of each cancer type, distinguishing between standard care actionability (Levels 1 or 2) and investigational therapies (Levels 3 and 4). Overall, 52% of tumors had at least one potentially actionable alteration in the ten signaling pathways, and 57% had at least one actionable alteration when including genes outside of these pathways, most notably BRCA1/2 and IDH1/2 (all numbers referenced below include these additional genes). Apart from the Her2-enriched breast cancer samples, most of which have a standard care targeted therapy, melanoma was the tumor type with the highest fraction of tumors with a Level 1 or 2A alteration (46%) (Figure 7A), mainly due to frequent BRAF mutations (Figure 7B), followed by esophagogastric cancers (ERBB2 amplifications). Luminal A breast cancer was the tumor type with the highest frequency of biomarkers with promising investigational data (Level 3A), driven by the high prevalence of PIK3CA, AKT1 and ERBB2 mutations. Several tumor types had frequent mutations that are biomarkers for drug sensitivity in other cancer types (Level 3B), including endometrial cancer, where PIK3CA mutations are common. Uveal melanoma and testicular non-seminoma had the lowest percentage of potentially targetable samples (2.5% and 8.5%, respectively); thymoma, mesothelioma (MESO), and renal clear cell carcinoma (KIRC) also had low frequencies of potentially actionable alterations.
Figure 7. Therapeutic actionability and drug combinations.

(A) Frequencies of clinical actionability by cancer subtype, broken down by level of evidence (Levels 1–4). Samples are classified by the alteration that carries the highest level of evidence. Tumor type–specific samples are analyzed by variants considered actionable, oncogenic but not actionable, or variants of unknown significance (VUS). (B) Frequencies of actionable alterations per gene across cancer subtypes. For genes with different levels for different alterations, multiple rows are shown. Genes are grouped by pathway. Six additional genes not in the ten pathways (BRCA1, BRCA2, ERCC2, IDH1, IDH2, ESR1) are included and taken into account in the overall frequencies. (C) Fraction of samples with a given number of actionable alterations per tumor type. (D) Frequencies of possible drug combinations indicated by the co-alteration of actionable variants in each tumor type for the most frequent drug class combinations.
Thirty percent of tumor samples had two or more potentially targetable alterations (Figure 7C). Among these, the MSI-H and POLE-mutated tumor subtypes had the highest proportion of samples with multiple potentially actionable alterations (not considering the fact that patients with MSI-H tumors are now eligible for immunotherapy). Other tumor types with a high frequency of samples with multiple targetable alterations included non-hypermutated endometrial cancer (64%), colorectal cancer (37%), and breast cancer (28%).
Finally, we searched for candidate drug combinations that could prove effective across different tumor types based on the occurrence of actionable alterations. Hyper-mutant MSI and POLE subtypes had a high fraction of samples of actionable alterations corresponding to various drug combinations. In other tumor subtypes, a combination of CDK4 and MDM2 inhibitors was the most commonly indicated combination (1% total), in particular in dedifferentiated liposarcomas (SARC DDLPS), in which 78% of the cases had co-amplification of the two targets (Figure 7D). By a similar consideration linking actionable alterations of targets to their inhibitors, a combination of HER2 and PI3K inhibitors might be beneficial across multiple tumor types, in particular Her2-enriched breast cancer (17%), uterine carcinosarcoma (UCS, 7%), chromosomally unstable endometrioid carcinoma (UCEC CN high, 7%), and cervical adenocarcinoma (7%) (Figure 7D). Additional candidate combination therapies include PI3K and MEK inhibitors in EBV+ stomach tumors (10%), CDK4 and PI3K inhibitors in glioblastoma multiforme (7%), HER2 and MEK inhibitors in pancreatic cancer (7%), PI3K and RAF inhibitors in melanoma (SKCM, 12%), and IDH and PI3K inhibitors in IDH-mutant low grade glioma (14%) (Figure 7D). While there are many steps from the observation of combinations of genetic alterations to valid combination therapies, this survey indicates the wide landscape of potential tumor-type specific novel therapeutic combinations that can be explored in experimental and clinical contexts.
Discussion
Signaling pathways are somatically altered in cancer at varying frequencies and in varying combinations across different organs and tissues, indicative of complex interplay and pathway cross-talk. Understanding the extent, detailed mechanisms, and co-occurrence of the oncogenic alterations in these pathways is critical for the development of new therapeutic approaches that can improve patient care.
Here we performed a comprehensive characterization of 10 selected signaling pathways across the 33 cancer types analyzed by TCGA. This report constitutes the first pan-cancer exploration that uses a uniformly processed data set and a standardized set of pathway templates, curated through a combination of computational methods and expert review (Figures 1, 2). The results highlight similarities and differences in frequencies of alteration of individual pathways in different cancer types and specific molecular subtypes (Figure 3). They also underscore the potential for discovering previously uncharacterized alterations in pathway genes that occur at low frequencies and might otherwise remain statistically unnoticeable (see SOS1, Figure 4). More generally, even though a small set of critical genes contains a very large fraction of alterations in these pathways (Figures 4, 5), there is a complex interplay of co-occurring and mutually exclusive alterations within and across pathways (Figure 6). In spite of the accumulating wealth of biological knowledge and the accepted oncogenic relevance of these pathways, the number of currently approved biomarkers linked to standard of care therapies remains sparse (Figure 7), but additional drug targets in these pathways will hopefully emerge, and candidates for combination therapy will be explored.
This analysis of targetable alterations only included currently approved therapies or investigational therapies with reported promising results. These predominantly target the RTK-RAS, PI3K, cell cycle and TP53 pathways. While some of these therapies are standard care, many are still investigational, and further testing is required to assess how effective different targeted therapies will be across tumor types and in tumors with different co-mutation spectra. Efforts are underway to develop therapies that target additional pathways, some of which are in clinical trials (Table S6) (Park and Guan, 2013), (Whitfield et al., 2017), (Whitfield et al., 2017), (Aster and Blacklow, 2012), (Takebe et al., 2014), (Buijs et al., 2012), (Sheen et al., 2013), (Pai et al., 2017). In the WNT signaling pathway, for example, two approaches involve drugs targeting PORCN, which is involved in the processing of wingless proteins, and monoclonal antibodies directed at proteins in the Frizzled gene family. While the NRF2 pathway does not have therapies directly targeting any of the pathway members included in this study, alterations in NRF2 pathway members (NFE2L2 and KEAP1) are used as part of the inclusion criteria in the Phase 2 trial of a TORC1/2 inhibitor. Clinical trials involving these pathways exemplify opportunities in precision medicine to associate additional functional alterations as part of inclusion criteria (Table S6). Not all apparently functional mutations, however, represent therapeutic targets, as illustrated, e.g., by the unusually large number of mutations in the MSI-H and POLE-mutated tumor subtypes, of which only a small fraction plausibly dominate oncogenesis.. The observed co-occurrence patterns indicate a potential for combination therapies in some tumor types. The development of targeted combination therapies has been challenging for several reasons, including lack of safety data for combinations, the relatively slow pace of adoption of clinically approved multi-panel gene tests and of clinical trials testing combinations of multiple targeted therapies. However, there is a growing corpus of promising preclinical data indicating such combinations can be effective, such as the combination of MDM2 and CDK4 inhibitors (Laroche-Clary et al., 2017), and the combination of PI3K inhibitors and HER2 inhibitors in HER2-positive / PIK3CA mutant breast cancer patients, even when single gene-therapy approaches (e.g. PI3K monotherapy for PIK3CA mutant tumors) have thus far not had definitive clinical impact.
Although we cover a diverse range of oncogenic processes that spans most tissues and organ systems (Figures 1, 3), we did not include some tumor types in the scope of this TCGA project, including most hematologic cancers. Furthermore, in spite of the relatively large set of samples, this effort is still underpowered to reliably discover tumor-type specific alterations that occur at very low frequencies; these will require further exploration using larger tumor-type specific sample sets.
The original aim and scope of TCGA was to genomically characterize primary, untreated tumors with a basic set of genetic alterations and transcript profiles. As the program is now completed, a future challenge is to expand these analyses to larger sample sets, additional data types, such as metabolite levels, a wider range of epigenetic states, post-translational modifications of proteins, and to investigate metastatic disease and genomic alterations that arise in post-treatment samples, as well as analyzing the role of a wider range of germline alterations and their interplay with somatic events. These new avenues of research will benefit from pathway-level analysis for which the templates and template curation pipelines presented here constitute a promising starting point. Similarly, as the catalogue of clinically actionable alterations continues to grow, understanding intra- and inter-pathway dependencies, such as the ones considered here, will be crucial for the development of effective combination therapies that address or prevent resistance to initially successful single agent therapies.
The curated pathway templates and the uniformly processed data set of alteration calls in 9,125 tumor samples are publicly available (Tables S3 and S4) and can be easily accessed through the PathwayMapper tool (http://pathwaymapper.org/), which allows alteration frequencies to be visually overlaid on the pathway templates; and, via the cBioPortal for Cancer Genomics (http://cbioportal.org/pancanatlas/). This pathway landscape in The Cancer Genome Atlas is meant to provide a valuable resource for clinical oncologists, for cancer researchers and for a broad scientific community interested in cancer precision medicine.
STAR METHODS
Contact for reagent and resource sharing
Further information and requests for resources and reagents should be directed to and will be fulfilled by the Lead Contact, Nikolaus Schultz (schultzcbio.mskcc.org).
Experimental model and subject details
TCGA Project Management has collected necessary human subjects documentation to ensure the project complies with 45-CFR-46 (the “Common Rule”). The program has obtained documentation from every contributing clinical site to verify that IRB approval has been obtained to participate in TCGA. Such documented approval may include one or more of the following:
An IRB-approved protocol with Informed Consent specific to TCGA or a substantially similar program. In the latter case, if the protocol was not TCGA-specific, the clinical site PI provided a further finding from the IRB that the already-approved protocol is sufficient to participate in TCGA.
A TCGA-specific IRB waiver has been granted.
A TCGA-specific letter that the IRB considers one of the exemptions in 45-CFR-46 applicable. The two most common exemptions cited were that the research falls under 46.102(f)(2) or 46.101(b)(4). Both exempt requirements for informed consent, because the received data and material do not contain directly identifiable private information.
A TCGA-specific letter that the IRB does not consider the use of these data and materials to be human subjects research. This was most common for collections in which the donors were deceased.
Sample Selection and Exclusions
We started from the set of 11,276 patients that were included in the final whitelist for the TCGA PanCanAtlas project. We only used samples that had available data across these four genomic platforms: mutations, copy number, DNA methylation and mRNA expression. Our analyses excluded certain molecular platforms that have previously been used in TCGA, such as protein levels from reverse-phase protein arrays (RPPA), microRNA, and lncRNA, as their inclusion would have implied a sharp decrease in the total number of samples with data available across all platforms. Additionally, we excluded samples that had been flagged during pathology review by an expert committee or due to quality control (QC) issues identified by the individual tumor-type or PanCanAtlas analysis working groups. After these filters had been applied, a total of 9,125 patients were used. Samples consisted of primary solid tumors for a large majority of these patients (8602/9125, 94%), plus a small number of blood tumors corresponding to the AML subset (162/9125, 2%) and a small subset of metastatic samples from melanoma patients (361/9125, 4%).
Method Details
Somatic mutation calling
We used version 2.8 of the mutation annotation format (MAF) file provided by the MC3 ("Multi-Center Mutation Calling in Multiple Cancers") group within the TCGA Network (Ellrott et al., 2017). We augmented this file in collaboration with the MC3 group and included all validated mutation calls from the original AML publication.
Pathway Template Curation
We manually curated the gene annotation of the ten selected pathways using the following workflow.
Selection and classification of genes in pathways
Genes were assigned to pathways based on a combined revision of pathway analyses in previous TCGA marker papers published between 2008 and 2017, a review of the scientific literature (including but not limited to the references in Table S2) and expert curation. We applied two different kinds of expert curation. 1) several of the pathways, such as TGF-Beta, Myc and PI3K, had specific analysis working groups. These groups were led by experts in each pathway and published separate manuscripts (Ge et al., 2017b; Korkut et al., 2017; Peng et al., 2017; Schaub et al., 2017; Wang and Xiao, 2017; Way and Greene, 2017). 2) for some of the pathways, we consulted experts from outside of TCGA in order to validate or improve our curated pathway templates (e.g., Frank McCormick for RTK-RAS or Mitchell Frederick for NOTCH). After the lists of pathway members were finalized, each gene was annotated as Tumor Suppressor (TSG) or Oncogene (OG) using OncoKB and prior knowledge from the scientific literature. The final gene lists that were selected for each pathway are provided in Table S3.
Identification of mutational hotspots
The cancer hotspots algorithm that we used identifies recurrent alterations based on a cohort of 24,592 tumor samples (Chang et al., 2016a, 2018). Identification of 3D hotspots was based on recurrence of mutations in the context of spatial neighborhoods in protein structures (Gao et al., 2017a).
Annotation of functionally relevant mutations
We used information about oncogenic and clinically actionable mutations from the OncoKB database (Chakravarty et al., 2017a), which provides information on variants in more than 400 genes. For template curation, we used OncoKB to filter out putative passenger mutations and copy number changes, by discarding somatic alterations that were not labeled as oncogenic, likely oncogenic or predicted oncogenic in the database. For the analysis of therapeutic implications, we used annotations about different levels of clinical actionability as described in the text. These had originally been compiled and curated by OncoKB by combining a diverse set of sources, including FDA-, NCCN- and other guidelines, ClinicalTrials.gov and the scientific literature.
Annotation of functionally relevant CNVs
We applied a two step procedure to determine whether the annotated genes were functionally amplified or deleted in each specific sample. First, a collection of functional relevant amplifications and deletions was curated by integrating the GISTIC 2.0 analysis of the PancanAtlas dataset and the OncoKB database. GISTIC was run separately on each individual tumor type, and then globally on the entire PanCanAtlas dataset, yielding a list of recurrently amplified and deleted regions of interest (ROIs). Default parameters of GISTIC 2.0 were used, with the confidence level set to 0.95. For Genes within ROIs, copy number variants consistent with the role of the gene (amplification of OGs and deletions of TSGs) were retained. Genespecific copy number variants that were labeled as oncogenic, likely oncogenic or predicted oncogenic in OncoKB were also retained, yielding a list of gene-level functional CNVs. As an additional validation step, we individually inspected each of the gene level calls to ensure that there was a good correlation between copy-number status and gene expression, and we excluded calls in genes for which this correlation was non-existent. Thresholded gene-level amplification/deletion values produced by GISTIC were used for pathway analysis, considering only amplifications (+2) and deep deletions (−2). In total, 8,325 gene amplifications and 5,608 deletions were selected, for a total of 13,933 occurrences.
Epigenetic silencing
Curated analysis of CDKN2A promoter hypermethylation
CDKN2A promoter methylation was assessed using Illumina Infinium HumanMethylation450 probe cg13601799 located within Exon 1a of CDKN2A (p16INK4a). We described the selection of this probe for CDKN2A methylation calling in a prior report (Cancer Genome Atlas Research Network, 2012). We introduced a further refinement of DNA methylation calling to avoid artifactual hypermethylation calls due to deep deletion in a gene. In brief, we used Level 1 IDAT files to calculate out-of-band (‘oob’) probe intensities as a surrogate for background intensity, superior to internal negative controls (Triche et al., 2013). cg13601799 is a Type I probe with both methylated (M) and unmethylated (U) versions in the red color channel, and therefore dye bias is not a concern. We compared the foreground intensities (M and U) to the empirical distribution of the background intensities (as measured by the ‘oob’ probes). We first called a sample to be methylated when the methylated (M) signal was higher than the 95th percentile of the background (‘oob’) probes (FDR=5%). As this locus is unmethylated in normal tissues, the U signals are generally higher than the M signal due to the presence of contaminating normal cell types. We required a Log2(foreground/background) log-ratio of 2 or greater for the U probe to ensure that the U signal was derived from tumor cells and not from contaminating normal cells in the case of a tumor with CDKN2A deletion. If Log2(foreground/background) was <2 for U and <0 for M for this probe, then we concluded that this locus was deleted in the tumor cells, and we then denoted these cases as containing "no signal" (Table S4). We identified 681 such samples, and we had GISTIC copy number change data for 627 out of these 681. Out of these 627, 471 were called to have high level deletion for CDKN2A (−2 in GISTIC calls) and 120 had low level deletion for this gene (−1 in GISTIC calls), validating this approach.
Analysis of DNA hypermethylation at the promoters of other tumor suppressor genes
Epigenetic DNA hypermethylation events at promoters of tumor suppressor genes that are associated with decreased gene expression were systematically identified using the RESET bioinformatic tool (Saghafinia, Mina, et al. manuscript in preparation). RESET extracts probes that (i) map to gene promoter regions, (ii) are significantly hypermethylated compared to normal tissue samples, and (iii) are associated with lower transcript levels of the corresponding gene. More specifically, only probes overlapping gene promoter regions extracted from the FANTOM5 cohort of robust promoters are considered (FANTOM Consortium and the RIKEN PMI and CLST (DGT) et al., 2014). The status of a probe (dichotomized in hypermethylated and not hypermethylated) is determined by comparing its beta value to the beta value distribution from adjacent normal tissue samples available in the TCGA sample collection. Finally, RESET determines whether a hypermethylation event is associated with mRNA downregulation by checking whether the mRNA expression of the associated gene is significantly decreased in hypermethylated tumors, compared to the not hypermethylated ones. To avoid biases due to intrinsic gene expression and methylation differences between tumor samples of different origins, we separately applied RESET within each tumor type. For tumor types without normal adjacent samples, the entire set of normal samples from the TCGA cohort was used to define the background beta value distribution.
In this study, we evaluated all tumor suppressors in ten pathway templates (Table S3). We considered as significant only silencing events with a false discovery rate FDR < 10% and a RESET score > 1. The results were further manually curated to exclude cases where the methylation event might be tissue-associated, leading to a list of 15 genes silenced by DNA methylation (Table S7) Consistently with the procedure used for copy number calls, all hypermethylation occurrences for these 15 genes in all tumor samples were retained, even if the silencing event was only significantly recurrent in a subset of tumor types. This pancan set of occurrences was further filtered to increase the likelihood of functional relevance: only the hypermethylation occurrences with a gene expression lower than the 25 percentile of the gene expression distribution from the unmethylated samples were retained as functional and considered in the downstream analyses. The sample-specific epigenetic silencing calls are provided as part of the genomic alteration matrix described below (Table S4).
Gene fusion detection and filtering
TCGA RNA-Seq data were downloaded from Cancer Genomics Hub (CGHub, https://cghub.ucsc.edu) and analyzed using Google cloud. For each sample, the fastq file was mapped to the human genome (build 38) followed by fusion calling using STAR-Fusion (parameters: --annotation –coding-effect), EricScript (default parameters) and BREAKFAST (two different minimum distance cut-offs were used: 5 kb and 100 kb). STAR-Fusion showed higher sensitivity in detecting the fusions reported in previous TCGA studies. Therefore, we focused on the STAR-Fusion output and integrated EricScript and BREAKFAST output in one of the following filtering steps: 1) an exclusion list of genes was curated, including uncharacterized genes, immunoglobin genes, mitochondrial genes, etc. Fusions involving these genes were filtered; 2) Fusions from the same gene or paralogue genes (downloaded from https://github.com/STAR-Fusion/STAR-Fusion_benchmarking_data/tree/master/resources) were filtered; 3) Fusions reported in normal samples were filtered, including the ones from TCGA normal samples, GTEx tissues (reported in STAR-Fusion output), and non-cancer cell study (Babiceanu et al.); 4) For the fusions reported by only STAR-Fusion but not EricScript, a minimum value of FFPM (fusion fragments per million total reads) was required, as suggested by the author; For the fusions reported by both callers, no requirement. 5) Finally, fusions with exactly the same breakpoints in ≥10 samples across different cancer types were removed unless they were reported in previous TCGA studies (e.g., FGFR3-TACC3).
For our pathway analyses, we included only the fusions that (a) involved at least one gene labeled as TSG in one of our pathway templates, or (b) involved at least one gene labeled as OG in one of our pathway templates and such that the fusion is labeled as oncogenic, likely oncogenic or predicted oncogenic in OncoKB. We also included a small set of additional fusions (MAML3-UBTF, NOTCH2-SEC22B and PIK3CA-TBL1XR) based on recent evidence from the literature. Any fusion failing to satisfy at least one of these requirements was excluded from subsequent pathway analyses (although some additional fusions that are clinically actionable based on OncoKB where included in Figure 7 for completeness). The final set of all fusion calls used in our manuscript is provided as Table S8.
Generation of Genomic Alteration Matrices (GAMs)
To integrate all the genomic data in a format readily usable in the downstream analyses, the complexity of mutation and CNV data was summarized into a binary Genomic Alteration Matrix (GAM) representing the occurrence of gene alterations across samples, provided as Table S4. This matrix includes the set of functionally relevant mutations and CNVs selected for each gene and summarized in the onco-query language column provided as part of each pathway template in Table S3. In the alteration level version of this matrix, copy number events and point mutation events affecting the same gene were kept distinct. We also included epigenetic silencing of CDKN2A based on DNA methylation analysis of the gene promoter and the epigenetic silencing of 15 additional genes uncovered by RESET. The resulting table has entries for 9,125 samples and 410 alterations, for a total of 33,355 occurrences. For completeness, in Table S4 we also provide a version of the GAM where alterations are aggregated at the gene level and a third version were alterations are aggregated at the pathway level for the ten pathways in our analysis.
Analysis of conditional selection between alterations
SELECT, a method that infers conditional selection dependencies between alterations from occurrence patterns (Mina et al., 2017), was run on the PancanPathway GAM. The default parameters of the R package implementation were used, with 5,000 random permutations. SELECT analysis was performed at alteration level, considering as separate features the point mutations, copy number changes, silencing and fusion events affecting the same gene. Alteration type, tumor type and tumor subtype were used as covariates in the analysis. Only alterations with more than 5 occurrences were considered (0.05% of the samples). In total, SELECT produced a list of 268 high scoring motifs between 316 alterations.
Pathway-level analysis of conditional selection
The dependency motifs were summarized at pathway level by considering independently (i) the sum of motif scores between each pair of pathways, and (ii) the number of significant motifs. The significance of pathway-level interactions was empirically estimated by comparing the observed sum of motif scores and number of significant motifs to the null distribution obtained by randomly permuting the pathway annotation of the genes. The two metrics were first tested independently, and the two P values were then combined using Stouffer’s method. Combined P values were then corrected with the Benjamini-Hochberg method. Corrected P-values smaller than 0.25 were deemed to be significant.
Curation of Clinical Trials
The list of clinical trials for genes in pathways not represented in OncoKB was manually curated from ClinicalTrials.gov (http://clinicaltrials.gov). Clinical trials with drug compounds targeting pathway members or which described pathway members in their inclusion or exclusion criteria are reported. Focus was given to ongoing clinical trials. A description of data retrieved from particular clinical trials is in the README worksheet of Table S5. If available, PubChem Compound IDs (https://pubchem.ncbi.nlm.nih.gov/) are given for drug compounds.
Quantification and statistical analysis
Quantitative and statistical methods are described above within the context of individual analyses in the Method Details section.
Data and software availability
All the genomics and clinical data used in our analysis is available through the Genomic Data Commons portal of the National Cancer Institute (https://portal.gdc.cancer.gov/).
Data can also be visualized and downloaded using a dedicated section of the cBioPortal for Cancer Genomics (www.cbioportal.org/pancanatlas/).
Additional resources
Pathway diagrams were curated using PathwayMapper (Bahceci et al., 2017), a tool that allows visualization and design of pathway diagrams stylized as in classical TCGA publications. This tool is publicly available online at www.pathwaymapper.org. Our curated templates provided in Table S3 are accessible as pre-defined pathway diagrams that have been incorporated to the PahtwayMapper interface. PathwayMapper also acts as an interactive resource that allows to easily overlay user-inputed alteration frequencies on top of these predefined diagrams.
Supplementary Material
Supplemental Figure S1. Curated pathways including cross-cross pathway interactions. Related to Figure 2. Same as Figure 2, but including cross-pathway interactions.
Supplemental Table S3: Curated pathway templates. Related to Figure 2.
Supplemental Table S4: Genomic Alteration Matrices. Related to Figure 3.
Supplemental Table S5: High-scoring motifs from SELECT analysis. Related to Figure 6.
Supplemental Table S6: Non-OncoKB clinical actionability. Related to Figure 7.
Supplemental Table S7: Summary of results from RESET analysis. Related to STAR Methods.
Supplemental Table S8: Fusion calls. Related to STAR Methods.
Supplemental Figure S2. Cell cycle, WNT, TP53, NRF2 and PI3K pathway alterations. Related to Figure 5. Detailed heatmap of alteration frequencies in members of the Cell cycle, WNT, TP53 and NRF2 pathways. Shades of red indicate activating event (mutation, amplification, activating fusion) and shades of blue indicate inactivating event (mutation, homozygous loss, inactivating fusion, epigenetic silencing). Color side bars show the fraction of samples affected by each type of somatic alteration (or a combination of them) for each pathway gene. Top color bars show the proportion of different types of alterations for each cancer subtype.
Supplemental Figure S3. HIPPO, MYC, TGFβ and NOTCH pathway alterations. Related to Figure 5. Detailed heatmap of alteration frequencies in members of the Hippo, MYC, TGFβ and NOTCH pathways. Shades of red indicate activating event (mutation, amplification, activating fusion) and shades of blue indicate inactivating event (mutation, homozygous loss, inactivating fusion, epigenetic silencing). Color side bars show the fraction of samples affected by each type of somatic alteration (or a combination of them) for each pathway gene. Top color bars show the proportion of different types of alterations for each cancer subtype.
Supplemental Figure S4. Additional results for conditional selection. Related to Figure 6. (A–E) Mutual exclusivity (in purple) and Co-Occurrence (in green) between alterations in (A) PI3K and RTK pathways, (B) Cell cycle and TP53 pathways, (C) TP53 and PI3K pathways, (D) TP53 and HIPPO pathways, and (E) cell cycle and NRF2 pathways.
Supplemental Table S1: List of sample IDs, cancer type and subtype assignments. Related to Figure 1.
Supplemental Table S2: Overview of the 10 pathways selected for study. Related to Figure 2.
Key Resources Table
Highlights.
Alteration map of 10 signaling pathways across 9,125 samples from 33 cancer types
Reusable, curated pathway templates that include a catalogue of driver genes
57% of tumors have at least one potentially actionable alteration in these pathways
Co-occurrence of actionable alterations suggests combination therapy opportunities
Acknowledgments
This work was supported by NIH Grants U54 HG003273, U54 HG003067, U54 HG003079, U24 CA143799, U24 CA143835, U24 CA143840, U24 CA143843, U24 CA143845, U24 CA143848, U24 CA143858, U24 CA143866, U24 CA143867, U24 CA143882, U24 CA143883, U24 CA144025, P30 CA016672.
TCGA PanCanAtlas Declaration of Interest:
Michael Seiler, Peter G. Smith, Ping Zhu, Silvia Buonamici, and Lihua Yu are employees of H3 Biomedicine, Inc. Parts of this work are the subject of a patent application: WO2017040526 titled “Splice variants associated with neomorphic sf3b1 mutants.” Shouyoung Peng, Anant A. Agrawal, James Palacino, and Teng Teng are employees of H3 Biomedicine, Inc. Andrew D. Cherniack, Ashton C. Berger, and Galen F. Gao receive research support from Bayer Pharmaceuticals. Gordon B. Mills serves on the External Scientific Review Board of Astrazeneca. Anil Sood is on the Scientific Advisory Board for Kiyatec and is a shareholder in BioPath. Jonathan S. Serody receives funding from Merck, Inc. Kyle R. Covington is an employee of Castle Biosciences, Inc. Preethi H. Gunaratne is founder, CSO, and shareholder of NextmiRNA Therapeutics. Christina Yau is a part-time employee/consultant at NantOmics. Franz X. Schaub is an employee and shareholder of SEngine Precision Medicine, Inc. Carla Grandori is an employee, founder, and shareholder of SEngine Precision Medicine, Inc. Robert N. Eisenman is a member of the Scientific Advisory Boards and shareholder of Shenogen Pharma and Kronos Bio. Daniel J. Weisenberger is a consultant for Zymo Research Corporation. Joshua M. Stuart is the founder of Five3 Genomics and shareholder of NantOmics. Marc T. Goodman receives research support from Merck, Inc. Andrew J. Gentles is a consultant for Cibermed. Charles M. Perou is an equity stock holder, consultant, and Board of Directors member of BioClassifier and GeneCentric Diagnostics and is also listed as an inventor on patent applications on the Breast PAM50 and Lung Cancer Subtyping assays. Matthew Meyerson receives research support from Bayer Pharmaceuticals; is an equity holder in, consultant for, and Scientific Advisory Board chair for OrigiMed; and is an inventor of a patent for EGFR mutation diagnosis in lung cancer, licensed to LabCorp. Eduard Porta-Pardo is an inventor of a patent for domainXplorer. Han Liang is a shareholder and scientific advisor of Precision Scientific and Eagle Nebula. Da Yang is an inventor on a pending patent application describing the use of antisense oligonucleotides against specific lncRNA sequence as diagnostic and therapeutic tools. Yonghong Xiao was an employee and shareholder of TESARO, Inc. Bin Feng is an employee and shareholder of TESARO, Inc. Carter Van Waes received research funding for the study of IAP inhibitor ASTX660 through a Cooperative Agreement between NIDCD, NIH, and Astex Pharmaceuticals. Raunaq Malhotra is an employee and shareholder of Seven Bridges, Inc. Peter W. Laird serves on the Scientific Advisory Board for AnchorDx. Joel Tepper is a consultant at EMD Serono. Kenneth Wang serves on the Advisory Board for Boston Scientific, Microtech, and Olympus. Andrea Califano is a founder, shareholder, and advisory board member of DarwinHealth, Inc. and a shareholder and advisory board member of Tempus, Inc. Toni K. Choueiri serves as needed on advisory boards for Bristol-Myers Squibb, Merck, and Roche. Lawrence Kwong receives research support from Array BioPharma. Sharon E. Plon is a member of the Scientific Advisory Board for Baylor Genetics Laboratory. Beth Y. Karlan serves on the Advisory Board of Invitae.
Appendix
Secondary author list
Samantha J. Caesar-Johnson, John A. Demchok, Ina Felau, Melpomeni Kasapi, Martin L. Ferguson, Carolyn M. Hutter, Heidi J. Sofia, Roy Tarnuzzer, Zhining Wang, Liming Yang, Jean C. Zenklusen, Jiashan (Julia) Zhang, Sudha Chudamani, Jia Liu, Laxmi Lolla, Rashi Naresh, Todd Pihl, Qiang Sun, Yunhu Wan, Ye Wu, Juok Cho, Timothy DeFreitas, Scott Frazer, Nils Gehlenborg, Gad Getz, David I. Heiman, Jaegil Kim, Michael S. Lawrence, Pei Lin, Sam Meier, Michael S. Noble, Gordon Saksena, Doug Voet, Hailei Zhang, Brady Bernard, Nyasha Chambwe, Varsha Dhankani, Theo Knijnenburg, Roger Kramer, Kalle Leinonen, Yuexin Liu, Michael Miller, Sheila Reynolds, Ilya Shmulevich, Vesteinn Thorsson, Wei Zhang, Rehan Akbani, Bradley M. Broom, Apurva M. Hegde, Zhenlin Ju, Rupa S. Kanchi, Anil Korkut, Jun Li, Han Liang, Shiyun Ling, Wenbin Liu, Yiling Lu, Gordon B. Mills, Kwok-Shing Ng, Arvind Rao, Michael Ryan, Jing Wang, John N. Weinstein, Jiexin Zhang, Adam Abeshouse, Joshua Armenia, Debyani Chakravarty, Walid K. Chatila, Ino de Bruijn, Jianjiong Gao, Benjamin E. Gross, Zachary J. Heins, Ritika Kundra, Konnor La, Marc Ladanyi, Augustin Luna, Moriah G. Nissan, Angelica Ochoa, Sarah M. Phillips, Ed Reznik, Francisco Sanchez-Vega, Chris Sander, Nikolaus Schultz, Robert Sheridan, S. Onur Sumer, Yichao Sun, Barry S. Taylor, Jioajiao Wang, Hongxin Zhang, Pavana Anur, Myron Peto, Paul Spellman, Christopher Benz, Joshua M. Stuart, Christopher K. Wong, Christina Yau, D. Neil Hayes, Joel S. Parker, Matthew D. Wilkerson, Adrian Ally, Miruna Balasundaram, Reanne Bowlby, Denise Brooks, Rebecca Carlsen, Eric Chuah, Noreen Dhalla, Robert Holt, Steven J.M. Jones, Katayoon Kasaian, Darlene Lee, Yussanne Ma, Marco A. Marra, Michael Mayo, Richard A. Moore, Andrew J. Mungall, Karen Mungall, A. Gordon Robertson, Sara Sadeghi, Jacqueline E. Schein, Payal Sipahimalani, Angela Tam, Nina Thiessen, Kane Tse, Tina Wong, Ashton C. Berger, Rameen Beroukhim, Andrew D. Cherniack, Carrie Cibulskis, Stacey B. Gabriel, Galen F. Gao, Gavin Ha, Matthew Meyerson, Steven E. Schumacher, Juliann Shih, Melanie H. Kucherlapati, Raju S. Kucherlapati, Stephen Baylin, Leslie Cope, Ludmila Danilova, Moiz S. Bootwalla, Phillip H. Lai, Dennis T. Maglinte, David J. Van Den Berg, Daniel J. Weisenberger, J. Todd Auman, Saianand Balu, Tom Bodenheimer, Cheng Fan, Katherine A. Hoadley, Alan P. Hoyle, Stuart R. Jefferys, Corbin D. Jones, Shaowu Meng, Piotr A. Mieczkowski, Lisle E. Mose, Amy H. Perou, Charles M. Perou, Jeffrey Roach, Yan Shi, Janae V. Simons, Tara Skelly, Matthew G. Soloway, Donghui Tan, Umadevi Veluvolu, Huihui Fan, Toshinori Hinoue, Peter W. Laird, Hui Shen, Wanding Zhou, Michelle Bellair, Kyle Chang, Kyle Covington, Chad J. Creighton, Huyen Dinh, HarshaVardhan Doddapaneni, Lawrence A. Donehower, Jennifer Drummond, Richard A. Gibbs, Robert Glenn, Walker Hale, Yi Han, Jianhong Hu, Viktoriya Korchina, Sandra Lee, Lora Lewis, Wei Li, Xiuping Liu, Margaret Morgan, Donna Morton, Donna Muzny, Jireh Santibanez, Margi Sheth, Eve Shinbrot, Linghua Wang, Min Wang, David A. Wheeler, Liu Xi, Fengmei Zhao, Julian Hess, Elizabeth L. Appelbaum, Matthew Bailey, Matthew G. Cordes, Li Ding, Catrina C. Fronick, Lucinda A. Fulton, Robert S. Fulton, Cyriac Kandoth, Elaine R. Mardis, Michael D. McLellan, Christopher A. Miller, Heather K. Schmidt, Richard K. Wilson, Daniel Crain, Erin Curley, Johanna Gardner, Kevin Lau, David Mallery, Scott Morris, Joseph Paulauskis, Robert Penny, Candace Shelton, Troy Shelton, Mark Sherman, Eric Thompson, Peggy Yena, Jay Bowen, Julie M. Gastier-Foster, Mark Gerken, Kristen M. Leraas, Tara M. Lichtenberg, Nilsa C. Ramirez, Lisa Wise, Erik Zmuda, Niall Corcoran, Tony Costello, Christopher Hovens, Andre L. Carvalho, Ana C. de Carvalho, José H. Fregnani, Adhemar Longatto-Filho, Rui M. Reis, Cristovam Scapulatempo-Neto, Henrique C.S. Silveira, Daniel O. Vidal, Andrew Burnette, Jennifer Eschbacher, Beth Hermes, Ardene Noss, Rosy Singh, Matthew L. Anderson, Patricia D. Castro, Michael Ittmann, David Huntsman, Bernard Kohl, Xuan Le, Richard Thorp, Chris Andry, Elizabeth R. Duffy, Vladimir Lyadov, Oxana Paklina, Galiya Setdikova, Alexey Shabunin, Mikhail Tavobilov, Christopher McPherson, Ronald Warnick, Ross Berkowitz, Daniel Cramer, Colleen Feltmate, Neil Horowitz, Adam Kibel, Michael Muto, Chandrajit P. Raut, Andrei Malykh, Jill S. Barnholtz- Sloan, Wendi Barrett, Karen Devine, Jordonna Fulop, Quinn T. Ostrom, Kristen Shimmel, Yingli Wolinsky, Andrew E. Sloan, Agostino De Rose, Felice Giuliante, Marc Goodman, Beth Y. Karlan, Curt H. Hagedorn, John Eckman, Jodi Harr, Jerome Myers, Kelinda Tucker, Leigh Anne Zach, Brenda Deyarmin, Hai Hu, Leonid Kvecher, Caroline Larson, Richard J. Mural, Stella Somiari, Ales Vicha, Tomas Zelinka, Joseph Bennett, Mary Iacocca, Brenda Rabeno, Patricia Swanson, Mathieu Latour, Louis Lacombe, Bernard Têtu, Alain Bergeron, Mary McGraw, Susan M. Staugaitis, John Chabot, Hanina Hibshoosh, Antonia Sepulveda, Tao Su, Timothy Wang, Olga Potapova, Olga Voronina, Laurence Desjardins, Odette Mariani, Sergio Roman-Roman, Xavier Sastre, Marc-Henri Stern, Feixiong Cheng, Sabina Signoretti, Andrew Berchuck, Darell Bigner, Eric Lipp, Jeffrey Marks, Shannon McCall, Roger McLendon, Angeles Secord, Alexis Sharp, Madhusmita Behera, Daniel J. Brat, Amy Chen, Keith Delman, Seth Force, Fadlo Khuri, Kelly Magliocca, Shishir Maithel, Jeffrey J. Olson, Taofeek Owonikoko, Alan Pickens, Suresh Ramalingam, Dong M. Shin, Gabriel Sica, Erwin G. Van Meir, Hongzheng Zhang, Wil Eijckenboom, Ad Gillis, Esther Korpershoek, Leendert Looijenga, Wolter Oosterhuis, Hans Stoop, Kim E. van Kessel, Ellen C. Zwarthoff, Chiara Calatozzolo, Lucia Cuppini, Stefania Cuzzubbo, Francesco DiMeco, Gaetano Finocchiaro, Luca Mattei, Alessandro Perin, Bianca Pollo, Chu Chen, John Houck, Pawadee Lohavanichbutr, Arndt Hartmann, Christine Stoehr, Robert Stoehr, Helge Taubert, Sven Wach, Bernd Wullich, Witold Kycler, Dawid Murawa, Maciej Wiznerowicz, Ki Chung, W. Jeffrey Edenfield, Julie Martin, Eric Baudin, Glenn Bubley, Raphael Bueno, Assunta De Rienzo, William G. Richards, Steven Kalkanis, Tom Mikkelsen, Houtan Noushmehr, Lisa Scarpace, Nicolas Girard, Marta Aymerich, Elias Campo, Eva Giné, Armando López Guillermo, Nguyen Van Bang, Phan Thi Hanh, Bui Duc Phu, Yufang Tang, Howard Colman, Kimberley Evason, Peter R. Dottino, John A. Martignetti, Hani Gabra, Hartmut Juhl, Teniola Akeredolu, Serghei Stepa, Dave Hoon, Keunsoo Ahn, Koo Jeong Kang, Felix Beuschlein, Anne Breggia, Michael Birrer, Debra Bell, Mitesh Borad, Alan H. Bryce, Erik Castle, Vishal Chandan, John Cheville, John A. Copland, Michael Farnell, Thomas Flotte, Nasra Giama, Thai Ho, Michael Kendrick, Jean-Pierre Kocher, Karla Kopp, Catherine Moser, David Nagorney, Daniel O’Brien, Brian Patrick O’Neill, Tushar Patel, Gloria Petersen, Florencia Que, Michael Rivera, Lewis Roberts, Robert Smallridge, Thomas Smyrk, Melissa Stanton, R. Houston Thompson, Michael Torbenson, Ju Dong Yang, Lizhi Zhang, Fadi Brimo, Jaffer A. Ajani, Ana Maria Angulo Gonzalez, Carmen Behrens, Jolanta Bondaruk, Russell Broaddus, Bogdan Czerniak, Bita Esmaeli, Junya Fujimoto, Jeffrey Gershenwald, Charles Guo, Alexander J. Lazar, Christopher Logothetis, Funda Meric-Bernstam, Cesar Moran, Lois Ramondetta, David Rice, Anil Sood, Pheroze Tamboli, Timothy Thompson, Patricia Troncoso, Anne Tsao, Ignacio Wistuba, Candace Carter, Lauren Haydu, Peter Hersey, Valerie Jakrot, Hojabr Kakavand, Richard Kefford, Kenneth Lee, Georgina Long, Graham Mann, Michael Quinn, Robyn Saw, Richard Scolyer, Kerwin Shannon, Andrew Spillane, Jonathan Stretch, Maria Synott, John Thompson, James Wilmott, Hikmat Al-Ahmadie, Timothy A. Chan, Ronald Ghossein, Anuradha Gopalan, Douglas A. Levine, Victor Reuter, Samuel Singer, Bhuvanesh Singh, Nguyen Viet Tien, Thomas Broudy, Cyrus Mirsaidi, Praveen Nair, Paul Drwiega, Judy Miller, Jennifer Smith, Howard Zaren, Joong-Won Park, Nguyen Phi Hung, Electron Kebebew, W. Marston Linehan, Adam R. Metwalli, Karel Pacak, Peter A. Pinto, Mark Schiffman, Laura S. Schmidt, Cathy D. Vocke, Nicolas Wentzensen, Robert Worrell, Hannah Yang, Marc Moncrieff, Chandra Goparaju, Jonathan Melamed, Harvey Pass, Natalia Botnariuc, Irina Caraman, Mircea Cernat, Inga Chemencedji, Adrian Clipca, Serghei Doruc, Ghenadie Gorincioi, Sergiu Mura, Maria Pirtac, Irina Stancul, Diana Tcaciuc, Monique Albert, Iakovina Alexopoulou, Angel Arnaout, John Bartlett, Jay Engel, Sebastien Gilbert, Jeremy Parfitt, Harman Sekhon, George Thomas, Doris M. Rassl, Robert C. Rintoul, Carlo Bifulco, Raina Tamakawa, Walter Urba, Nicholas Hayward, Henri Timmers, Anna Antenucci, Francesco Facciolo, Gianluca Grazi, Mirella Marino, Roberta Merola, Ronald de Krijger, Anne-Paule Gimenez-Roqueplo, Alain Piché, Simone Chevalier, Ginette McKercher, Kivanc Birsoy, Gene Barnett, Cathy Brewer, Carol Farver, Theresa Naska, Nathan A. Pennell, Daniel Raymond, Cathy Schilero, Kathy Smolenski, Felicia Williams, Carl Morrison, Jeffrey A. Borgia, Michael J. Liptay, Mark Pool, Christopher W. Seder, Kerstin Junker, Larsson Omberg, Mikhail Dinkin, George Manikhas, Domenico Alvaro, Maria Consiglia Bragazzi, Vincenzo Cardinale, Guido Carpino, Eugenio Gaudio, David Chesla, Sandra Cottingham, Michael Dubina, Fedor Moiseenko, Renumathy Dhanasekaran, Karl-Friedrich Becker, Klaus- Peter Janssen, Julia Slotta-Huspenina, Mohamed H. Abdel-Rahman, Dina Aziz, Sue Bell, Colleen M. Cebulla, Amy Davis, Rebecca Duell, J. Bradley Elder, Joe Hilty, Bahavna Kumar, James Lang, Norman L. Lehman, Randy Mandt, Phuong Nguyen, Robert Pilarski, Karan Rai, Lynn Schoenfield, Kelly Senecal, Paul Wakely, Paul Hansen, Ronald Lechan, James Powers, Arthur Tischler, William E. Grizzle, Katherine C. Sexton, Alison Kastl, Joel Henderson, Sima Porten, Jens Waldmann, Martin Fassnacht, Sylvia L. Asa, Dirk Schadendorf, Marta Couce, Markus Graefen, Hartwig Huland, Guido Sauter, Thorsten Schlomm, Ronald Simon, Pierre Tennstedt, Oluwole Olabode, Mark Nelson, Oliver Bathe, Peter R. Carroll, June M. Chan, Philip Disaia, Pat Glenn, Robin K. Kelley, Charles N. Landen, Joanna Phillips, Michael Prados, Jeffry Simko, Karen Smith-McCune, Scott VandenBerg, Kevin Roggin, Ashley Fehrenbach, Ady Kendler, Suzanne Sifri, Ruth Steele, Antonio Jimeno, Francis Carey, Ian Forgie, Massimo Mannelli, Michael Carney, Brenda Hernandez, Benito Campos, Christel Herold-Mende, Christin Jungk, Andreas Unterberg, Andreas von Deimling, Aaron Bossler, Joseph Galbraith, Laura Jacobus, Michael Knudson, Tina Knutson, Deqin Ma, Mohammed Milhem, Rita Sigmund, Andrew K. Godwin, Rashna Madan, Howard G. Rosenthal, Clement Adebamowo, Sally N. Adebamowo, Alex Boussioutas, David Beer, Thomas Giordano, Anne-Marie Mes- Masson, Fred Saad, Therese Bocklage, Lisa Landrum, Robert Mannel, Kathleen Moore, Katherine Moxley, Russel Postier, Joan Walker, Rosemary Zuna, Michael Feldman, Federico Valdivieso, Rajiv Dhir, James Luketich, Edna M. Mora Pinero, Mario Quintero-Aguilo, Carlos Gilberto Carlotti, Jr., Jose Sebastião Dos Santos, Rafael Kemp, Ajith Sankarankuty, Daniela Tirapelli, James Catto, Kathy Agnew, Elizabeth Swisher, Jenette Creaney, Bruce Robinson, Carl Simon Shelley, Eryn M. Godwin, Sara Kendall, Cassaundra Shipman, Carol Bradford, Thomas Carey, Andrea Haddad, Jeffey Moyer, Lisa Peterson, Mark Prince, Laura Rozek, Gregory Wolf, Rayleen Bowman, Kwun M. Fong, Ian Yang, Robert Korst, W. Kimryn Rathmell, J. Leigh Fantacone-Campbell, Jeffrey A. Hooke, Albert J. Kovatich, Craig D. Shriver, John DiPersio, Bettina Drake, Ramaswamy Govindan, Sharon Heath, Timothy Ley, Brian Van Tine, Peter Westervelt, Mark A. Rubin, Jung Il Lee, Natália D. Aredes, and Armaz Mariamidze
Footnotes
Publisher's Disclaimer: This is a PDF file of an unedited manuscript that has been accepted for publication. As a service to our customers we are providing this early version of the manuscript. The manuscript will undergo copyediting, typesetting, and review of the resulting proof before it is published in its final citable form. Please note that during the production process errors may be discovered which could affect the content, and all legal disclaimers that apply to the journal pertain.
Authors contributions
F.S.-V, M.M., J.A., W.K.C., A.L., E. V. A., A. D. C., G. C., C. S. and N. S. designed the study; F.S.-V, M.M., J.A., W.K.C., A.L., J.G., K.L., S.D., H.S.K., Z.H., A. O., B. G., J. G., H. Z., R. K., I. B., L. D., U. D., C.K., Q.G., M.H.B,W.-W.L., S.M.F., I.S., L.D., A. D. C., G. C., and N. S. collected and annotated the data; F.S.-V, M.M., J.A., W.K.C., A.L.,D.C., W.Z., H.S., P.W.L., F.D., D.L.L., S.S., A. H. B., T. G. B., A. J. L., G. H., T. G., L. K., G. M., C. H., A. D. T., M. J. F., F. M., M. M., E.V.A, A.D.C., G. C., C. S. and N. S. analyzed and interpreted the data. The Cancer Genome Atlas Research Network was responsible for the project administration. F.S.-V, M.M., J.A., W.K.C., A.L., E. V. A., A. D. C., G. C., C. S. and N. S. drafted the manuscript. All authors participated in editing or reviewing of the manuscript, and all authors approved the submitted manuscript.
References
- Alaei-Mahabadi B, Bhadury J, Karlsson JW, Nilsson JA, Larsson E. Global analysis of somatic structural genomic alterations and their impact on gene expression in diverse human cancers. Proc. Natl. Acad. Sci. United States Am. 2016;113:13768–13773. doi: 10.1073/pnas.1606220113. [DOI] [PMC free article] [PubMed] [Google Scholar]
- Alexandrov LB, Nik-Zainal S, Wedge DC, Aparicio SAJR, Behjati S, Biankin AV, Bignell GR, Bolli N, Borg A, Børresen-Dale A-L, et al. Signatures of mutational processes in human cancer. Nature. 2013;500:415–421. doi: 10.1038/nature12477. [DOI] [PMC free article] [PubMed] [Google Scholar]
- Aster JC, Blacklow SC. Targeting the Notch pathway: twists and turns on the road to rational therapeutics. J. Clin. Oncol. Off. J. Am. Soc. Clin. Oncol. 2012;30:2418–2420. doi: 10.1200/JCO.2012.42.0992. [DOI] [PubMed] [Google Scholar]
- Bahceci I, Dogrusoz U, La KC, Babur Ö, Gao J, Schultz N. PathwayMapper: a collaborative visual web editor for cancer pathways and genomic data. Bioinforma. 2017;33:2238–2240. doi: 10.1093/bioinformatics/btx149. [DOI] [PMC free article] [PubMed] [Google Scholar]
- Bailey MH, Tokheim C, Porta-Pardo E, Sengupta S, Betrand D, Weerasinghe A, Colaprico A, Kim J, Wendl MC, Reardon B, et al. Comprehensive Discovery and Characterization of Driver Genes and Mutations in Human Cancers. Cell 2017 [Google Scholar]
- Benelli M, Pescucci C, Marseglia G, Severgnini M, Torricelli F, Magi A. Discovering chimeric transcripts in paired-end RNA-seq data by using EricScript. Bioinformatics. 2012;28 doi: 10.1093/bioinformatics/bts617. [DOI] [PubMed] [Google Scholar]
- Boland CR, Goel A. Microsatellite instability in colorectal cancer. Gastroenterology. 2010;138:2073–2087.e3. doi: 10.1053/j.gastro.2009.12.064. [DOI] [PMC free article] [PubMed] [Google Scholar]
- Brennan CW, Verhaak RGW, McKenna A, Campos B, Noushmehr H, Salama SR, Zheng S, Chakravarty D, Sanborn JZ, Berman SH, et al. The somatic genomic landscape of glioblastoma. Cell. 2013;155:462–477. doi: 10.1016/j.cell.2013.09.034. [DOI] [PMC free article] [PubMed] [Google Scholar]
- Buijs JT, Stayrook KR, Guise TA. The role of TGF-β in bone metastasis: novel therapeutic perspectives. BoneKEy Reports. 2012;1:96. doi: 10.1038/bonekey.2012.96. [DOI] [PMC free article] [PubMed] [Google Scholar]
- Campbell JD, Alexandrov A, Kim J, Wala J, Berger AH, Pedamallu CS, Shukla SA, Guo G, Brooks AN, Murray BA, et al. Distinct patterns of somatic genome alterations in lung adenocarcinomas and squamous cell carcinomas. Nat. Genet. 2016;48:607–616. doi: 10.1038/ng.3564. [DOI] [PMC free article] [PubMed] [Google Scholar]
- Cancer Genome Atlas Network. Comprehensive molecular characterization of human colon and rectal cancer. Nature. 2012a;487:330–337. doi: 10.1038/nature11252. [DOI] [PMC free article] [PubMed] [Google Scholar]
- Cancer Genome Atlas Network. Comprehensive molecular portraits of human breast tumours. Nature. 2012b;490:61–70. doi: 10.1038/nature11412. [DOI] [PMC free article] [PubMed] [Google Scholar]
- Cancer Genome Atlas Network. Comprehensive genomic characterization of head and neck squamous cell carcinomas. Nature. 2015a;517:576–582. doi: 10.1038/nature14129. [DOI] [PMC free article] [PubMed] [Google Scholar]
- Cancer Genome Atlas Network. Genomic Classification of Cutaneous Melanoma. Cell. 2015b;161:1681–1696. doi: 10.1016/j.cell.2015.05.044. [DOI] [PMC free article] [PubMed] [Google Scholar]
- Cancer Genome Atlas Research Network. Comprehensive genomic characterization defines human glioblastoma genes and core pathways. Nature. 2008;455:1061–1068. doi: 10.1038/nature07385. [DOI] [PMC free article] [PubMed] [Google Scholar]
- Cancer Genome Atlas Research Network. Comprehensive genomic characterization of squamous cell lung cancers. Nature. 2012;489:519–525. doi: 10.1038/nature11404. [DOI] [PMC free article] [PubMed] [Google Scholar]
- Cancer Genome Atlas Research Network. Comprehensive molecular characterization of clear cell renal cell carcinoma. Nature. 2013;499:43–49. doi: 10.1038/nature12222. [DOI] [PMC free article] [PubMed] [Google Scholar]
- Cancer Genome Atlas Research Network. Comprehensive molecular characterization of gastric adenocarcinoma. Nature. 2014c;513:202–209. doi: 10.1038/nature13480. [DOI] [PMC free article] [PubMed] [Google Scholar]
- Cancer Genome Atlas Research Network. Comprehensive molecular characterization of urothelial bladder carcinoma. Nature. 2014a;507:315–322. doi: 10.1038/nature12965. [DOI] [PMC free article] [PubMed] [Google Scholar]
- Cancer Genome Atlas Research Network. Comprehensive molecular profiling of lung adenocarcinoma. Nature. 2014b;511:543–550. doi: 10.1038/nature13385. [DOI] [PMC free article] [PubMed] [Google Scholar]
- Cancer Genome Atlas Research Network. Integrated genomic characterization of papillary thyroid carcinoma. Cell. 2014d;159:676–690. doi: 10.1016/j.cell.2014.09.050. [DOI] [PMC free article] [PubMed] [Google Scholar]
- Cancer Genome Atlas Research Network. Weinstein JN, Collisson EA, Mills GB, Shaw KRM, Ozenberger BA, Ellrott K, Shmulevich I, Sander C, Stuart JM. The Cancer Genome Atlas Pan-Cancer analysis project. Nat. Genet. 2013;45:1113–1120. doi: 10.1038/ng.2764. [DOI] [PMC free article] [PubMed] [Google Scholar]
- Cancer Genome Atlas Research Network. Electronic address: wheeler@bcm.edu, and Cancer Genome Atlas Research Network. Comprehensive and Integrative Genomic Characterization of Hepatocellular Carcinoma. Cell. 2017;169:1327–1341. e23. doi: 10.1016/j.cell.2017.05.046. [DOI] [PMC free article] [PubMed] [Google Scholar]
- Cerami E, Gao J, Dogrusoz U, Gross BE, Sumer SO, Aksoy BA, Jacobsen A, Byrne CJ, Heuer ML, Larsson E, et al. The cBio cancer genomics portal: an open platform for exploring multidimensional cancer genomics data. Cancer Discov. 2012;2:401–404. doi: 10.1158/2159-8290.CD-12-0095. [DOI] [PMC free article] [PubMed] [Google Scholar]
- Cerami EG, Gross BE, Demir E, Rodchenkov I, Babur O, Anwar N, Schultz N, Bader GD, Sander C. Pathway Commons, a web resource for biological pathway data. Nucleic Acids Res. 2011;39:D685–D690. doi: 10.1093/nar/gkq1039. [DOI] [PMC free article] [PubMed] [Google Scholar]
- Chakravarty D, Gao J, Phillips SM, Kundra R, Zhang H, Wang J, Rudolph JE, Yaeger R, Soumerai T, Nissan MH, et al. OncoKB: A Precision Oncology Knowledge Base. JCO Precis. Oncol. 2017a;2017 doi: 10.1200/PO.17.00011. [DOI] [PMC free article] [PubMed] [Google Scholar]
- Chakravarty D, Pedraza AM, Cotari J, Liu AH, Punko D, Kokroo A, Huse JT, Altan-Bonnet G, Brennan CW. EGFR and PDGFRA co-expression and heterodimerization in glioblastoma tumor sphere lines. Sci. Reports. 2017b;7:9043. doi: 10.1038/s41598-017-08940-9. [DOI] [PMC free article] [PubMed] [Google Scholar]
- Chang MT, Asthana S, Gao SP, Lee BH, Chapman JS, Kandoth C, Gao J, Socci ND, Solit DB, Olshen AB, et al. Identifying recurrent mutations in cancer reveals widespread lineage diversity and mutational specificity. Nat. Biotechnol. 2016a;34:155–163. doi: 10.1038/nbt.3391. [DOI] [PMC free article] [PubMed] [Google Scholar]
- Chang MT, Asthana S, Gao SP, Lee BH, Chapman JS, Kandoth C, Gao J, Socci ND, Solit DB, Olshen AB, et al. Identifying recurrent mutations in cancer reveals widespread lineage diversity and mutational specificity. Nat Biotechnol. 2016b;34:155–163. doi: 10.1038/nbt.3391. [DOI] [PMC free article] [PubMed] [Google Scholar]
- Chang MT, Bhattarai TS, Schram AM, Bielski CM, Donoghue MTA, Jonsson P, Chakravarty D, Phillips S, Kandoth C, Penson A, et al. Accelerating Discovery of Functional Mutant Alleles in Cancer. Cancer Discov. 2018;8:174–183. doi: 10.1158/2159-8290.CD-17-0321. [DOI] [PMC free article] [PubMed] [Google Scholar]
- Ciriello G, Miller ML, Aksoy BA, Senbabaoglu Y, Schultz N, Sander C. Emerging landscape of oncogenic signatures across human cancers. Nat. Genet. 2013;45:1127–1133. doi: 10.1038/ng.2762. [DOI] [PMC free article] [PubMed] [Google Scholar]
- Davis CF, Ricketts CJ, Wang M, Yang L, Cherniack AD, Shen H, Buhay C, Kang H, Kim SC, Fahey CC, et al. The Somatic Genomic Landscape of Chromophobe Renal Cell Carcinoma. Cancer Cell. 2014;26 doi: 10.1016/j.ccr.2014.07.014. [DOI] [PMC free article] [PubMed] [Google Scholar]
- Ellrott K, Covington KR, Kandoth C, Saksena G, McLellan M, Bailey M, Sofia H, Hutter C MC3 Working Group, and TCGA Network. Automating Somatic Mutation calling for Ten Thousand Tumor Exomes. Cell Syst 2017 [Google Scholar]
- Etemadmoghadam D, Weir BA, Au-Yeung G, Alsop K, Mitchell G, George J, Australian Ovarian Cancer Study Group. Davis S, D’Andrea AD, Simpson K, et al. Synthetic lethality between CCNE1 amplification and loss of BRCA1. Proc. Natl. Acad. Sci. United States Am. 2013;110:19489–19494. doi: 10.1073/pnas.1314302110. [DOI] [PMC free article] [PubMed] [Google Scholar]
- FANTOM Consortium and the RIKEN PMI and CLST (DGT) Forrest ARR, Kawaji H, Rehli M, Baillie JK, de Hoon MJL, Haberle V, Lassmann T, Kulakovskiy IV, Lizio M, et al. A promoter-level mammalian expression atlas. Nature. 2014;507:462–470. doi: 10.1038/nature13182. [DOI] [PMC free article] [PubMed] [Google Scholar]
- Gao J, Ciriello G, Sander C, Schultz N. Collection, integration and analysis of cancer genomic profiles: from data to insight. Curr. Opin. Genet. & Dev. 2014;24:92–98. doi: 10.1016/j.gde.2013.12.003. [DOI] [PMC free article] [PubMed] [Google Scholar]
- Gao J, Chang MT, Johnsen HC, Gao SP, Sylvester BE, Sumer SO, Zhang H, Solit DB, Taylor BS, Schultz N, et al. 3D clusters of somatic mutations in cancer reveal numerous rare mutations as functional targets. Genome Med. 2017a;9:4. doi: 10.1186/s13073-016-0393-x. [DOI] [PMC free article] [PubMed] [Google Scholar]
- Gao Q, Liang W-W, Foltz SM, Mutharasu G, Jayasinghe R, Cao S, Liao W-W, Reynolds SM, Wyczalkowski MA, Yao L, et al. Driver Fusions and Their Implications in the Development and Treatment of Human Cancers. Cell Reports. 2017b doi: 10.1016/j.celrep.2018.03.050. [DOI] [PMC free article] [PubMed] [Google Scholar]
- Garraway LA, Lander ES. Lessons from the cancer genome. Cell. 2013;153:17–37. doi: 10.1016/j.cell.2013.03.002. [DOI] [PubMed] [Google Scholar]
- Ge Z, Leighton JS, Wang Y, Peng X, Chen Z, Sun Y, Li J, Liu J, Shriver CD, Hu H, et al. Integrated Pan-Cancer Analysis of the Ubiquitin Pathway. Cell Reports 2017a [Google Scholar]
- Ge Z, Leighton JS, Wang Y, Peng X, Chen Z, Sun Y, Li J, Liu J, Shriver CD, Hu H, et al. Integrated Pan-Cancer Analysis of the Ubiquitin Pathway. Cell Reports 2017b [Google Scholar]
- Hanahan D, Weinberg RA. The Hallmarks of Cancer Review. Cell. 1998;100:57–70. doi: 10.1016/s0092-8674(00)81683-9. [DOI] [PubMed] [Google Scholar]
- Hanahan D, Weinberg RA. Hallmarks of cancer: the next generation. Cell. 2011;144:646–674. doi: 10.1016/j.cell.2011.02.013. [DOI] [PubMed] [Google Scholar]
- Hartmaier RJ, Albacker LA, Chmielecki J, Bailey M, He J, Goldberg ME, Ramkissoon S, Suh J, Elvin JA, Chiacchia S, et al. High-Throughput Genomic Profiling of Adult Solid Tumors Reveals Novel Insights into Cancer Pathogenesis. Cancer Res. 2017;77:2464–2475. doi: 10.1158/0008-5472.CAN-16-2479. [DOI] [PubMed] [Google Scholar]
- Hoadley KA, Yau C, Wolf DM, Cherniack AD, Tamborero D, Ng S, Leiserson MDM, Niu B, McLellan MD, Uzunangelov V, et al. Multiplatform analysis of 12 cancer types reveals molecular classification within and across tissues of origin. Cell. 2014;158:929–944. doi: 10.1016/j.cell.2014.06.049. [DOI] [PMC free article] [PubMed] [Google Scholar]
- Hoadley KA, Yau C, Hinoue T, Wolf MD, Lazar JA, Drill E, Shen R, Taylor MA, Cherniack DA, Akbani R, et al. Cell-of-Origin Patterns Dominate the Molecular Classification of 10,000 Tumors from 33 Types of Cancer. Cell. 2018 doi: 10.1016/j.cell.2018.03.022. [DOI] [PMC free article] [PubMed] [Google Scholar]
- Jayasinghe RG, Cao S, Gao Q, Vo NS, Reynolds SM, Zhao Y, Climente-González H, Wang F, Varghese R, Huang M, et al. Systematic analysis of novel splice-creating mutations in cancer. Cell Reports. 2017 doi: 10.1016/j.celrep.2018.03.052. [DOI] [PMC free article] [PubMed] [Google Scholar]
- Joshi-Tope G, Gillespie M, Vastrik I, D’Eustachio P, Schmidt E, de Bono B, Jassal B, Gopinath GR, Wu GR, Matthews L, et al. Reactome: a knowledgebase of biological pathways. Nucleic Acids Res. 2005;33:D428–D432. doi: 10.1093/nar/gki072. [DOI] [PMC free article] [PubMed] [Google Scholar]
- Kanehisa M, Goto S. KEGG: kyoto encyclopedia of genes and genomes. Nucleic Acids Res. 2000;28:27–30. doi: 10.1093/nar/28.1.27. [DOI] [PMC free article] [PubMed] [Google Scholar]
- Korkut A, Zaidi S, Kanchi R, Berger A, Robertson G, Kwong L, Datto M, Roszik J, Ling S, Ravikumar V, et al. A PanCancer molecular analysis of disruptions in the TGF-β pathway. Cancer Cell 2017 [Google Scholar]
- Laroche-Clary A, Chaire V, Algeo M-P, Derieppe M-A, Loarer FL, Italiano A. Combined targeting of MDM2 and CDK4 is synergistic in dedifferentiated liposarcomas. J. Hematol. & Oncol. 2017;10:123. doi: 10.1186/s13045-017-0482-3. [DOI] [PMC free article] [PubMed] [Google Scholar]
- Lawrence MS, Stojanov P, Polak P, Kryukov GV, Cibulskis K, Sivachenko A, Carter SL, Stewart C, Mermel CH, Roberts SA, et al. Mutational heterogeneity in cancer and the search for new cancer-associated genes. Nature. 2013;499:214–218. doi: 10.1038/nature12213. [DOI] [PMC free article] [PubMed] [Google Scholar]
- Lawrence MS, Stojanov P, Mermel CH, Robinson JT, Garraway LA, Golub TR, Meyerson M, Gabriel SB, Lander ES, Getz G. Discovery and saturation analysis of cancer genes across 21 tumour types. Nature. 2014;505 doi: 10.1038/nature12912. [DOI] [PMC free article] [PubMed] [Google Scholar]
- Lepri F, De Luca A, Stella L, Rossi C, Baldassarre G, Pantaleoni F, Cordeddu V, Williams BJ, Dentici ML, Caputo V, et al. SOS1 mutations in Noonan syndrome: molecular spectrum, structural insights on pathogenic effects, and genotype-phenotype correlations. Hum. Mutat. 2011;32:760–772. doi: 10.1002/humu.21492. [DOI] [PMC free article] [PubMed] [Google Scholar]
- Mermel CH, Schumacher SE, Hill B, Meyerson ML, Beroukhim R, Getz G. GISTIC2.0 facilitates sensitive and confident localization of the targets of focal somatic copy-number alteration in human cancers. Genome Biol. 2011;12:R41. doi: 10.1186/gb-2011-12-4-r41. [DOI] [PMC free article] [PubMed] [Google Scholar]
- Mina M, Raynaud F, Tavernari D, Battistello E, Sungalee S, Saghafinia S, Laessle T, Sanchez-Vega F, Schultz N, Oricchio E, et al. Conditional Selection of Genomic Alterations Dictates Cancer Evolution and Oncogenic Dependencies. Cancer Cell. 2017;32:155–168. e6. doi: 10.1016/j.ccell.2017.06.010. [DOI] [PubMed] [Google Scholar]
- Mitsuishi Y, Taguchi K, Kawatani Y, Shibata T, Nukiwa T, Aburatani H, Yamamoto M, Motohashi H. Nrf2 redirects glucose and glutamine into anabolic pathways in metabolic reprogramming. Cancer Cell. 2012;22:66–79. doi: 10.1016/j.ccr.2012.05.016. [DOI] [PubMed] [Google Scholar]
- Network, C.G.A.R. Comprehensive genomic characterization of squamous cell lung cancers. Nature. 2010;489:519–525. doi: 10.1038/nature11404. [DOI] [PMC free article] [PubMed] [Google Scholar]
- Network, T.C.G.A.R. Integrated genomic characterization of endometrial carcinoma. Nature. 2013;497 doi: 10.1038/nature12113. [DOI] [PMC free article] [PubMed] [Google Scholar]
- Network, C.G.A.R., University, A.W.G.A., Agency, B.C., Hospital, B. and W., Institute, B., University, B., University, C.W.R., Institute, D.-F.C., University, D., Centre, G.P.C et al. Integrated genomic characterization of oesophageal carcinoma 2017 [Google Scholar]
- Network, T.C.G.A.R., sites, D. working group and tissue source, Medicine, G. sequencing centres B.C. of, Institute, B., Louis, W.U. in S., Institute, C. genome characterization centres: B.I.-F.C., School, H.M., University, H.I., University, U. of S.C.H., Laboratory, L.B.N et al. Integrated genomic analyses of ovarian carcinoma. Nature. 2009;474:609–615. [Google Scholar]
- Nissan MH, Pratilas CA, Jones AM, Ramirez R, Won H, Liu C, Tiwari S, Kong L, Hanrahan AJ, Yao Z, et al. Loss of NF1 in cutaneous melanoma is associated with RAS activation and MEK dependence. Cancer Res. 2014;74:2340–2350. doi: 10.1158/0008-5472.CAN-13-2625. [DOI] [PMC free article] [PubMed] [Google Scholar]
- Pai SG, Carneiro BA, Mota JM, Costa R, Leite CA, Barroso-Sousa R, Kaplan JB, Chae YK, Giles FJ. Wnt/beta-catenin pathway: modulating anticancer immune response. J. Hematol. & Oncol. 2017;10:101. doi: 10.1186/s13045-017-0471-6. [DOI] [PMC free article] [PubMed] [Google Scholar]
- Park HW, Guan K-L. Regulation of the Hippo pathway and implications for anticancer drug development. Trends Pharmacol. Sci. 2013;34:581–589. doi: 10.1016/j.tips.2013.08.006. [DOI] [PMC free article] [PubMed] [Google Scholar]
- Peng X, Chen Z, Farshidfar F, Wang Y, Cheng F, Ge Z, Li J, Thomas G, Birsoy K, Zhang H, et al. Systematic Molecular Characterization of Metabolic Subtypes in Human Cancers. Cell Reports 2017 [Google Scholar]
- Rayner E, van Gool IC, Palles C, Kearsey SE, Bosse T, Tomlinson I, Church DN. A panoply of errors: polymerase proofreading domain mutations in cancer. Nat. Rev. Cancer. 2016;16:71–81. doi: 10.1038/nrc.2015.12. [DOI] [PubMed] [Google Scholar]
- Schaub FX, Dhankani V, Berger AC, Trivedi M, Zhang X, Show R, Liu Y, Ayer D, Hurlin PJ, Cherniack AD, et al. The MYC pan-cancer network: Analysis of the MYC oncogenic pathway across cancer types. Cell Syst 2017 [Google Scholar]
- Schram AM, Berger MF, Hyman DM. Precision oncology: Charting a path forward to broader deployment of genomic profiling. PLoS Med. 2017;14:e1002242. doi: 10.1371/journal.pmed.1002242. [DOI] [PMC free article] [PubMed] [Google Scholar]
- Seiler M, Peng S, Agrawal A, Tsai J, Palacino J, Buonamici S, Yu L. Abstract 383: Survey of spliceosome gene mutations and associated splicing defects across 33 cancer types. Cancer Res. 2017;77 [Google Scholar]
- Sheen YY, Kim M-J, Park S-A, Park S-Y, Nam J-S. Targeting the Transforming Growth Factor-β Signaling in Cancer Therapy. Biomol. & Ther. 2013;21:323–331. doi: 10.4062/biomolther.2013.072. [DOI] [PMC free article] [PubMed] [Google Scholar]
- Sholl LM, Do K, Shivdasani P, Cerami E, Dubuc AM, Kuo FC, Garcia EP, Jia Y, Davineni P, Abo RP, et al. Institutional implementation of clinical tumor profiling on an unselected cancer population. JCI Insight. 2016;1:e87062. doi: 10.1172/jci.insight.87062. [DOI] [PMC free article] [PubMed] [Google Scholar]
- Sun C, Wang L, Huang S, Heynen GJJE, Prahallad A, Robert C, Haanen J, Blank C, Wesseling J, Willems SM, et al. Reversible and adaptive resistance to BRAF(V600E) inhibition in melanoma. Nature. 2014;508:118–122. doi: 10.1038/nature13121. [DOI] [PubMed] [Google Scholar]
- Takebe N, Nguyen D, Yang SX. Targeting notch signaling pathway in cancer: clinical development advances and challenges. Pharmacol. & Ther. 2014;141:140–149. doi: 10.1016/j.pharmthera.2013.09.005. [DOI] [PMC free article] [PubMed] [Google Scholar]
- Monnat, et al. Genomic and Molecular Landscape of DNA Damage Repair Deficiency Across The Cancer Genome Atlas. Manuscr. Prep. 2017 doi: 10.1016/j.celrep.2018.03.076. [DOI] [PMC free article] [PubMed] [Google Scholar]
- Triche TJ, Weisenberger DJ, Van Den Berg D, Laird PW, Siegmund KD. Low-level processing of Illumina Infinium DNA Methylation BeadArrays. Nucleic Acids Res. 2013;41:e90. doi: 10.1093/nar/gkt090. [DOI] [PMC free article] [PubMed] [Google Scholar]
- Unni AM, Lockwood WW, Zejnullahu K, Lee-Lin S-Q, Varmus H. Evidence that synthetic lethality underlies the mutual exclusivity of oncogenic KRAS and EGFR mutations in lung adenocarcinoma. ELife. 2015;4:e06907. doi: 10.7554/eLife.06907. [DOI] [PMC free article] [PubMed] [Google Scholar]
- Vogelstein B, Kinzler KW. Cancer genes and the pathways they control. Nat. Med. 2004;10:789–799. doi: 10.1038/nm1087. [DOI] [PubMed] [Google Scholar]
- Vogelstein B, Papadopoulos N, Velculescu VE, Zhou S, Diaz LA, Kinzler KW. Cancer genome landscapes. Sci. 2013;339:1546–1558. doi: 10.1126/science.1235122. [DOI] [PMC free article] [PubMed] [Google Scholar]
- Wang C, Xiao Y. Genomic and Molecular Landscape of DNA Damage Repair Deficiency Across The Cancer Genome Atlas. Cancer Cell. 2017 doi: 10.1016/j.celrep.2018.03.076. [DOI] [PMC free article] [PubMed] [Google Scholar]
- Way GP, Greene CS. Identifying and characterizing Ras pathway activation in The Cancer Genome Atlas. Cell Syst 2017 [Google Scholar]
- Whitfield JR, Beaulieu M-E, Soucek L. Strategies to Inhibit Myc and Their Clinical Applicability. Front. Cell Dev. Biol. 2017;5:10. doi: 10.3389/fcell.2017.00010. [DOI] [PMC free article] [PubMed] [Google Scholar]
- Zehir A, Benayed R, Shah RH, Syed A, Middha S, Kim HR, Srinivasan P, Gao J, Chakravarty D, Devlin SM, et al. Mutational landscape of metastatic cancer revealed from prospective clinical sequencing of 10,000 patients. Nat. Med. 2017;23:703–713. doi: 10.1038/nm.4333. [DOI] [PMC free article] [PubMed] [Google Scholar]
- Zhang Y, Kwok-Shing Ng P, Kucherlapati M, Chen F, Liu Y, Tsang YH, de Velasco G, Jeong KJ, Akbani R, Hadjipanayis A, et al. A Pan-Cancer Proteogenomic Atlas of PI3K/AKT/mTOR Pathway Alterations. Cancer Cell. 2017;31:820–832. e3. doi: 10.1016/j.ccell.2017.04.013. [DOI] [PMC free article] [PubMed] [Google Scholar]
Associated Data
This section collects any data citations, data availability statements, or supplementary materials included in this article.
Supplementary Materials
Supplemental Figure S1. Curated pathways including cross-cross pathway interactions. Related to Figure 2. Same as Figure 2, but including cross-pathway interactions.
Supplemental Table S3: Curated pathway templates. Related to Figure 2.
Supplemental Table S4: Genomic Alteration Matrices. Related to Figure 3.
Supplemental Table S5: High-scoring motifs from SELECT analysis. Related to Figure 6.
Supplemental Table S6: Non-OncoKB clinical actionability. Related to Figure 7.
Supplemental Table S7: Summary of results from RESET analysis. Related to STAR Methods.
Supplemental Table S8: Fusion calls. Related to STAR Methods.
Supplemental Figure S2. Cell cycle, WNT, TP53, NRF2 and PI3K pathway alterations. Related to Figure 5. Detailed heatmap of alteration frequencies in members of the Cell cycle, WNT, TP53 and NRF2 pathways. Shades of red indicate activating event (mutation, amplification, activating fusion) and shades of blue indicate inactivating event (mutation, homozygous loss, inactivating fusion, epigenetic silencing). Color side bars show the fraction of samples affected by each type of somatic alteration (or a combination of them) for each pathway gene. Top color bars show the proportion of different types of alterations for each cancer subtype.
Supplemental Figure S3. HIPPO, MYC, TGFβ and NOTCH pathway alterations. Related to Figure 5. Detailed heatmap of alteration frequencies in members of the Hippo, MYC, TGFβ and NOTCH pathways. Shades of red indicate activating event (mutation, amplification, activating fusion) and shades of blue indicate inactivating event (mutation, homozygous loss, inactivating fusion, epigenetic silencing). Color side bars show the fraction of samples affected by each type of somatic alteration (or a combination of them) for each pathway gene. Top color bars show the proportion of different types of alterations for each cancer subtype.
Supplemental Figure S4. Additional results for conditional selection. Related to Figure 6. (A–E) Mutual exclusivity (in purple) and Co-Occurrence (in green) between alterations in (A) PI3K and RTK pathways, (B) Cell cycle and TP53 pathways, (C) TP53 and PI3K pathways, (D) TP53 and HIPPO pathways, and (E) cell cycle and NRF2 pathways.
Supplemental Table S1: List of sample IDs, cancer type and subtype assignments. Related to Figure 1.
Supplemental Table S2: Overview of the 10 pathways selected for study. Related to Figure 2.