

Abstract
Objective
To describe the accuracy of the Bayley Scales of Infant Development-Second Edition (BSID-II) Mental Development Index (MDI) at 2 years of age for prediction of cognitive function at school age of children born extremely preterm.
Design
Study participants were enrolled in the Extremely Low Gestational Age Newborn Study between 2002 and 2004. Two-thirds of surviving children (n=795) were assessed at 2 years with the BSID-II and at 10 years with an intelligence quotient (IQ) test. We computed test characteristics for a low MDI (< 70), including predictive value positive.
Results
Almost two-thirds of children with a low MDI had a normal IQ (≥ 70) at 10 years. Concordance between MDI and IQ was highest among children with major motor and/or sensory impairment, and when MDI was adjusted for gestational age.
Conclusion
Most children born extremely preterm with low BSID-II MDI at 2 years have normal intelligence at school age.
Introduction
About 75% of infants born extremely preterm (< 28 weeks of gestation) survive into childhood(1) and about 25% of survivors develop moderate-to-severe cognitive disability.(2–4) Studies of the cognitive outcomes for individuals born extremely preterm have been used to guide clinical care of neonates at the margin of viability,(5, 6) to identify children most in need of special educational resources,(7) and as the evidence base for neonatal intensive care practices.(8–10) Typically, cognitive function is first assessed at 18-24 months using the Bayley Scales of Infant Development (BSID).(11)
Many research studies that have helped to guide current perinatal care have employed the second edition of the BSID (BSID-II) to assessment developmental outcome,(11) and the most frequently met criterion for moderate to severe neurodevelopmental impairment has been a BSID-II Mental Development Index (MDI) more than 2 standard deviations below the mean in the standardization sample, i.e., a score less than 70. Research involving children born with very low birth weight(12, 13) or born very preterm(14, 15) suggests that MDI < 70 is only moderately predictive of IQ < 70,(16) and that among extremely low birth weight children without neurosensory impairment, the predictive value is low.(17) The limitations of existing studies of the accuracy of the BSID-II MDI include relatively small samples and short intervals between measurements of MDI and IQ. No study has assessed whether infant or maternal sociodemographic attributes influence the difference between a child’s MDI and IQ.
Our objectives were to describe the relationship between MDI < 70 at 2 years adjusted age and cognitive impairment at 10 years of age in a large sample of children born extremely preterm, i.e., the ELGAN Study cohort,(18) and to identify infant or maternal factors that influence the level of agreement between MDI and IQ.
Methods
Participants (Table 1)
Table 1.
Sample characteristics for children eligible for assessment at 10 years of age (n=966). These are column percents.
| Factor | Level | Returned for 10-year assessment | ||
|---|---|---|---|---|
| Yes | No | |||
| Major Impairment | ||||
| Yes | No | |||
| Maternal education | ≤ 12 | 40 | 47 | 55 |
| 13-15 | 22 | 22 | 26 | |
| ≥ 16 | 38 | 23 | 19 | |
| Public insurance | Yes | 35 | 39 | 60 |
| Pre-pregnancy body mass index | ≥ 30 | 22 | 27 | 18 |
| Region in which child was born | New England | 40 | 42 | 44 |
| North Carolina | 30 | 23 | 25 | |
| Lake Michigan | 30 | 35 | 31 | |
| Sex | Male | 50 | 44 | 44 |
| Gestational age | 23-24 | 18 | 38 | 14 |
| 25-26 | 46 | 41 | 60 | |
| 27 | 37 | 21 | 26 | |
| Birth weight Z-score | < −2 | 6 | 8 | 1 |
| ≥ −2, < −1 | 13 | 14 | 14 | |
| ≥ −1, | 81 | 78 | 84 | |
| White matter abnormality†† | Yes | 11 | 28 | 9 |
| Psychomotor Development Index at 2 years | < 55 | 10 | 47 | 25 |
| 55-69 | 15 | 20 | 11 | |
| 70-84 | 22 | 15 | 23 | |
| ≥ 85 | 53 | 18 | 42 | |
| Total sample | 735 | 154 | 77 | |
Major impairment was defined as either severe gross motor impairment (level 5 on the Gross Motor Function Classification System) or severe visual impairment (uncorrectable functional blindness in both eyes).
White matter abnormality: ventriculomegaly and or a hypoechoic lesion on cranial ultrasound during the NICU stay.
Abbreviations: DAS – Differential Ability Scales
The Extremely Low Gestational Age Newborn (ELGAN) Study is a multicenter observational study of the risk of structural and functional neurologic disorders in extremely preterm infants.(18) During the years 2002-2004, women delivering before 28 weeks gestation were asked to enroll in the study. Mothers of 1506 infants born in 14 U.S. hospitals in 5 states gave informed consent for participation. Of 1200 ELGAN Study survivors, 1102 (92%) were evaluated at age 2 years.
At 10 years of age, 966 surviving children, on whom blood specimens were collected in the first weeks of life for assessment of inflammation-related proteins, were recruited. The families of 889 of these children returned for follow up at 10 years of age. Excluded from the current analysis were 94 children who were not assessed with cognitive measures at both 2 and 10 years of age. The institutional review boards of all participating institutions approved enrollment and consent procedures for this follow-up study.
Demographic and pregnancy variables
After delivery, each mother was interviewed in her native language by a trained research nurse who used a structured data collection form as described in a manual of procedures. This interview was the source of information about mother’s pre-pregnancy weight and height, her education, and whether or not she received public health insurance.
Newborn variables
Birth weight and gestational age were obtained by medical record review. The gestational age estimates were based on a hierarchy of the quality of available information. Most desirable were estimates based on the dates of embryo retrieval or intrauterine insemination or fetal ultrasound before the 14th week (62%). When these were not available, reliance was placed sequentially on a fetal ultrasound at 14 or more weeks (29%), last menstrual period without fetal ultrasound (7%), and gestational age recorded in the log of the neonatal intensive care unit (1%). The birth weight Z-score is the number of standard deviations the infant’s birth weight is above or below the median weight of infants at the same gestational age in a standard data set.(19)
Ultrasound scans
In prior publications we have described how ultrasound images were acquired(20) and how inter-reader agreement was maximized. (21) For the current analyses, we defined white matter damage as moderate/severe ventriculomegaly or echolucency in the periventricular white matter. Radiologists classified the degree of ventriculomegaly using templates of multiple levels of ventriculomegaly and recorded observations about echolucent lesions in 16 white matter zones on each side seen on coronal views. Each scan was read by at least two readers, and if the first two readers disagreed about the presence of white matter damage, the images were sent to a third (tie-breaking) reader who was blinded to the original reports.
Early Cognitive Function at 24 months of age
Assessment with the BSID-II was completed close to 2 years of age, adjusted for gestational age at birth; 77% of children had their exam within the range of 23.5-27.9 months. Certified examiners administered and scored the BSID-II. Only 2% of examiners indicated at the time of the examination that they had more than a limited amount of information about the child. Before testing examiners were told the child’s age. After completion of testing they were told the gestational age so that the BSID-II scores could be age-adjusted.
Cognitive Function at ten years of age
For assessment at ten years, cognitive evaluations were administered by child psychologists in a 3- to 4-hour session that included breaks. All psychologist examiners underwent a 1-day in-person training and verification of fidelity for administration and scoring the test battery. General cognitive ability (or IQ) was assessed with the School-Age Differential Ability Scales–II (DAS-II(22)) Verbal and Nonverbal Reasoning subscales. Executive function was assessed with the DAS-II and the NEuroPSYchological Assessment (NEPSY-II).(23) DAS-II Recall of Digits Backward and Recall of Sequential Order measured verbal working memory. NEPSY-II Auditory Attention and Auditory Response Set measured sustained auditory attention, set switching and inhibition. NEPSY-II Inhibition-Inhibition and Inhibition-Switching measured simple inhibition and inhibition in the context of set shifting, respectively. NEPSY-II Animal Sorting measured visual concept formation and mental flexibility. In addition to defining moderate to severe cognitive impairment using IQ alone, we also identified a subgroup with moderate to severe impairment (18.8% of study participants) using latent profile analysis (LPA) applied to measures of IQ and executive function, who on average scored more than two standard deviations below normative expectation across all measures.(24)
Data Analyses
For both the MDI and IQ the standard deviation in the normative sample is 15. Sensitivity, specificity, predictive value positive and predictive value negative were calculated as described previously(25) for three cut-offs: MDI < 55, MDI < 70, and MDI < 85, corresponding to 3, 2, and 1 standard deviations below the mean of 100 in the normative sample. We calculated these test characteristics separately for children with and without major neuromotor and/or sensory impairment, defined as severe gross motor impairment (level 5 on the Gross Motor Function Classification System)(26) and/or severe visual impairment (uncorrectable functional blindness in both eyes).
To compare two test characteristics, we used the 95% confidence interval. If the point estimate for one member of the pair was not included in the 95% confidence interval for the other member, we concluded that the difference was statistically significant at p < 0.05. As an overall measure of diagnostic accuracy of cut-offs we computed the diagnostic odds ratio.(27)
To describe the difference in cognitive function between 24 months and 10 years, we calculated the difference between the MDI and the IQ [(Verbal IQ + Non-Verbal IQ) / 2)] and the exact binomial 95% confidence limits. To evaluate whether maternal or infant attributes influence the relationship of MDI and IQ, we compare this median difference between MDI and IQ for subgroups of study participants with and without the attributes of interest, including fetal growth restriction, male sex, gestational age at birth, neonatal cerebral white matter damage, and lower scores on the motor scale of the BSID-II, i.e., the Psychomotor Development Index, at 2 years adjusted age. For these comparisons we used Kruskal-Wallis tests and defined statistical significance as p < 0.05.
Result
Study participants (Table 1)
Children who were eligible for evaluation at 10 years but did not return for evaluation (n=77) were often born to mothers with less than high school education and mothers who were eligible for public assistance, as compared to children included in the current analysis. Children with severe neurosensory impairment (n=60) or who were not tested with both the BSID and DAS (n=94) were more likely to have had cerebral white matter abnormality on neonatal cranial ultrasound and to have had abnormally low PDI at 2 years adjusted age.
Relationship of low MDI at 24 months to cognitive impairment at 10 years (Table 2 and 3)
Table 2.
The percent of children who had an MDI at age 2 years in the range listed at the top of the column who also had the standard score of the DAS components at age 10 years listed on the left. These are column percents.
| DAS-II at 10 years | Uncorrected MDI at age 2 years | Row N | ||||
|---|---|---|---|---|---|---|
| < 55 | 55-69 | 70-84 | ≥ 85 | |||
| Verbal Reasoning | < 55 | 13 | 3 | 0.5 | 0.6 | 31 |
| 55-69 | 21 | 6 | 2 | 1 | 55 | |
| 70-84 | 28 | 27 | 14 | 7 | 137 | |
| ≥ 85 | 37 | 63 | 83 | 91 | 512 | |
| Non-Verbal Reasoning | < 55 | 7 | 1 | 0.5 | 0 | 15 |
| 55-69 | 15 | 8 | 4 | 0 | 47 | |
| 70-84 | 36 | 29 | 16 | 11 | 166 | |
| ≥ 85 | 43 | 62 | 79 | 89 | 507 | |
| Working Memory | < 55 | 16 | 4 | 1 | 2 | 40 |
| 55-69 | 12 | 9 | 1 | 2 | 41 | |
| 70-84 | 28 | 20 | 13 | 5 | 119 | |
| ≥ 85 | 44 | 67 | 85 | 91 | 531 | |
| Maximum number of children | 173 | 172 | 207 | 183 | 735 | |
| DAS-II at 10 years | Corrected MDI at age 2 years | Row N | ||||
|---|---|---|---|---|---|---|
| < 55 | 55-69 | 70-84 | ≥ 85 | |||
| Verbal Reasoning | < 55 | 22 | 6 | 4 | 0.5 | 31 |
| 55-69 | 25 | 17 | 8 | 2 | 55 | |
| 70-84 | 29 | 28 | 28 | 11 | 137 | |
| ≥ 85 | 24 | 49 | 59 | 87 | 512 | |
| Non-Verbal Reasoning | < 55 | 13 | 3 | 1 | 0.2 | 15 |
| 55-69 | 23 | 10 | 6 | 3 | 47 | |
| 70-84 | 34 | 30 | 34 | 14 | 166 | |
| ≥ 85 | 30 | 57 | 59 | 83 | 507 | |
| Working Memory | < 55 | 30 | 6 | 4 | 1 | 40 |
| 55-69 | 12 | 12 | 9 | 2 | 41 | |
| 70-84 | 29 | 25 | 24 | 9 | 119 | |
| ≥ 85 | 29 | 58 | 63 | 87 | 531 | |
| Maximum number of children | 79 | 69 | 179 | 408 | 735 | |
Abbreviations: MDI – Mental Development Index; DAS – Differential Ability Scales
Table 3.
Measures of the ability of a low MDI at age 2 years to predict DAS standard scores and cognitive function at 10 years of age among children who did not have a major neuromotor or sensory impairment.
| Percent Impaired at age 10 | Row N | Performance impairment at age 2 (95% confidence interval) predicting impairment at age 10 | |||||
|---|---|---|---|---|---|---|---|
| Adjusted MDI < 55 at age 2 (n=79) | Adjusted MDI ≥ 55 at age 2 (n= 656) | PVP | PVN | Sens | Spec | ||
| DAS Verbal < 70 | 47 | 7 | 86 | 47 (36, 58) | 93 (90, 94) | 43 (32, 54) | 94 (91, 95) |
| DAS Non-verbal < 70 | 35 | 5 | 62 | 35 (25, 47) | 95 (93, 96) | 45 (32, 58) | 92 (90, 94) |
| Mod/Sev Impairment* | 63 | 14 | 139 | 63 (53, 74) | 86 (84, 89) | 36 (28, 45) | 95 (93, 97) |
| Percent Impaired at age 10 | Row N | Performance impairment at age 2 (95% confidence interval) predicting impairment at age 10 | |||||
|---|---|---|---|---|---|---|---|
| Adjusted MDI < 70 at age 2 (n=148) | Adjusted MDI ≥ 70 at age 2 (n= 587) | PVP | PVN | Sens | Spec | ||
| DAS Verbal < 70 | 36 | 6 | 86 | 36 (28,44) | 94 (92,96) | 62 (50, 72) | 85 (82,88) |
| DAS Non-verbal < 70 | 25 | 4 | 62 | 25 (18,33) | 96 (46,72) | 60 (46,72) | 84 (80,86) |
| Mod/Sev Impairment* | 48 | 12 | 139 | 48 (40,56) | 88 (86, 91) | 51 (42, 59) | 87 (84,90) |
| Percent Impaired at age 10 | Row N | Performance impairment at age 2 (95% confidence interval) predicting impairment at age 10 | |||||
|---|---|---|---|---|---|---|---|
| Adjusted MDI < 85 at age 2 (n=327) | Adjusted MDI ≥ 85 at age 2 (n= 408) | PVP | PVN | Sens | Spec | ||
| DAS Verbal < 70 | 23 | 2 | 86 | 23 (19, 28) | 98 (95, 99) | 88 (80, 94) | 61 (57, 65) |
| DAS Non-verbal < 70 | 15 | 3 | 62 | 15 (12, 20) | 97 (95, 98) | 81 (69, 90) | 59 (55, 63) |
| Mod/Sev Impairment* | 36 | 5 | 139 | 36 (31, 42) | 95 (92, 97) | 85 (78, 90) | 64 (61, 69) |
Impairment based on LPA analysis of IQ and EF
Abbreviations: MDI – Mental Development Index; DAS – Differential Ability Scales; Mod/Sev – moderate/severe; PVP – predictive value positive; PVN – predictive value negative; Sens – sensitivity; Spec – specificity; LPA – latent profile analysis; IQ – intelligence quotient; EF – executive function
Of the children with MDI < 55, 53% had IQ ≥ 70 at 10 years of age; and nearly one quarter had an IQ ≥ 85, which is within 1 standard deviation of the mean. Among infants with MDI < 70, 36% had IQ ≥ 85 at school age.
Predictive value positive and diagnostic odds ratio was highest with a cut-off of MDI < 55 (3 standard deviations below the normative mean). Predictive value positive was higher for cognitive outcomes that were based on verbal and nonverbal IQ and executive function combined than for either verbal IQ or non-verbal IQ. Predictive value positive was higher when considering MDI for adjusted age as compared to MDI for actual age.
Among children with moderate to severe gross motor function impairment and/or legal blindness in one or both eyes, the predictive value positive for MDI < 55 was 70% (95% confidence interval: 51%, 84%) and predictive value negative was 75% (95% confidence interval: 54%, 89%), significantly higher than the predictive value positive and predictive value negative among children without major motor and/or sensory impairment. Each of these test characteristics was higher than was found among children without major neuromotor and/or sensory impairment at 10 years of age.
Comparison of MDI at 24 months and IQ at 10 years (Figure 1; Table 4)
Figure 1.
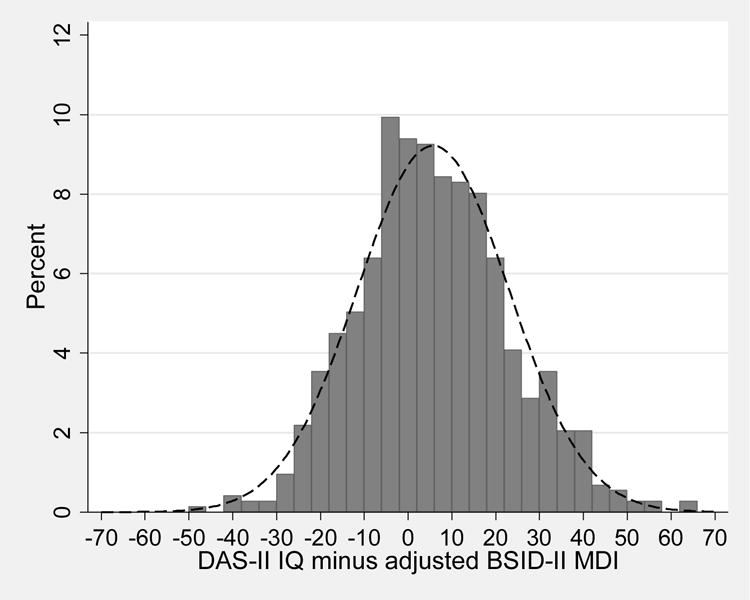
Frequency distribution for DAS IQ at 10 years minus BSID MDI at 2 years. The overlying normal curve is calculated using the mean and standard deviation of the difference.
Table 4.
Difference between IQ at 10 years of age and MDI at 2 years adjusted age (95% confidence limits).
| Factor | Level | Median (95% CI)* | N | p-value** |
|---|---|---|---|---|
| Maternal education | ≤ 12 | 6 (2.5, 9) | 294 | 0.20 |
| 13-15 | 4 (−1.5, 8) | 165 | ||
| ≥ 16 | 4 (2, 6) | 276 | ||
| Public insurance | Yes | 6.25 (4, 9.5) | 254 | 0.16 |
| No | 4 (1.5, 6) | 481 | ||
| Pre-pregnancy BMI | ≥ 30 | 9 (3.5, 13) | 155 | 0.01 |
| < 30 | 4 (2, 5.5) | 555 | ||
| ELGAN site at birth | New England | 4.5 (1, 7) | 296 | 0.92 |
| North Carolina | 4.25 (2, 8) | 218 | ||
| Lake Michigan | 5.5 (2.5, 9) | 221 | ||
| Sex | Male | 6.5 (4, 9) | 369 | 0.01 |
| Female | 3 (1, 5.5) | 366 | ||
| Gestational age | 23-24 | 7 (3, 13) | 129 | 0.14 |
| 25-26 | 3.5 (1, 6) | 337 | ||
| 27 | 5.5 (2, 9) | 269 | ||
| Birth weight Z-score | < −2 | 6.5 (−5, 12.5) | 41 | 0.41 |
| ≥ −2, < −1 | 2.5 (01.5, 7.5) | 98 | ||
| ≥ −1 | 5 (3.5, 7) | 325 | ||
| White matter abnormality (VM and/or EL) | Yes | 4.25 (−0.5, 10) | 80 | 0.67 |
| No | 5 (3, 6.5) | 655 | ||
| PDI at 2 years | < 55 | 11.75 (5.5, 16) | 70 | 0.0001 |
| 55-69 | 16 (6.5, 21) | 107 | ||
| 70-84 | 9 (5.5, 11) | 158 | ||
| ≥ 85 | 1 (−0.5, 3) | 384 | ||
| Weight Z-score at 2 years | < −2 | 6.25 (−0.5, 16) | 36 | 0.56 |
| ≥ −2, < −1 | 5.5 (0, 9) | 115 | ||
| ≥ −1 | 4 (2, 6) | 563 | ||
| Weight Z-score at 10 years | < −2 | 5.75 (−5.5, 11) | 46 | 0.82 |
| ≥ −2, < −1 | 6.25 (3.5, 9) | 144 | ||
| ≥ −1 | 4.5 (2.5, 6) | 538 | ||
| Total sample | 5 (3, 6.5) | 735 |
The distribution of the difference in 2-year and 10-year scores (IQ - MDI) was skewed to the right, with a mean value of 5 (95% confidence limits: 3, 6.5). Children born to mothers with pre-pregnancy obesity, males, and children with lower motor skills at 2 years adjusted age, exhibited greater increase in cognitive tests scores between 2 and 10 years.
Discussion
In this cohort of children born extremely preterm over half of those classified as having cognitive impairment at 2 years, based on their having a low MDI, did not have cognitive impairment at 10 years. Even children with very low MDI (< 55), were more likely than not to have IQ > 70 at 10 years of age. The value of MDI for prediction of cognitive impairment at 10 years of age was higher when using MDI for adjusted age, rather than MDI for actual age. In addition, predictive value positive was higher for a cognitive outcome that included tests of executive function than for verbal or nonverbal IQ alone. As has been reported by others,(17) the predictive accuracy of the MDI was higher among children with motor and/or sensory impairment as compared to children without these impairments. Several maternal and infant factors that have been previously associated with lower MDI, such as pre-pregnancy maternal obesity, male sex, and impaired motor skills at two years, were associated with greater increase in cognitive scores between 2 and 10 years.
Predictive Value of the BSID
Although the BSID has been used widely as a cognitive assessment for infants, the BSID-II manual states that “the BSID-II is not to serve as an intelligence test for young children.”(28) While MDI correlates moderately well with IQ,(16) our findings indicate that cognitive impairment identified with the BSID-II frequently does not persist through school age among infants born extremely preterm. One explanation is that the BSID-II might overestimate the degree of impairment; another is that cognitive functioning might improve after infancy. It follows that evaluations at school age, when intelligence and other aspects of cognitive function can be assessed, are essential in order to provide a more valid description of the long-term outcomes of individuals born extremely preterm.
Our finding that extremely preterm infants with low MDI more often than not did not have cognitive impairment at 10 years of age agrees with a study of children born with extremely low birth weight, in which only 37% of those with MDI < 70 at 20 months had IQ < 70 at 8 years.(17) Our results also agree with a study of children born before 30 weeks of gestation in which 50% of those with MDI < 70 at 2 years had IQ < 70 at 4 years. However our primary finding contrasts with that of two studies of children born with very low birth weight,(12, 13) and a study of infants born before 31 weeks of gestation,(14) in which the predictive value positives for MDI < 70 were 0.75 or greater. In studies that described a higher predictive value positive than reported here, IQ was measured at 5 years of age or less, so that the interval between testing with the BSID and IQ testing was less than the interval in the present study. In addition, studies showing high predictive value involved infants of greater birth weight and gestational age, and thus, lower rates severe neonatal illnesses. Such illness can slow developmental trajectory early in life but typically resolve during early childhood. Of the five prior studies of the BSID in very low birth weight children, very preterm, or extremely low birth weight, 1 used the first edition of the BSID, 2 used the second edition, and 2 used the third edition. Although the three scales are correlated with each other,(29) (and Figure 1 of Lowe et al(30)) it is possible that some of the discrepancy across studies is attributable to use of different versions of the BSID.
When using the BSID to evaluate children born prematurely, typical practice is to subtract from the child’s age the number of days between the date of the infant’s birth and the expected date of birth.(31) This adjustment for the degree of prematurity results in a higher MDI score, and thus would be expected to increase the specificity and predictive value positive. Our study provides empiric support for this supposition and emphasizes the importance of adjustment for degree of prematurity when the goal of assessment is to obtain the most valid indication of the child’s eventual cognitive ability.
A low MDI was more predictive of cognitive impairment defined using tests of both executive function and IQ, as compared to cognitive impairment based only on IQ. The basis of this finding is unclear but may reflect a higher sensitivity of measures of executive function to complications of preterm birth compared with IQ.(32)
Factors associated with predictive value of the BSID
A larger increase in test scores between 2 and 10 years was found among children born to mothers with pre-pregnancy obesity, male children, and children with impaired motor skills at 2 years. Each of these factors is associated with lower cognitive function.(4, 17, 33, 34) In contrast to a prior study of extremely low birth weight children, we did not find that children with severe brain ultrasound abnormality were less likely to improve from an MDI below 70 to an IQ above 70.(17) As was found in an Australian cohort of extremely low birth weight children,(35) ELGAN Study males exhibited a greater increase in scores on cognitive assessments between 2 years and 10 years, even though they have a higher rate of cognitive impairment at 10 years.(36) Male sex is associated with a higher risk of neonatal morbidities,(37) such as chronic lung disease, that have the potential for delaying development but often resolve during infancy. Conversely, early life risk factors for cognitive impairment that do not tend to resolve, such as fetal growth restriction,(38) cerebral white matter damage,(39) and social disadvantage,(4, 40) were not associated with improvement in cognitive assessment scores between 2 and 10 years.
Two other risk factors for impaired early cognitive function, maternal pre-pregnancy obesity(4, 41) and impaired infant motor function,(17) also were associated with a greater increase in scores on cognitive assessments between 2 years and 10 years. It is plausible that the influence of these factors on brain development diminishes after infancy or that these factors prompt increased utilization of early intervention.(42)
Strengths and Limitations
Strengths of this study include a relatively large sample size, diversity of the sample with respect to sociodemographic attributes, and assessments by individuals who were not aware of children’s prior tests results or medical histories. Study participants who did not return for evaluation were more likely to have indicators of lower socioeconomic status, such as eligibility for public health insurance. The resulting selection bias most likely led to our overestimating the cognitive abilities of the sample. A potential limitation of this study is that early assessments were completed with the second edition of the BSID (BSID-II), rather than the third edition (BSID-III), which is widely used in contemporary trials.(43–45) By simultaneously assessing children with the two editions, we(46) and others(30, 47, 48) have found that average scores on the BSID-III are higher than those on the BSID-II, suggesting that the BSID-III underestimates the degree of developmental delay.(47) However, consensus is lacking on a strategy for making scores from the BSID-II and BSID-III more comparable.(11, 49)
Implications and conclusions
Our findings suggest that caution is appropriate when interpreting findings from clinical trials involving extremely preterm neonates when the BSID is used to ascertain cognitive impairment. For example, in a trial of caffeine for extremely low birth weight neonates, caffeine treatment was associated with a lower risk of MDI < 70 at 18 months adjusted age, but was not associated with a lower risk of IQ < 70 at 5 years of age. (10, 50)
The BSID’s relatively low predictive value positive also is relevant to prognostic predictions for extremely preterm fetuses.(11) Hack and her colleagues have expressed concern that decisions to not provide intensive care for extremely preterm infants in the delivery room might be “biased by reported high rates of cognitive impairments based on the use and presumptive validity of the BSID II MDI.”(17) A hopeful message can be taken from our finding that among infants with a very low MDI (< 55) at two years of age, over one-half had a normal IQ (> 70) and almost one quarter had an IQ ≥ 85 at school age.
Acknowledgments
This study was supported by the National Institute of Neurological Disorders and Stroke (grants 5U01NS040069-05 and 2R01NS040069-09) and the Office of the Director of the National Institutes of Health ((1UG3OD023348-01).
The authors also gratefully acknowledge the contributions of their subjects, and their subjects’ families, as well as those of their colleagues listed below.
Project Lead for ELGAN-2: Julie V. Rollins, MA
Site Principal Investigators
Baystate Medical Center, Springfield, MA: Bhahvesh Shah, MD; Rachana Singh, MD, MS
Boston Children’s Hospital, Boston, MA: Linda Van Marter, MD, MPH and Camilla Martin, MD, MPH; Janice Ware, PhD
Tufts Medical Center, Boston, MA: Cynthia Cole, MD; Ellen Perrin, MD
University of Massachusetts Medical School, Worcester, MA: Frank Bednarek, MD; Jean Frazier, MD
Yale University School of Medicine, New Haven, CT: Richard Ehrenkranz, MD; Jennifer Benjamin, MD
Wake Forest University, Winston-Salem, NC: T. Michael O’Shea, MD, MPH
University of North Carolina, Chapel Hill, NC: Carl Bose, MD; Diane Warner, MD, MPH
East Carolina University, Greenville, NC: Steve Engelke, MD
Helen DeVos Children’s Hospital, Grand Rapids, MI: Mariel Poortenga, MD; Steve Pastyrnak, PhD
Sparrow Hospital, East Lansing, MI: Padu Karna, MD; Nigel Paneth, MD, MPH; Madeleine Lenski, MPH
University of Chicago Medical Center, Chicago, IL: Michael Schreiber, MD; Scott Hunter, PhD; Michael Msall, MC
William Beaumont Hospital, Royal Oak, MI: Danny Batton, MD; Judith Klarr, MD
Site Study Coordinators
Baystate Medical Center, Springfield, MA: Karen Christianson, RN; Deborah Klein, BSM, RN
Boston Children’s Hospital, Boston MA: Maureen Pimental, BA; Collen Hallisey, BA; Taryn Coster, BA
Tufts Medical Center, Boston, MA: Ellen Nylen, RN; Emily Neger, MA; Kathryn Mattern, BA
University of Massachusetts Medical School, Worcester, MA: Lauren Venuti, BA; Beth Powers, RN; Ann Foley, EdM
Yale University School of Medicine, New Haven, CT: Joanne Williams, RN; Elaine Romano, APRN
Wake Forest University, Winston-Salem, NC: Debbie Hiatt, BSN (deceased); Nancy Peters, RN; Patricia Brown, RN; Emily Ansusinha, BA
University of North Carolina, Chapel Hill, NC: Gennie Bose, RN; Janice Wereszczak, MSN; Janice Bernhardt, MS, RN
East Carolina University, Greenville, NC: Joan Adams (deceased); Donna Wilson, BA, BSW
Nancy Darden-Saad, BS, RN
Helen DeVos Children’s Hospital, Grand Rapids, MI: Dinah Sutton, RN; Julie Rathbun, BSW, BSN
Sparrow Hospital, East Lansing, MI: Karen Miras, RN, BSN; Deborah Weiland, MSN
University of Chicago Medical Center, Chicago, IL: Grace Yoon, RN; Rugile Ramoskaite, BA; Suzanne Wiggins, MA; Krissy Washington, MA; Ryan Martin, MA; Barbara Prendergast, BSN, RN
William Beaumont Hospital, Royal Oak, MI: Beth Kring, RN
Psychologists
Baystate Medical Center, Springfield, MA: Anne Smith, PhD; Susan McQuiston, PhD
Boston Children’s Hospital: Samantha Butler, PhD; Rachel Wilson, PhD; Kirsten McGhee, PhD; Patricia Lee, PhD; Aimee Asgarian, PhD; Anjali Sadhwani, PhD; Brandi Henson, PsyD
Tufts Medical Center, Boston MA: Cecelia Keller, PT, MHA; Jenifer Walkowiak, PhD; Susan Barron, PhD
University of Massachusetts Medical School, Worcester MA: Alice Miller, PT, MS; Brian Dessureau, PhD; Molly Wood, PhD; Jill Damon-Minow, PhD
Yale University School of Medicine, New Haven, CT: Elaine Romano, MSN; Linda Mayes, PhD; Kathy Tsatsanis, PhD; Katarzyna Chawarska, PhD; Sophy Kim, PhD; Susan Dieterich, PhD; Karen Bearrs, PhD
Wake Forest University Baptist Medical Center, Winston-Salem NC: Ellen Waldrep, MA; Jackie Friedman, PhD; Gail Hounshell, PhD; Debbie Allred, PhD
University Health Systems of Eastern Carolina, Greenville, NC: Rebecca Helms, PhD; Lynn Whitley, PhD Gary Stainback, PhD
University of North Carolina at Chapel Hill, NC: Lisa Bostic, OTR/L; Amanda Jacobson, PT; Joni McKeeman, PhD; Echo Meyer, PhD
Helen DeVos Children’s Hospital, Grand Rapids, MI: Steve Pastyrnak, PhD
Sparrow Hospital, Lansing, MI: Joan Price, EdS; Megan Lloyd, MA, EdS
University of Chicago Medical Center, Chicago, IL: Susan Plesha-Troyke, OT; Megan Scott, PhD
William Beaumont Hospital, Royal Oak, MI: Katherine M. Solomon, PhD; Kara Brooklier, PhD; Kelly Vogt, PhD
This study was supported by from the Office of the Director, National Institutes of Health (1UG3OD023348-01), the National Institute of Neurological Disorders and Stroke (5U01NS040069-05 and 2R01NS040069-09), and the National Institute of Child Health and Human Development (5P30HD018655-28). Dr. Frazier has the following disclosures: serving on the data safety monitoring board for Forest Pharmaceuticals and receiving research support from Alcobra, Janssen Pharmaceuticals, Neuren, and SyneuRX International. No funds from these entities were used to support this project, and none of these entities reviewed or commented on this study. All other authors declare that they have no financial or ethical conflicts of interest. The authors gratefully acknowledge the contributions of the research participants and their families, as well as those of their colleagues.
Abbreviations
- BSID
Bayley Scales of Infant Development
- MDI
Mental Development Index
- SD
standard deviation
- ELGAN
Extremely Low Gestational Age Newborn
- IQ
Intelligent quotient
- DAS-II
Differential Ability Scales–II
- NEPSY-II
NEuroPSYchological Assessment-II
Footnotes
None of the authors has relevant financial interests, activities, relationships, or affiliations.
References
- 1.O’Shea TM, Allred EN, Dammann O, Hirtz D, Kuban KCK, Paneth N, et al. The ELGAN study of the brain and related disorders in extremely low gestational age newborns. Early Human Development. 2009;85(11):719–25. doi: 10.1016/j.earlhumdev.2009.08.060. [DOI] [PMC free article] [PubMed] [Google Scholar]
- 2.Serenius F, Kallen K, Blennow M, Ewald U, Fellman V, Holmstrom G, et al. Neurodevelopmental Outcome in Extremely Preterm Infants at 2.5 Years After Active Perinatal Care in Sweden. Jama-Journal of the American Medical Association. 2013;309(17):1810–20. doi: 10.1001/jama.2013.3786. [DOI] [PubMed] [Google Scholar]
- 3.Johnson S, Fawke J, Hennessy E, Rowell V, Thomas S, Wolke D, et al. Neurodevelopmental Disability Through 11 Years of Age in Children Born Before 26 Weeks of Gestation. Pediatrics. 2009;124(2):E249–E57. doi: 10.1542/peds.2008-3743. [DOI] [PubMed] [Google Scholar]
- 4.Helderman JB, O’Shea TM, Kuban KCK, Allred EN, Hecht JL, Dammann O, et al. Antenatal Antecedents of Cognitive Impairment at 24 Months In Extremely Low Gestational Age Newborns. Pediatrics. 2012;129(3):494–502. doi: 10.1542/peds.2011-1796. [DOI] [PMC free article] [PubMed] [Google Scholar]
- 5.Tyson JE, Parikh NA, Langer J, Green C, Higgins RD, National Institute of Child H et al. Intensive care for extreme prematurity–moving beyond gestational age. N Engl J Med. 2008;358(16):1672–81. doi: 10.1056/NEJMoa073059. [DOI] [PMC free article] [PubMed] [Google Scholar]
- 6.Marrs CC, Pedroza C, Mendez-Figueroa H, Chauhan SP, Tyson JE. Infant Outcomes after Periviable Birth: External Validation of the Neonatal Research Network Estimator with the BEAM Trial. Am J Perinatol. 2015 doi: 10.1055/s-0035-1569989. [DOI] [PubMed] [Google Scholar]
- 7.Marlow N. Measuring neurodevelopmental outcome in neonatal trials: a continuing and increasing challenge. Arch Dis Child Fetal Neonatal Ed. 2013;98(6):F554–8. doi: 10.1136/archdischild-2012-302970. [DOI] [PubMed] [Google Scholar]
- 8.Morris BH, Oh W, Tyson JE, Stevenson DK, Phelps DL, O’Shea TM, et al. Aggressive vs. conservative phototherapy for infants with extremely low birth weight. New England Journal of Medicine. 2008;359(18):1885–96. doi: 10.1056/NEJMoa0803024. [DOI] [PMC free article] [PubMed] [Google Scholar]
- 9.Schmidt B, Davis P, Moddemann D, Ohlsson A, Roberts RS, Saigal S, et al. Long-term effects of indomethacin prophylaxis in extremely-low-birth-weight infants. N Engl J Med. 2001;344(26):1966–72. doi: 10.1056/NEJM200106283442602. [DOI] [PubMed] [Google Scholar]
- 10.Schmidt B, Roberts R, Davis P, Doyle L, Barrington K, Ohlsson A, et al. Long-term effects of caffeine therapy for apnea of prematurity. N Engl J Med. 2007;357(19):1893–902. doi: 10.1056/NEJMoa073679. [DOI] [PubMed] [Google Scholar]
- 11.Kilbride HW, Aylward GP, Doyle LW, Singer LT, Lantos J. Prognostic neurodevelopmental testing of preterm infants: do we need to change the paradigm? J Perinatol. 2017;37(5):475–9. doi: 10.1038/jp.2017.12. [DOI] [PMC free article] [PubMed] [Google Scholar]
- 12.Munck P, Niemi P, Lapinleimu H, Lehtonen L, Haataja L, Group PS Stability of cognitive outcome from 2 to 5 years of age in very low birth weight children. Pediatrics. 2012;129(3):503–8. doi: 10.1542/peds.2011-1566. [DOI] [PubMed] [Google Scholar]
- 13.Ross G, Lipper EG, Auld PA. Consistency and change in the development of premature infants weighing less than 1,501 grams at birth. Pediatrics. 1985;76(6):885–91. [PubMed] [Google Scholar]
- 14.Bode MM, D’Eugenio DB, Mettelman BB, Gross SJ. Predictive validity of the Bayley, Third Edition at 2 years for intelligence quotient at 4 years in preterm infants. J Dev Behav Pediatr. 2014;35(9):570–5. doi: 10.1097/DBP.0000000000000110. [DOI] [PubMed] [Google Scholar]
- 15.Spencer-Smith MM, Spittle AJ, Lee KJ, Doyle LW, Anderson PJ. Bayley-III Cognitive and Language Scales in Preterm Children. Pediatrics. 2015;135(5):e1258–65. doi: 10.1542/peds.2014-3039. [DOI] [PubMed] [Google Scholar]
- 16.dos Santos E, de Kieviet J, Konigs M, van Elburg R, Oosterlaan J. Predictive value of the Bayley Scales of Infant Development on development of very preterm/very low birth weight children: a meta-analysis. Early Hum Dev. 2013;89:487–96. doi: 10.1016/j.earlhumdev.2013.03.008. [DOI] [PubMed] [Google Scholar]
- 17.Hack M, Taylor HG, Drotar D, Schluchter M, Cartar L, Wilson-Costello D, et al. Poor predictive validity of the Bayley Scales of Infant Development for cognitive function of extremely low birth weight children at school age. Pediatrics. 2005;116(2):333–41. doi: 10.1542/peds.2005-0173. [DOI] [PubMed] [Google Scholar]
- 18.O’Shea TM, Allred EN, Dammann O, Hirtz D, Kuban KC, Paneth N, et al. The ELGAN study of the brain and related disorders in extremely low gestational age newborns. Early Hum Dev. 2009;85(11):719–25. doi: 10.1016/j.earlhumdev.2009.08.060. [DOI] [PMC free article] [PubMed] [Google Scholar]
- 19.Yudkin PL, Aboualfa M, Eyre JA, Redman CWG, Wilkinson AR. New Birth-Weight and Head Circumference Centiles for Gestational Ages 24 to 42 Weeks. Early Human Development. 1987;15(1):45–52. doi: 10.1016/0378-3782(87)90099-5. [DOI] [PubMed] [Google Scholar]
- 20.Teele R, Share J. Ultrasonography of infants and children. Philadelphia: Saunders; 1991. [Google Scholar]
- 21.Kuban K, Adler I, Allred EN, Batton D, Bezinque S, Betz BW, et al. Observer variability assessing US scans of the preterm brain: the ELGAN study. Pediatr Radiol. 2007;37(12):1201–8. doi: 10.1007/s00247-007-0605-z. [DOI] [PMC free article] [PubMed] [Google Scholar]
- 22.Elliott CD. Differential ability scales. second. San Antonio, TX: The Psychological Corporation; 2007. [Google Scholar]
- 23.Korkman M, Kirk U, Kemp S. NEPSY-II, second edition: Clinical and interpretive manual. 2007 [Google Scholar]
- 24.Heeren T, Joseph RM, Allred EN, O’Shea TM, Leviton A, Kuban KCK. Cognitive functioning at age 10 years among children born extremely preterm: A latent profile approach. Pediatr Res. 2017 doi: 10.1038/pr.2017.82. [DOI] [PMC free article] [PubMed] [Google Scholar]
- 25.Fowlie PW. Towards safer diagnosis in clinical practice - understanding and using diagnostic tests in the neonatal unit more appropriately. Semin Fetal Neonatal Med. 2005;10(1):83–90. doi: 10.1016/j.siny.2004.09.002. [DOI] [PubMed] [Google Scholar]
- 26.Palisano R, Rosenbaum P, Walter S, Russell D, Wood E, Galuppi B. Development and reliability of a system to classify gross motor function in children with cerebral palsy. Dev Med Child Neurol. 1997;39(4):214–23. doi: 10.1111/j.1469-8749.1997.tb07414.x. [DOI] [PubMed] [Google Scholar]
- 27.Glas AS, Lijmer JG, Prins MH, Bonsel GJ, Bossuyt PM. The diagnostic odds ratio: a single indicator of test performance. J Clin Epidemiol. 2003;56(11):1129–35. doi: 10.1016/s0895-4356(03)00177-x. [DOI] [PubMed] [Google Scholar]
- 28.Bradley-Johnson S. Cognitive assessment for the youngest children: A critical review of tests. Journal of Psychoeducational Assessment. 2001;19:19–44. [Google Scholar]
- 29.Goldstein D, Folgle E, Weiber J, O’Shea T. Comparison of the Bayley scales of infant development 2nd ed. Bayley scales of infant development with premature infants. J Psychoed Assess. 1995;13:391–6. [Google Scholar]
- 30.Lowe JR, Erickson SJ, Schrader R, Duncan AF. Comparison of the Bayley II Mental Developmental Index and the Bayley III cognitive scale: are we measuring the same thing? Acta Paediatrica. 2012;101(2):E55–E8. doi: 10.1111/j.1651-2227.2011.02517.x. [DOI] [PMC free article] [PubMed] [Google Scholar]
- 31.Black MM,K. Essentials of Bayley Scales of Infant Developmentl-II Assessment. New York, NY: John Wiley & Sons, Inc; 2000. [Google Scholar]
- 32.Orchinik LJ, Taylor HG, Espy KA, Minich N, Klein N, Sheffield T, et al. Cognitive outcomes for extremely preterm/extremely low birth weight children in kindergarten. J Int Neuropsychol Soc. 2011;17(6):1067–79. doi: 10.1017/S135561771100107X. [DOI] [PMC free article] [PubMed] [Google Scholar]
- 33.Pugh SJ, Richardson GA, Hutcheon JA, Himes KP, Brooks MM, Day NL, et al. Maternal Obesity and Excessive Gestational Weight Gain Are Associated with Components of Child Cognition. J Nutr. 2015;145(11):2562–9. doi: 10.3945/jn.115.215525. [DOI] [PMC free article] [PubMed] [Google Scholar]
- 34.Kuban KJ,RM, O’Shea TM, Allred EN, Heeren T, Douglass L, Stafstrom CE, Jara H, Frazier JA, Hirtz D, Leviton A. Extremely Low Gestational AGe newborn (ELGAN) Study Investigators Girls and boys born before 28 weeks gestation: Risks of cognitive, behavioral, and neurological outcomes at age 10 years. J Pediatr. 2016 Mar 19; [E pub ahead of print] [Google Scholar]
- 35.Roberts G, Anderson PJ, Doyle LW. The stability of the diagnosis of developmental disability between ages 2 and 8 in a geographic cohort of very preterm children born in 1997. Archives of Disease in Childhood. 2010;95(10):786–90. doi: 10.1136/adc.2009.160283. [DOI] [PubMed] [Google Scholar]
- 36.Kuban KC, Joseph RM, O’Shea TM, Allred EN, Heeren T, Douglass L, et al. Girls and Boys Born before 28 Weeks Gestation: Risks of Cognitive, Behavioral, and Neurologic Outcomes at Age 10 Years. J Pediatr. 2016;173:69–75. e1. doi: 10.1016/j.jpeds.2016.02.048. [DOI] [PMC free article] [PubMed] [Google Scholar]
- 37.Stevenson DK, Verter J, Fanaroff AA, Oh W, Ehrenkranz RA, Shankaran S, et al. Sex differences in outcomes of very low birthweight infants: the newborn male disadvantage. Arch Dis Child Fetal Neonatal Ed. 2000;83(3):F182–5. doi: 10.1136/fn.83.3.F182. [DOI] [PMC free article] [PubMed] [Google Scholar]
- 38.Streimish IG, Ehrenkranz RA, Allred EN, O’Shea TM, Kuban KCK, Paneth N, et al. Birth weight- and fetal weight-growth restriction: Impact on neurodevelopment. Early Human Development. 2012;88(9):765–71. doi: 10.1016/j.earlhumdev.2012.04.004. [DOI] [PMC free article] [PubMed] [Google Scholar]
- 39.O’Shea TM, Kuban KCK, Allred EN, Paneth N, Pagano M, Dammann O, et al. Neonatal cranial ultrasound lesions and developmental delays at 2 years of age among extremely low gestational age children. Pediatrics. 2008;122(3):E662–E9. doi: 10.1542/peds.2008-0594. [DOI] [PMC free article] [PubMed] [Google Scholar]
- 40.Whitaker AH, Feldman JF, Lorenz JM, Shen S, McNicholas F, Nieto M, et al. Motor and cognitive outcomes in nondisabled low-birth-weight adolescents - Early determinants. Archives of Pediatrics & Adolescent Medicine. 2006;160(10):1040–6. doi: 10.1001/archpedi.160.10.1040. [DOI] [PubMed] [Google Scholar]
- 41.van der Burg JW, Allred EN, Kuban K, O’Shea TM, Dammann O, Leviton A. Maternal obesity and development of the preterm newborn at 2 years. Acta Paediatr. 2015;104(9):900–3. doi: 10.1111/apa.13038. [DOI] [PMC free article] [PubMed] [Google Scholar]
- 42.Watkins S, Jonsson-Funk M, Brookhart MA, Rosenberg SA, O’Shea TM, Daniels J. Preschool motor skills following physical and occupational therapy services among non-disabled very low birth weight children. Matern Child Health J. 2014;18(4):821–8. doi: 10.1007/s10995-013-1306-x. [DOI] [PubMed] [Google Scholar]
- 43.Juul SE, Mayock DE, Comstock BA, Heagerty PJ. Neuroprotective potential of erythropoietin in neonates; design of a randomized trial. Matern Health Neonatol Perinatol. 2015;1:27. doi: 10.1186/s40748-015-0028-z. [DOI] [PMC free article] [PubMed] [Google Scholar]
- 44.Ballard RA, Keller RL, Black DM, Ballard PL, Merrill JD, Eichenwald EC, et al. Randomized Trial of Late Surfactant Treatment in Ventilated Preterm Infants Receiving Inhaled Nitric Oxide. J Pediatr. 2016;168:23–9.e4. doi: 10.1016/j.jpeds.2015.09.031. [DOI] [PMC free article] [PubMed] [Google Scholar]
- 45.Vaucher YE, Peralta-Carcelen M, Finer NN, Carlo WA, Gantz MG, Walsh MC, et al. Neurodevelopmental outcomes in the early CPAP and pulse oximetry trial. N Engl J Med. 2012;367(26):2495–504. doi: 10.1056/NEJMoa1208506. [DOI] [PMC free article] [PubMed] [Google Scholar]
- 46.Silveira RC, Filipouski G, Goldstein D, O’Shea T, Procianoy R. Agreement between Bayley Scales Second and Third Edition Assessments of Very Low Birth Weight Infants. Archives of Pediatrics & Adolescent Medicine. 2012 doi: 10.1001/archpediatrics.2012.732. [DOI] [PubMed] [Google Scholar]
- 47.Anderson PJ, De Luca CR, Hutchinson E, Roberts G, Doyle LW. Underestimation of Developmental Delay by the New Bayley-III Scale. Archives of Pediatrics & Adolescent Medicine. 2010;164(4):352–6. doi: 10.1001/archpediatrics.2010.20. [DOI] [PubMed] [Google Scholar]
- 48.Johnson S, Moore T, Marlow N. Using the Bayley-III to assess neurodevelopmental delay: which cut-off should be used? Pediatr Res. 2014;75(5):670–4. doi: 10.1038/pr.2014.10. [DOI] [PubMed] [Google Scholar]
- 49.Aylward GP. Continuing issues with the Bayley-III: where to go from here. J Dev Behav Pediatr. 2013;34(9):697–701. doi: 10.1097/DBP.0000000000000000. [DOI] [PubMed] [Google Scholar]
- 50.Schmidt B, Anderson PJ, Doyle LW, Dewey D, Grunau RE, Asztalos EV, et al. Survival Without Disability to Age 5 Years After Neonatal Caffeine Therapy for Apnea of Prematurity. Jama-Journal of the American Medical Association. 2012;307(3):275–82. doi: 10.1001/jama.2011.2024. [DOI] [PubMed] [Google Scholar]