

Abstract
Familial risk of ovarian cancer is well-established but whether ovarian cancer clusters with other cancers and the clusters differ by histology remains uncertain. Using data from the Swedish Family-Cancer Database, we explored familial associations of ovarian cancer with other cancers with a novel approach; relative risk for (histology-specific) ovarian cancer was estimated in families with patients affected by other cancers, and conversely, risks for other cancers in families with (histology-specific) ovarian cancer patients. Eight discordant cancers were associated with ovarian cancer risk, of which family history of breast cancer showed a dose-response (P-trend <0.0001). Conversely, risks of eight types of cancer increased in families with ovarian cancer patients, and dose-responses were shown for risks of liver (P-trend = 0.0083) and breast cancers (P-trend <0.0001) and cancer of unknown primary (P-trend = 0.0157). Some cancers were only associated with histology-specific ovarian cancers, e.g. endometrial cancer was only associated with endometrioid type but with highest significance. Novel associations with virus-linked cancers of the nose and male and female genitals were found. The results suggest that ovarian cancer shares susceptibility with a number of other cancers. This might alert genetic counselors and challenge approaches for gene and gene-environment identification.
Introduction
Ovarian cancer is a heterogeneous disease commonly classified into epithelial and non-epithelial types. Histologically, epithelial ovarian cancer includes high-grade serous, low-grade serous, endometrioid, clear cell and mucinous carcinoma1. Non-epithelial ovarian cancer, which accounts for less than 10% of all ovarian cancer cases2, comprises many tumor types such as granulosa cell and germinal malignancies, teratomas, and dysgerminomas; we refer to these as non-epithelial tumors. Distinctive susceptibility to protective and risk factors such as oral contraceptives, endometriosis, and smoking has been observed for different histological types of ovarian cancer3. Furthermore, histology-specific ovarian cancers present different prognoses. For example,patient with high-grade serous ovarian carcinoma always has poor prognosis compared to other types because most patients (∼80%) present with advanced stage at diagnosis1.
It is well-known that family history of ovarian cancer is associated with increased ovarian cancer risk and the relative risk is estimated to be 2.0 to 4.0 when having a first-degree relative affected by ovarian cancer4–8. The most common genes predisposing to ovarian cancer are BRCA1/2, which are associated with high-grade serous histology9,10. Mutations in mismatch repair (MMR) genes, which are responsible for the hereditary nonpolyposis colorectal cancer (HNPCC) syndrome, also contribute to the familial ovarian cancer with a tendency towards endometriod and clear cell histology11,12. Some other moderate and low penetrant genes, including BRIP1, RAD51C and RAD51D may also contribute to ovarian cancer risk13. All high- and moderate risk genes predisposing to ovarian cancer also increase risks for other, i.e. discordant, cancers. For instance, BRCA1/2 mutations predispose to breast, prostate, pancreatic and some other cancers14; MMR gene mutations predispose to colorectal, endometrial and stomach cancers15; and rare PALB2 mutations predispose to breast and prostate cancer16,17. At the population level, discordant associations of ovarian cancer have been observed with breast, endometrial and prostate cancers18–20, and also with some other cancers with lower statistical significance21,22. There are very few studies concerning associations of histological specific ovarian cancer with other cancers and our own work dates a decade back when the Swedish Family-Cancer Database was far from its present size18. Our present study covers 8,850 patients with histological information until the end of 2015, doubling the power of detection compared to the previous study, which included 4,082 such cases18.
The aim of our present study was to explore the familial associations of histology-specific ovarian cancer with other discordant cancers using multiple independent analyses for reliable results. The patient population includes 46,227 ovarian cancer patients and 10,639 other cancer patients who had a family history of ovarian cancer in first degree relatives. Our results should be relevant for genetic counseling, precise treatment and health care for patients with ovarian cancer and may provide clues about shared genetic and/or environmental risk factors.
Results
A total of 46,227 ovarian cancer patients were found in the database, of which 11,301 were diagnosed in the offspring generation at the median age of 63-years-old (Table 1). There were 8,850 ovarian cancer patients in the offspring generation diagnosed since 1993 when Systemized Nomenclature of Medicine (SNOMED) codes were applied, and 11.9% of them were non-epithelial ovarian cancers. In the offspring generation, there were 4526 (40.0%) patients who had one first-degree relative affected by any discordant cancer and 2395 (21.2%) patients had at least two first-degree relatives affected by any discordant cancer. For ovarian cancer alone, there were 467 (4.3%) patients who had one first-degree relative affected by ovarian cancer and 20 (0.2%) patients that had two affected first-degree relatives.
Table 1.
Characteristics of ovarian cancer patients in offspring generation (1958–2015).
| No. of females followed | 4,216,676 | |
| No. of ovarian cancer patients | 11,301 | |
| No. of ovarian cancer patients (1993–2015) | 8850 | |
| Median age at diagnosis of ovarian cancer | 63 years old | |
| No. of ovarian cancer patients with family history of ovarian cancer | In one first-degree relative | 467 (4.3%) |
| In at least two first-degree relatives | 20 (0.2%) | |
| No. of ovarian cancer patients with family history of discordant cancers | In one first-degree relative | 4526 (40.0%) |
| In at least two first-degree relatives | 2395 (21.2%) | |
| Histological types (1993–2015) | Undifferentiated | 193 (2.2%) |
| Clear cell | 511 (5.8%) | |
| Endometrioid | 999 (11.3%) | |
| Serous | 4149 (46.9%) | |
| Mucinous | 726 (8.2%) | |
| Non-epithelial | 1053 (11.9%), 300 of them were thecoma | |
| Others | 1219 (13.8%) | |
Others include histological types of other ovarian cancers such as papillary ovarian cancer, as well as unspecified ovarian cancers.
The principles of the bi-directional analyses are shown in Fig. 1. On the left side, RR is calculated for ovarian cancer (OC); person-years at risk are calculated for all persons in the offspring generation; probands are all first-degree relatives with cancer X. In the reverse analysis, (on the right side) RR is calculated for cancer X when first-degree relatives have ovarian cancer. For parent-offspring generations, the pairs of individuals are independent between the two analyses but for siblings the pairs of individuals are the same and thus not completely independent.
Figure 1.

Flowchart of calculating the RRs for ovarian cancer and cancer X in a two-way analysis. On the left side, RR was calculated for ovarian cancer when family history was cancer X; person-years at risk were calculated for all offspring; probands were all first-degree relatives. On the right side, RR was calculated for cancer X when family history was ovarian cancer. OC: ovarian cancer.
Table 2 shows the invasive ovarian cancer risk when first-degree relatives were diagnosed with ovarian cancer or other cancers and cancer sites with significant results are shown in the forest plot (Fig. 2). The cancer sites with less than 30 cases having affected first-degree relative and insignificant results are not displayed in Table 2 nor in the following Table. The relative risk of ovarian cancer was 2.42 in families with one ovarian cancer patient and it reached 11.36 with two affected first-degree relatives, both of which were significant at a 0.001 level. For discordant cancer, eight cancers showed significant results in the associations with the risk of ovarian cancer. Family history of breast cancer showed a dose-response on ovarian cancer risk (P-trend test <0.001). RR was 1.20 when one first-degree relative was diagnosed with breast cancer (P < 0.001) and RR was 1.47 when two first-degree relatives were affected (P < 0.01). Ovarian cancer risk increased in families with one first-degree relative diagnosed with colorectal (1.06), liver (1.20, P < 0.01), pancreatic (1.14) and endometrial (RR 1.27, P < 0.001) cancers, melanoma (1.12) and cancer of unknown primary (CUP, 1.25 P < 0.001). For liver cancer subtypes (N = 277), we observed increased risk of ovarian cancer in families of patients with gallbladder cancer (N = 95, 34.3% of all liver cancer; RR = 1.27, 95%CI 1.03–1.55; see Supplementary Table S1). Risk of ovarian cancer was found to be elevated in families that had one patient diagnosed with any cancer (1.13), and RR was 1.29 when the families had at least two cancer patients. When only considering the family history of discordant cancers, we found the risk of ovarian cancer was still significantly increased. Statistical power to detect a significant association is shown in Table 2. This is calculated for two-sided confidence level of 95% and an RR of 1.20 for one first-degree relative affected by other cancer and an RR of 1.40 when at least two first-degree relatives were affected. In families of one affected first-degree relative, an 80% power was reached only for colorectal, lung, breast and prostate cancers. In families of more than one first-degree relative affected, no association reached a power of 80% at an RR of 1.4.
Table 2.
Invasive ovarian cancer risk when first-degree relatives were diagnosed with other cancers.
| Cancer site | Patients with 1 FDR | Patients with ≥ 2 FDRs | P-trend | ||||||
|---|---|---|---|---|---|---|---|---|---|
| N | RR | 95%CI | Power (%) RR = 1.2 | N | RR | 95%CI | Power (%) RR = 1.4 | ||
| Ovary | 467 | 2.42 | 2.21–2.66 | 46.6 | 20 | 11.36 | 7.33–17.62 | 8.2 | <0.0001 |
| Upper aerodigestive tract | 239 | 1.08 | 0.95–1.23 | 52.7 | 4 | 1.46 | 0.55–3.90 | 9.1 | 0.1887 |
| Esophagus | 70 | 0.94 | 0.74–1.19 | 22.8 | 0 | — | — | — | 0.6042 |
| Stomach | 349 | 1.08 | 0.97–1.2 | 56.4 | 3 | 0.57 | 0.18–1.76 | 10.5 | 0.2887 |
| Small intestine | 41 | 1.02 | 0.75–1.38 | 16.3 | 1 | 4.07 | 0.57–28.93 | 37.7 | 0.7269 |
| Colorectum | 1009 | 1.06 | 1.00–1.13 | 96.7 | 58 | 1.16 | 0.89–1.50 | 37.7 | 0.0377 |
| Colon | 659 | 1.04 | 0.96–1.13 | 88.3 | 28 | 1.33 | 0.92–1.92 | 22.0 | 0.141 |
| Rectum | 395 | 1.07 | 0.97–1.19 | 69.7 | 10 | 1.48 | 0.80–2.76 | 12.3 | 0.0974 |
| Liver | 277 | 1.20 | 1.06–1.35 | 48.9 | 4 | 1.64 | 0.62–4.38 | 8.6 | 0.0024 |
| Pancreas | 271 | 1.14 | 1.01–1.28 | 50.4 | 2 | 0.70 | 0.18–2.80 | 9.1 | 0.0595 |
| Lung | 655 | 1.05 | 0.97–1.14 | 89.6 | 27 | 1.04 | 0.71–1.52 | 26.3 | 0.2382 |
| Breast | 1243 | 1.20 | 1.14–1.28 | 99.2 | 88 | 1.47 | 1.20–1.82 | 43.8 | <0.0001 |
| Cervix | 184 | 1.14 | 0.98–1.32 | 45.1 | 0 | — | — | — | 0.0862 |
| Endometrium | 317 | 1.27 | 1.14–1.42 | 54.4 | 4 | 1.40 | 0.53–3.73 | 9.0 | <0.0001 |
| Other female genitals | 39 | 0.94 | 0.69–1.29 | 15.0 | 0 | — | — | — | 0.7144 |
| Prostate | 1320 | 1.02 | 0.96–1.08 | 99.6 | 121 | 1.14 | 0.95–1.36 | 56.2 | 0.2174 |
| Testis | 35 | 1.20 | 0.86–1.68 | 23.8 | 1 | 4.37 | 0.62–31.03 | 6.7 | 0.1904 |
| Other male genitals | 30 | 1.74 | 1.21–2.49 | 10.4 | 0 | — | — | — | 0.0056 |
| Kidney | 276 | 1.08 | 0.96–1.22 | 56.2 | 3 | 0.89 | 0.29–2.75 | 9.6 | 0.2458 |
| Bladder | 403 | 0.96 | 0.87–1.06 | 75.5 | 14 | 1.57 | 0.93–2.66 | 13.7 | 0.8195 |
| Melanoma | 339 | 1.12 | 1.00–1.25 | 78.4 | 8 | 1.02 | 0.51–2.04 | 16.1 | 0.0573 |
| Skin | 387 | 0.98 | 0.88–1.08 | 72.4 | 12 | 1.20 | 0.68–2.11 | 14.8 | 0.8309 |
| Nervous system | 279 | 1.08 | 0.96–1.22 | 68.4 | 2 | 0.49 | 0.12–1.97 | 11.3 | 0.2972 |
| Thyroid gland | 75 | 1.04 | 0.83–1.31 | 29.0 | 0 | — | — | — | 0.7147 |
| Endocrine glands | 148 | 0.97 | 0.83–1.14 | 45.5 | 1 | 0.72 | 0.10–5.10 | 8.2 | 0.6948 |
| Connective tissue | 61 | 1.06 | 0.83–1.37 | 21.9 | 0 | — | — | — | 0.6436 |
| Non-Hodgkin lymphoma | 296 | 1.08 | 0.96–1.21 | 63.6 | 5 | 1.27 | 0.53–3.05 | 10.5 | 0.1882 |
| Hodgkin lymphoma | 52 | 1.28 | 0.97–1.68 | 20.0 | 0 | — | — | — | 0.0887 |
| Myeloma | 141 | 1.07 | 0.90–1.26 | 33.6 | 0 | — | — | — | 0.4464 |
| Leukemia | 250 | 0.99 | 0.87–1.12 | 60.7 | 2 | 0.50 | 0.13–2.01 | 10.4 | 0.6704 |
| CUP | 396 | 1.25 | 1.13–1.38 | 62.4 | 4 | 1.08 | 0.40–2.87 | 10.0 | <0.0001 |
| All cancersa | 4553 | 1.13 | 1.09–1.18 | 100.0 | 2589 | 1.29 | 1.23–1.36 | 100.0 | <0.0001 |
| All cancersb | 4340 | 1.10 | 1.06–1.15 | 100.0 | 2315 | 1.20 | 1.14–1.27 | 100.0 | <0.0001 |
FDR: first-degree relative; CUP: cancer of unknown primary.
Bolding, italic and underlining indicate that the 95% CI, 99% CI and 99.9% CI did not overlap with 1.00 respectively.
aall cancers include ovarian cancers and all other cancers.
ball cancers include all other cancers except ovarian cancer.
Figure 2.
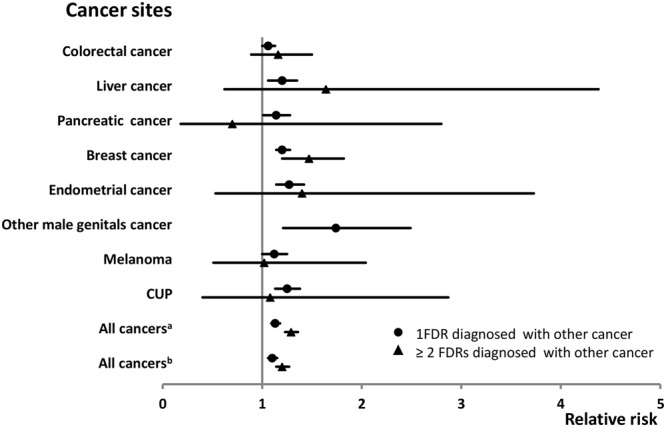
Ovarian cancer risk when only one or at least two first-degree relatives were diagnosed with other cancers. Only significant cancer sites are shown. CUP: cancer of unknown primary; aall cancers include ovarian cancers and all other cancers; ball cancers include all other cancers except ovarian cancer. FDR, first-degree relative.
In the reverse comparison, the overall cancer risk in the offspring generation increased when having a family history of ovarian cancer (Table 3). All the significant cancer sites are displayed in Fig. 3. The estimated RR was 1.12 (P < 0.001) in families of one first-degree relative affected by ovarian cancer and it was 1.49 (P < 0.001) when at least two were affected. Excluding ovarian cancer, the RRs for any other cancer were 1.09 (P < 0.001) and 1.31(P < 0.01), respectively. Five cancers (colorectal, liver, breast, endometrial cancers and CUP) were observed with significant results in the two-way comparison and family history of ovarian cancer showed dose-response effect on the risk of liver and breast cancers and CUP. Notably, when at least two first-degree relatives were diagnosed with ovarian cancer, the relative risk for Hodgkin lymphoma reached 4.11 (P < 0.01). However, that association was based on two families. Elevated risks were also observed for lung (1.10) and prostate (1.06) cancer when one first-degree relative was affected by ovarian cancer. Risk of esophageal (0.76) cancer declined in families with one first-degree relative diagnosed with ovarian cancer. In families of one first-degree relative diagnosed with ovarian cancer, an 80% power (RR of 1.2) was reached by colorectal, lung, breast and prostate cancers and by melanoma. In families with more than one first-degree relative affected, no association reached a power of 80% (1.4).
Table 3.
Other cancer risk when first-degree relatives were diagnosed with invasive ovarian cancer.
| Cancer site | Patients with 1 FDR | Patients with ≥2 FDRs | P-trend | ||||||
|---|---|---|---|---|---|---|---|---|---|
| N | RR | 95%CI | Power (%) RR = 1.2 | N | RR | 95%CI | Power (%) RR = 1.4 | ||
| Upper aerodigestive tract | 220 | 1.02 | 0.89–1.17 | 49.3% | 3 | 1.32 | 0.43–4.09 | 8.5 | 0.7011 |
| Esophagus | 52 | 0.76 | 0.58–1.00 | 20.5 | 1 | 1.29 | 0.18–9.16 | 6.6 | 0.0552 |
| Stomach | 134 | 1.11 | 0.94–1.32 | 31.3 | 3 | 2.29 | 0.74–7.10 | 7.4 | 0.1435 |
| Small intestine | 54 | 1.29 | 0.98–1.68 | 15.4 | 0 | — | — | — | 0.0793 |
| Colorectum | 884 | 1.07 | 1.00–1.15 | 95.1 | 6 | 0.70 | 0.31–1.56 | 13.4 | 0.0708 |
| Colon | 552 | 1.06 | 0.98–1.16 | 83.0 | 2 | 0.38 | 0.09–1.50 | 11.1 | 0.2651 |
| Rectum | 332 | 1.09 | 0.97–1.21 | 61.1 | 4 | 1.23 | 0.46–3.27 | 9.2 | 0.1264 |
| Liver | 167 | 1.20 | 1.03–1.40 | 35.2 | 4 | 2.66 | 1.00–7.10 | 7.6 | 0.0083 |
| Pancreas | 157 | 0.97 | 0.82–1.13 | 38.9 | 2 | 1.14 | 0.28–4.54 | 7.8 | 0.6918 |
| Lung | 634 | 1.10 | 1.01–1.19 | 85.4 | 5 | 0.80 | 0.33–1.92 | 11.4 | 0.0320 |
| Breast | 1981 | 1.24 | 1.19–1.30 | 99.9 | 30 | 2.13 | 1.49–3.05 | 19.5 | <0.0001 |
| Cervix | 165 | 1.08 | 0.92–1.26 | 43.3 | 2 | 1.65 | 0.41–6.61 | 7.9 | 0.3036 |
| Endometrium | 304 | 1.22 | 1.09–1.36 | 53.8 | 2 | 0.86 | 0.21–3.44 | 8.5 | 0.0014 |
| Uterusc | 6 | 2.63 | 1.16–5.95 | 5.6 | 0 | — | — | — | 0.0439 |
| Other female genitals | 27 | 0.89 | 0.61–1.30 | 13.0 | 0 | — | — | — | 0.5488 |
| Prostate | 1727 | 1.05 | 1.00–1.10 | 99.9 | 29 | 1.40 | 0.97–2.01 | 20.2 | 0.0149 |
| Testis | 117 | 1.15 | 0.95–1.37 | 38.0 | 0 | — | — | — | 0.1551 |
| Other male genitals | 22 | 1.16 | 0.76–1.77 | 10.1 | 0 | — | — | — | 0.5002 |
| Kidney | 226 | 1.10 | 0.96–1.25 | 48.4 | 5 | 2.30 | 0.96–5.53 | 8.4 | 0.0905 |
| Bladder | 333 | 0.99 | 0.89–1.10 | 64.7 | 4 | 1.07 | 0.40–2.85 | 9.5 | 0.8401 |
| Melanoma | 628 | 1.07 | 0.99–1.16 | 89.7 | 7 | 1.29 | 0.62–2.71 | 12.1 | 0.0645 |
| Skin | 333 | 1.06 | 0.95–1.18 | 62.5 | 2 | 0.62 | 0.16–2.49 | 9.3 | 0.3549 |
| Nervous system | 380 | 1.04 | 0.94–1.15 | 77.9 | 3 | 0.89 | 0.29–2.77 | 10.6 | 0.4900 |
| Thyroid gland | 111 | 1.11 | 0.92–1.34 | 31.7 | 1 | 1.18 | 0.17–8.35 | 7.4 | 0.2767 |
| Endocrine glands | 193 | 1.01 | 0.88–1.16 | 48.0 | 2 | 1.13 | 0.28–4.51 | 8.4 | 0.8776 |
| Connective tissue | 70 | 1.01 | 0.79–1.28 | 23.0 | 0 | — | — | — | 0.4857 |
| Non-Hodgkin lymphoma | 327 | 1.11 | 0.99–1.24 | 63.2 | 3 | 0.99 | 0.32–3.08 | 9.4 | 0.0751 |
| Hodgkin lymphoma | 71 | 1.20 | 0.95–1.51 | 25.0 | 2 | 4.11 | 1.03–16.46 | 7.0 | 0.0732 |
| Myeloma | 107 | 1.09 | 0.90–1.32 | 26.5 | 0 | — | — | — | 0.3765 |
| Leukemia | 248 | 0.98 | 0.86–1.11 | 63.4 | 3 | 1.22 | 0.39–3.79 | 9.4 | 0.8095 |
| CUP | 227 | 1.14 | 1.00–1.30 | 45.8 | 6 | 2.81 | 1.26–6.26 | 8.3 | 0.0157 |
| All cancersa | 10492 | 1.12 | 1.10–1.14 | 100.0 | 147 | 1.49 | 1.27–1.75 | 68.7 | <0.0001 |
| All cancersb | 10025 | 1.09 | 1.07–1.11 | 100.0 | 127 | 1.31 | 1.10–1.56 | 67.9 | <0.0001 |
FDR: first-degree relative; CUP: cancer of unknown primary.
Bolding, italic and underlining indicate that the 95% CI, 99% CI and 99.9% CI did not overlap with 1.00 respectively.
aall cancers include ovarian cancers and all other cancers.
ball cancers include all other cancers except ovarian cancer.
ccancer of other parts of uterus, including chorionepithelioma.
Figure 3.
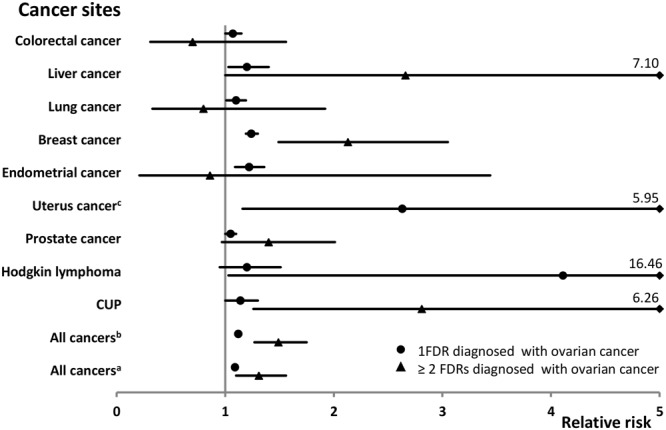
Other cancer risk when only one or at least two first-degree relatives were diagnosed with ovarian cancer. Only significant cancer sites are shown. CUP: cancer of unknown primary; aall cancers include ovarian cancers and all other cancers; ball cancers include all other cancers except ovarian cancer. FDR, first-degree relative; ccancer of other parts of uterus, including chorionepithelioma.
In the search of the familial associations of histology-specific ovarian cancer with other cancers, some significant results were observed (Table 4; note that both of the two-way comparisons are shown). The significant pairs (histology type-cancer site) in the two-way analysis were clear cell-pancreas (joint P < 0.0025), endometrioid-nose (joint P < 0.0025), endometrioid-breast (joint P < 0.0005), endometrioid- endometrium (joint P < 10−6), serous-breast (joint P < 10−6), serous-male genitals (joint P < 5 × 10⁻⁵), mucinous-gallbladder (joint P < 10−4; see Supplementary Table S2). For the above pair ‘endometrioid-endometrium’, 40 of 999 patients with endometrioid ovarian cancer were diagnosed within five months with endometrial cancer thus resulting in an RR of 9.49 (6.96–12.95) for endometrial cancer compared to the risk of first endometrial cancer. Conversely, 164 patients were diagnosed with ovarian cancer among the 12,294 patients with endometrial cancer, and 76 of these were of endometrioid histology; more than half of these were diagnosed in the same month as those with endometrial cancer. The RR of endometrioid ovarian cancer after endometrial cancer was 20.30 (15.92–25.90, see Supplementary Table S3). For the pair endometrioid-nose, the available histology for cancer of nose included two squamous cell carcinomas and one adenocarcinomas. Of note, results for non-epithelial ovarian cancer were all based on a small number of cases.
Table 4.
Familial associations of histology-specific ovarian cancer with other cancers.
| Histology | Cancer site | Risk of ovarian cancer | Risk of other cancer | ||||||
|---|---|---|---|---|---|---|---|---|---|
| N | RR | 95% CI | Power (%) RR = 1.4 | N | RR | 95% CI | Power (%) RR = 1.4 | ||
| Undifferentiated | Stomach | 11 | 1.95 | 1.06–3.60 | 53.4 | 2 | 1.65 | 0.41–6.61 | 8.3 |
| Liver | 8 | 2.00 | 0.99–4.06 | 46.7 | 4 | 2.76 | 1.04–7.36 | 8.8 | |
| Pancreas | 5 | 1.16 | 0.48–2.81 | 48.2 | 7 | 4.07 | 1.94–8.55 | 9.2 | |
| Lung | 17 | 1.48 | 0.90–2.44 | 86.3 | 11 | 1.85 | 1.02–3.34 | 14.8 | |
| Hodgkin lymphoma | 3 | 4.35 | 1.39–13.61 | 20.9 | 1 | 2.35 | 0.33–16.71 | 7.2 | |
| Clear cell | Pancreas | 18 | 1.69 | 1.05–2.70 | 51.9 | 7 | 2.23 | 1.06–4.68 | 11.1 |
| Testis | 3 | 2.19 | 0.70–6.81 | 26.3 | 6 | 3.94 | 1.77–8.76 | 9.7 | |
| Endometrioid | Stomach | 35 | 1.25 | 0.89–1.75 | 63.2 | 11 | 2.15 | 1.19–3.88 | 13.8 |
| Nose | 4 | 3.08 | 1.15–8.21 | 12.1 | 2 | 4.02 | 1.00–16.10 | 7.0 | |
| Lung | 58 | 0.98 | 0.75–1.28 | 93.3 | 37 | 1.43 | 1.04–1.97 | 35.1 | |
| Breast | 121 | 1.24 | 1.02–1.49 | 99.6 | 94 | 1.35 | 1.10–1.65 | 67.3 | |
| Endometrium | 49 | 2.22 | 1.67–2.96 | 61.0 | 22 | 2.04 | 1.34–3.09 | 20.3 | |
| Other female genitals | 6 | 1.65 | 0.74–3.69 | 18.7 | 4 | 3.08 | 1.16–8.22 | 8.5 | |
| Kidney | 34 | 1.50 | 1.07–2.12 | 63.1 | 12 | 1.41 | 0.80–2.49 | 18.2 | |
| Connective tissue | 8 | 1.54 | 0.77–3.09 | 26.7 | 6 | 2.53 | 1.13–5.63 | 10.8 | |
| Serous | Breast | 515 | 1.27 | 1.15–1.39 | 100.0 | 373 | 1.24 | 1.12–1.38 | 58.9 |
| Other male genitals | 12 | 1.87 | 1.06–3.29 | 18.3 | 8 | 2.42 | 1.20–4.85 | 11.6 | |
| Thyroid gland | 38 | 1.42 | 1.03–1.96 | 53.9 | 14 | 0.89 | 0.53–1.51 | 27.5 | |
| CUP | 134 | 1.23 | 1.04–1.47 | 87.6 | 39 | 1.06 | 0.77–1.45 | 47.2 | |
| Mucinous | Upper aerodigestive tract | 23 | 1.73 | 1.14–2.63 | 56.7 | 11 | 1.70 | 0.94–3.08 | 16.5 |
| Nose | 3 | 3.43 | 1.10–10.67 | 11.7 | 0 | — | — | — | |
| Breast | 83 | 1.23 | 0.98–1.54 | 99.4 | 67 | 1.38 | 1.08–1.75 | 58.9 | |
| Bladder | 37 | 1.46 | 1.05–2.04 | 60.1 | 11 | 1.15 | 0.64–2.08 | 16.2 | |
| Non-epithelial | Thyroid gland | 5 | 2.82 | 1.17–6.48 | 29.9 | 1 | 1.20 | 0.17–8.50 | 8.3 |
| Connective tissue | 5 | 3.69 | 1.52–8.94 | 23.2 | 1 | 1.81 | 0.25–12.84 | 7.7 | |
| Non-Hodgkin lymphoma | 6 | 0.90 | 0.40–2.02 | 61.7 | 7 | 2.72 | 1.30–5.71 | 12.3 | |
| CUP | 14 | 2.25 | 1.31–3.86 | 56.0 | 3 | 1.66 | 0.54–5.15 | 10.6 | |
CUP: cancer of unknown primary.
Bolding, italic and underlining indicate that the 95% CI, 99% CI and 99.9% CI did not overlap with 1.00 respectively.
aall cancers include ovarian cancers and all other cancers.
ball cancers include all other cancers except ovarian cancer.
Table 5 displays familial association of histology-specific ovarian cancer with any cancer. Undifferentiated, endometrioid, serous and mucinous ovarian cancers were significantly associated with any cancers, among which undifferentiated (joint P < 0.0025), endometrioid (joint P < 10−6) and serous (joint P < 5 × 10⁻⁵) types showed significant associations in the two-way comparison. After omitting ovarian cancer, results for endometrioid, serous and mucinous types were still significant in the associations with any discordant cancers and the association of endometrioid carcinoma was significant in the two-way comparison (joint P < 10−5).
Table 5.
Familial associations of histology-specific ovarian cancer with any cancer.
| Histology | Cancer site | Risk of ovarian cancer | Risk of other cancer | ||||||
|---|---|---|---|---|---|---|---|---|---|
| N | RR | 95% CI | Power (%) RR = 1.4 | N | RR | 95% CI | Power (%) RR = 1.4 | ||
| Undifferentiated | All cancersa | 134 | 1.45 | 1.07–1.97 | 37.3 | 119 | 1.23 | 1.03–1.48 | 82.6 |
| All cancersb | 116 | 1.29 | 0.94–1.77 | 36.9 | 110 | 1.16 | 0.96–1.40 | 81.9 | |
| Clear cell | All cancersa | 302 | 0.99 | 0.82–1.18 | 84.8 | 168 | 1.01 | 0.87–1.18 | 96.2 |
| All cancersb | 287 | 0.96 | 0.80–1.15 | 84.2 | 161 | 0.99 | 0.85–1.16 | 95.9 | |
| Endometrioid | All cancersa | 675 | 1.41 | 1.23–1.61 | 95.7 | 477 | 1.21 | 1.11–1.32 | 100.0 |
| All cancersb | 627 | 1.34 | 1.17–1.54 | 95.4 | 448 | 1.16 | 1.06–1.27 | 100.0 | |
| Serous | All cancersa | 2663 | 1.19 | 1.12–1.27 | 100.0 | 1781 | 1.04 | 1.00–1.09 | 100.0 |
| All cancersb | 2448 | 1.13 | 1.04–1.23 | 100.0 | 1711 | 1.02 | 0.98–1.07 | 100.0 | |
| Mucinous | All cancersa | 439 | 1.19 | 1.02–1.38 | 93.6 | 290 | 1.05 | 0.94–1.18 | 99.9 |
| All cancersb | 421 | 1.17 | 1.00–1.37 | 93.2 | 278 | 1.03 | 0.91–1.16 | 99.9 | |
| Non-epithelial | All cancersa | 159 | 1.00 | 0.79–1.27 | 69.6 | 80 | 1.03 | 0.83–1.28 | 88.8 |
| All cancersb | 154 | 1.00 | 0.79–1.27 | 68.9 | 76 | 1.00 | 0.80–1.25 | 88.2 | |
Bolding, italic and underlining indicate that the 95% CI, 99% CI and 99.9% CI did not overlap with 1.00 respectively.
aall cancers include ovarian cancers and all other cancers.
ball cancers include all other cancers except ovarian cancer.
Discussion
With novel insight from our bi-directional statistical analyses, we found that ovarian cancer was associated with a group of discordant cancers, among which colorectal, breast, endometrial and liver cancers and CUP were significant in the two-way analysis. As the present study involves multiple comparisons we require, for credible familial associations, that more than a single analysis should be positive and RRs should show a ‘dose-response’ relationship, i.e. increase by the number of affected probands. For guidance, we use the joint P-values. Breast cancer showed four significant RRs, of which three were at a 0.1% confidence level; liver cancer and CUP showed three increased RRs, and colorectal and endometrial cancers showed two RRs. For endometrial cancer, the two RRs were both significant at 0.001 levels. Cancer in other male genitals showed a single significant RR at a 1% confidence level. The remaining cancers, including lung and prostate cancers, melanoma and Hodgkin lymphoma showed a single nominal significance. The association of ovarian cancer with breast cancer showed dose-response in the two-way comparison, and the ones with liver cancer and CUP showed dose-response in the one-way analysis. The ‘dose-response’ observation in RRs would support the findings and it is informative of the underlying genetic risk (penetrance) as many first-degree relatives diagnosed with the same cancers signal high penetrance.
Ovarian cancer showed the strongest association with breast cancer (joint P < 10−11) and it may be attributable to BRCA1/2 mutations as in the histological analysis breast cancer was associated with serous ovarian carcinomas, which have been reported to be related to BRCA1/2 mutations9,10. BRCA2 carriers have an increased risk of prostate cancer14,23, but one weak association was shown here. BAP1 mutations manifest eye and cutaneous melanomas, ovarian cancers and several other cancers, and these may contribute to the associations with eye cancer (one of two was melanoma) and the weakly increased risk with cutaneous melanoma in Table 123,24. In our study, the association of ovarian cancer with colorectal cancer was weak and no significant associations were observed with endometrioid or clear cell ovarian cancers, which may not support the HNPCC link. By contrast, we found that endometrioid ovarian cancer was strongly associated with endometrial cancer in the two-way comparison, which could imply association with HNPCC syndrome related to MSH6 mutations in patients with the endometrioid and clear cell ovarian carcinomas25. Carriers with MSH6 germline mutations appear to have a high risk of endometrial cancer but low risk of colorectal cancer26.
Ovarian cancer is a heterogeneous disease and different histological types of ovarian cancer have distinctive risk factors, genetic characteristics and prognosis. Accordingly, our results of histology-based analysis suggest that some specific histological types are associated only with specific cancers. Endometrial cancer was only associated with endometrioid ovarian cancer and this pair showed the most significance (RR > 2.00, joint P < 10−6) among all the histology-based associations. Most endometrioid ovarian cancers were synchronous with endometrial cancer, which suggests these two cancers share common risk factors. Furthermore, breast cancer was associated with many histological types of epithelial ovarian cancers (endometrioid, serous and mucinous) with homogenous RRs between 1.20–1.40; this may suggest that different epithelial ovarian cancers share the similar risks with breast cancer. Smoking is a risk factor of mucinous ovarian cancer and, accordingly, the associated cancers were mostly smoking-related, including cancers in upper aerodigestive tract, nose, breast, bladder and gallbladder3. The most consistent association of lung cancer was found with undifferentiated ovarian cancer.
Ovarian cancer was associated with liver cancer in the two-way comparison (joint P < 2.5 × 10⁻⁵). As liver cancer in the 7th revision of International Classification of Diseases (ICD-7) encompasses cancers in primary liver, gallbladder, extrahepatic bile ducts and ampulla of vater, we performed subtype analyses for liver cancer. The only significant association was with gallbladder cancer, and notably, with mucinous ovarian cancers in the two-way comparison. Some common risk factors, such as smoking and obesity, may contribute to the association between ovarian cancer and gallbladder cancer3,27,28.
We found some curious associations with rare cancers most notably with cancer of the nose, which showed a two-way association with endometrioid ovarian cancer and a one-way association with mucinous ovarian cancer. Some known risk factors for cancer of the nose, such as smoking and wood dust exposure, are an unlikely explanation for this finding29. However, Epstein-Barr virus infection, particularly in transiently immunocompromised individuals, has been associated with cancer of the nose and this may be a plausible explanation for the present findings30,31. The other rare cancers associating with ovarian cancer were male and female genital cancers; the common denominator for which is squamous cell histology and human papilloma virus infection etiology30,32,33. An increased risk of Hodgkin lymphoma, another Epstein-Barr virus related cancer, was observed in two families for each with two or more patients with ovarian cancer30. A note of caution is warranted as the number of cases with family history was small and this number of virally related cancers can be associated with ovarian cancer by chance. Nevertheless, this is an interesting finding and can be a guidance for further study. Some possible mechanisms could be socioeconomic factors and pro-inflammatory effects of obesity34.
CUP is a fatal cancer which is diagnosed at a metastatic stage and no primary site can be found. Familial association of CUP with many primary cancers, including ovarian cancer, was reported previously35. In that report we hypothesized that the primary cancers in family members of CUP patients would indicate the location of the primary cancer from which CUP was originating. In the present study, ovarian cancer was associated with CUP in the two-way comparison (joint P < 2.5 × 10⁻⁶); the previous hypothesis predicted that the primary site for CUP may be the ovary.
Non-epithelial malignancies of the ovary account for around 10% of all ovarian cancers in our database and the risk factors and genetic characteristics of non-epithelial ovarian cancer are poorly understood2. In our study, non-epithelial ovarian cancers were associated with thyroid gland and connective tissue cancers, non-Hodgkin lymphoma and CUP, but the associations were based on a single significant RR each.
The main limitation of this study is that the patients with identifiable histology were diagnosed only after 1993 since the introduction of ICD-O/2 in the cancer registry. This affects familial risk estimates because 22 years of follow-up is short for intergenerational studies considering risks of both the parental and offspring generations. Furthermore, histological classification has not been updated to meet the current guidelines. For example, serous histology is now considered to be either low-grade or high-grade with different prognoses and molecular events/etiologies. Although, to the best of our knowledge, this study on familial associations between ovarian cancer with other cancers had the largest sample size ever reported, the data lack sufficient power in many comparisons. As indicated in the tables, only a few associations had 80% or higher power to detect significant results. This also limits use of techniques such as the Bonferroni correction in adjustments for multiple testing, as has been discussed36. Insufficient clinico-behavioral information, such as smoking, is also a caveat in the analysis since they can be construed as potential confounders. However, as we adjusted the data for socioeconomic factors, this reduces greatly the possible confounding by smoking37. We have no genetic information for the ovarian cancer patients and the explanation for associations between cancers are based on speculation, which should be considered with caution.
In summary, discordant cancers were by far more common (61.2%) in ovarian cancer families than multiple ovarian cancers (4.5%). We found that ovarian cancer was associated with a group of discordant cancers, among which colorectal, breast, endometrial and liver cancers and CUP were significant in the two-way analysis. Some cancers were only associated with specific histological types of ovarian cancers; for example endometrial cancer was only significant with endometrioid types, and breast cancer was associated with endometrioid, serous and mucinous with homogenous familial risks. The novel associations with cancer of nose and that of male and female genitals were noted but the common etiological mechanism remains to be established. Our results should have implications for genetic counseling, and they may provide clues about shared genetic and/or environmental risk factors of ovarian cancer with other cancers.
Methods
The Swedish Family-Cancer Database is the combination of the Multigeneration Register, national Cancer Registry (started in 1958), national censuses and Cause of Death Register. It includes all Swedish residents born after 1931 (offspring generation) and their biological parents (parental generation). The latest version of the Swedish Family-Cancer Database contains 16.1 million individuals among which almost 2.0 million were cancer patients recorded to the end of 2015.
Most common primary cancers (35) and CUP were identified with the 3-digital codes of ICD-7. According to SNOMED codes which were available in the database since 1993, “80203” was classified as undifferentiated ovarian cancer, “83103” as clear cell, “83803” as endometrioid, “84413” and “84603” as serous, “84703” as mucinous, and “86203” as thecoma. Thecoma was used to represent non-epithelial ovarian cancer. The follow-up for cancer in offspring generation commenced from the beginning of 1958 (for histological analysis it was the beginning of 1993), the birth year, or the immigration year, whichever came latest. The follow-up was terminated when a person was diagnosed with cancer, emigrated or died, or at the end of 2015, whichever came first.
All patients had a complete family history (including both parents) and cancer data with full diagnostic detailed collected by the Cancer Registry. The number of first-degree relatives (parents and/or siblings) who were affected with cancer was considered as the family history. Relative risks (RRs), calculated for the offspring generation, were used as a measure of assessing familial risks by comparing incidence rates for persons with affected relatives to incidence rates for those whose relatives had no cancer. In the two-way comparison (Fig. 1), firstly, RR for ovarian cancer (or specific histological ovarian cancer) was calculated when family history was discordant cancer X, and then in the reverse order RR for cancer X was calculated when family history was ovarian cancer (or specific histological ovarian cancer). For parents and offspring (large majority of familial cases) these comparisons are independent but for siblings the pairs of cases are the same. Significant results in two-way analyses provide support for a true association but a lacking two-way association is not strong evidence against an association because age distributions and case numbers may differ between two-way analyses.
Poisson regression model was employed to estimate RRs and corresponding confidence intervals (CI) at 5%, 1% and 0.1% significance levels. These can be combined to calculate a joint significance for non-dependent associations; for example if the significant levels of two independent associations are 0.05 and 0.01, the joint significance is 0.000538. Studies with multiple testing require statistical approaches to distinguish likely true associations from chance findings resulting from multiple tests, as has been described earlier39. In our study, we use different significance levels and joint p-values in order to differentiate the likely true associations from likely chance findings. We want to point out that the joint significance is used as a guidance for a Bonferroni-type adjustment as hundreds of comparisons were done. A single 95%CI is not very informative in the context of multiple comparisons. Statistical power was calculated to detect a significant association for two-sided 95% confidence level with an RR of 1.20 for one affected first-degree relative and an RR of 1.40 for at least two affected first-degree relatives. In the power calculation for bladder cancer and histology subtype analysis, the RR was set as 1.4. Trend tests were performed by modeling the number of first-degree relatives affected by cancer X as a continuous covariate. Potential confounders, including age group (17 groups with 5-year gap), sex, calendar period, residential area and socioeconomic status as well as parity for ovarian cancer risk, were added to the model as covariates. SAS version 9.4 was used to perform the statistical analysis.
Ethical Statement
The study was approved by the Ethical Committee of Lund University without requirement for informed consent, and the study was conducted in accordance with the approved guidelines.
Data Availability Statement
The data that support the findings of this study are available from Lund University but restrictions apply to the availability of these data, which were used under license for the current study and so are not publicly available.
Electronic supplementary material
Supplementary Table S1 Familial associations of ovarian cancer with liver cancers
Supplementary Table S2 Familial associations of histology-specific ovarian cancers with gall bladder cancer
Supplementary Table S3 Risk of endometrioid ovarian cancer after diagnosis of endometrial cancer and risk of endometrial cancer after diagnosis of endometrioid ovarian cancer
Acknowledgements
We thank Patrick Reilly for language editing. This work was funded by the German Cancer Aid, and the Swedish Research Council for Health, Working Life and Welfare (in Swedish: FORTE; Reg. no. 2013–1836), and FORTE (Reg. no. 2014–0804) and the Swedish Research Council (2012–2378 and 2014–10134), and ALF funding from Region Skåne as well as by the China Scholarship Council (201606100057, for doctoral student G.Z.).
Author Contributions
K.H. proposed the research conception and study design. K.S., K.H., G.Z. and H.Y. contributed to the collection and assembly of data. G.Z., K.H., A.K. and A.F. are responsible for the data analysis and interpretation. G.Z. and K.H. completed the draft of the manuscript and the final manuscript was reviewed and approved by all authors. All authors are accountable for all aspects of the work.
Competing Interests
The authors declare no competing interests.
Footnotes
Electronic supplementary material
Supplementary information accompanies this paper at 10.1038/s41598-018-29888-4.
Publisher's note: Springer Nature remains neutral with regard to jurisdictional claims in published maps and institutional affiliations.
References
- 1.Prat J. New insights into ovarian cancer pathology. Annals of oncology: official journal of the European Society for Medical Oncology. 2012;23(Suppl 10):x111–117. doi: 10.1093/annonc/mds300. [DOI] [PubMed] [Google Scholar]
- 2.Alifrangis, C. & Seck, M. J. In Ovarian Cancers: Advances through International Research Cooperation (GINECO, ENGOT, GCIG) (eds Eric Pujade-Lauraine, Isabelle Ray-Coquard, & Fabrice Lécuru) 247–259 (Springer International Publishing, 2017).
- 3.Wentzensen N, et al. Ovarian cancer risk factors by histologic subtype: an analysis from the ovarian cancer cohort consortium. Journal of Clinical Oncology. 2016;34:2888–2898. doi: 10.1200/JCO.2016.66.8178. [DOI] [PMC free article] [PubMed] [Google Scholar]
- 4.Frank C, Sundquist J, Yu H, Hemminki A, Hemminki K. Concordant and discordant familial cancer: Familial risks, proportions and population impact. International journal of cancer. 2017;140:1510–1516. doi: 10.1002/ijc.30583. [DOI] [PubMed] [Google Scholar]
- 5.Hemminki K, Granström C. Familial invasive and borderline ovarian tumors by proband status, age and histology. International journal of cancer. 2003;105:701–705. doi: 10.1002/ijc.11151. [DOI] [PubMed] [Google Scholar]
- 6.Hemminki K, Sundquist J, Brandt A. Incidence and mortality in epithelial ovarian cancer by family history of any cancer. Cancer. 2011;117:3972–3980. doi: 10.1002/cncr.26016. [DOI] [PubMed] [Google Scholar]
- 7.Teerlink CC, Albright FS, Lins L, Cannon-Albright LA. A comprehensive survey of cancer risks in extended families. Genetics in Medicine. 2012;14:107–114. doi: 10.1038/gim.2011.2. [DOI] [PubMed] [Google Scholar]
- 8.Jervis, S. et al. Ovarian cancer familial relative risks by tumour subtypes and by known ovarian cancer genetic susceptibility variants. Journal of medical genetics, jmedgenet-2013–102015 (2013). [DOI] [PubMed]
- 9.Lakhani SR, et al. Pathology of Ovarian Cancers in BRCA1 and BRCA2 Carriers. Clinical Cancer Research. 2004;10:2473–2481. doi: 10.1158/1078-0432.CCR-1029-3. [DOI] [PubMed] [Google Scholar]
- 10.Pal T, et al. BRCA1 and BRCA2 mutations account for a large proportion of ovarian carcinoma cases. Cancer. 2005;104:2807–2816. doi: 10.1002/cncr.21536. [DOI] [PubMed] [Google Scholar]
- 11.Geary J, et al. Gene-related cancer spectrum in families with hereditary non-polyposis colorectal cancer (HNPCC) Familial cancer. 2008;7:163–172. doi: 10.1007/s10689-007-9164-6. [DOI] [PubMed] [Google Scholar]
- 12.Watson P, et al. The clinical features of ovarian cancer in hereditary nonpolyposis colorectal cancer. Gynecologic oncology. 2001;82:223–228. doi: 10.1006/gyno.2001.6279. [DOI] [PubMed] [Google Scholar]
- 13.Norquist BM, et al. Inherited mutations in women with ovarian carcinoma. JAMA oncology. 2016;2:482–490. doi: 10.1001/jamaoncol.2015.5495. [DOI] [PMC free article] [PubMed] [Google Scholar]
- 14.Moran A, et al. Risk of cancer other than breast or ovarian in individuals with BRCA1 and BRCA2 mutations. Familial Cancer. 2012;11:235–242. doi: 10.1007/s10689-011-9506-2. [DOI] [PubMed] [Google Scholar]
- 15.Bonadona, V. et al. Cancer risks associated with germline mutations in MLH1, MSH2, and MSH6 genes in Lynch syndrome. JAMA305, 10.1001/jama.2011.743 (2011). [DOI] [PubMed]
- 16.Wong MW, et al. BRIP1, PALB2, and RAD51C mutation analysis reveals their relative importance as genetic susceptibility factors for breast cancer. Breast Cancer Res Treat. 2011;127:853–859. doi: 10.1007/s10549-011-1443-0. [DOI] [PubMed] [Google Scholar]
- 17.Pilie PG, et al. Germline genetic variants in men with prostate cancer and one or more additional cancers. Cancer. 2017;123:3925–3932. doi: 10.1002/cncr.30817. [DOI] [PMC free article] [PubMed] [Google Scholar]
- 18.Bermejo JL, Rawal R, Hemminki K. Familial association of specific histologic types of ovarian malignancy with other malignancies. Cancer. 2004;100:1507–1514. doi: 10.1002/cncr.20138. [DOI] [PubMed] [Google Scholar]
- 19.Zheng G, et al. Familial associations of female breast cancer with other cancers. International Journal of Cancer. 2017;141:2253–2259. doi: 10.1002/ijc.30927. [DOI] [PubMed] [Google Scholar]
- 20.Frank C, Sundquist J, Hemminki A, Hemminki K. Familial Associations Between Prostate Cancer and Other Cancers. European urology. 2017;71:162–165. doi: 10.1016/j.eururo.2016.07.031. [DOI] [PubMed] [Google Scholar]
- 21.Hemminki K, Li X. Familial liver and gall bladder cancer: a nationwide epidemiological study from Sweden. Gut. 2003;52:592–596. doi: 10.1136/gut.52.4.592. [DOI] [PMC free article] [PubMed] [Google Scholar]
- 22.Negri E, et al. Family history of cancer and risk of ovarian cancer. Eur J Cancer. 2003;39:505–510. doi: 10.1016/S0959-8049(02)00743-8. [DOI] [PubMed] [Google Scholar]
- 23.Breast Cancer Linkage Consortium. Cancer risks in BRCA2 mutation carriers. J Natl Cancer Inst91, 1310–1316 (1999). [DOI] [PubMed]
- 24.Carbone M, et al. BAP1 and cancer. Nat Rev Cancer. 2013;13:153–159. doi: 10.1038/nrc3459. [DOI] [PMC free article] [PubMed] [Google Scholar]
- 25.Pal T, et al. Frequency of mutations in mismatch repair genes in a population-based study of women with ovarian cancer. Brit J Cancer. 2012;107:1783. doi: 10.1038/bjc.2012.452. [DOI] [PMC free article] [PubMed] [Google Scholar]
- 26.Castellsagué E, et al. Characterization of a novel founder MSH6 mutation causing Lynch syndrome in the French Canadian population. Clinical Genetics. 2015;87:536–542. doi: 10.1111/cge.12526. [DOI] [PubMed] [Google Scholar]
- 27.Campbell PT, et al. Body Size Indicators and Risk of Gallbladder Cancer: Pooled Analysis of Individual-Level Data from 19 Prospective Cohort Studies. Cancer Epidemiology Biomarkers & Prevention. 2017;26:597–606. doi: 10.1158/1055-9965.EPI-16-0796. [DOI] [PMC free article] [PubMed] [Google Scholar]
- 28.Pandey M, Shukla VK. Lifestyle, parity, menstrual and reproductive factors and risk of gallbladder cancer. European journal of cancer prevention: the official journal of the European Cancer Prevention Organisation (ECP) 2003;12:269–272. doi: 10.1097/00008469-200308000-00005. [DOI] [PubMed] [Google Scholar]
- 29.Greiser EM, et al. Risk factors for nasal malignancies in German men: the South-German Nasal cancer study. BMC Cancer. 2012;12:506. doi: 10.1186/1471-2407-12-506. [DOI] [PMC free article] [PubMed] [Google Scholar]
- 30.World Health Organization. Biological agents. Volume 100 B. A review of human carcinogens. IARC monographs on the evaluation of carcinogenic risks to humans/World Health Organization, International Agency for Research on Cancer 100, 1–441 (2012).
- 31.Dong C, Hemminki K. Risk of multiple primary cancers in nasal cancer patients. Epidemiology. 2001;12:367–369. doi: 10.1097/00001648-200105000-00023. [DOI] [PubMed] [Google Scholar]
- 32.de Martel C, et al. Global burden of cancers attributable to infections in2008: a review and synthetic analysis. The Lancet Oncology. 2012;13:607–615. doi: 10.1016/S1470-2045(12)70137-7. [DOI] [PubMed] [Google Scholar]
- 33.Zur Hausen H. Papillomaviruses and cancer: from basic studies to clinical application. Nature reviews cancer. 2002;2:342. doi: 10.1038/nrc798. [DOI] [PubMed] [Google Scholar]
- 34.Craig ER, Londono AI, Norian LA, Arend RC. Metabolic risk factors and mechanisms of disease in epithelial ovarian cancer: A review. Gynecol Oncol. 2016;143:674–683. doi: 10.1016/j.ygyno.2016.10.005. [DOI] [PMC free article] [PubMed] [Google Scholar]
- 35.Hemminki K, Ji J, Sundquist J, Shu X. Familial risks in cancer of unknown primary: tracking the primary sites. J Clin Oncol. 2011;29:435–440. doi: 10.1200/JCO.2010.31.5614. [DOI] [PubMed] [Google Scholar]
- 36.Nakagawa S. A farewell to Bonferroni: the problems of low statistical power and publication bias. Behavioral ecology. 2004;15:1044–1045. doi: 10.1093/beheco/arh107. [DOI] [Google Scholar]
- 37.Hemminki K, Zhang H, Czene K. Socioeconomic factors in cancer in Sweden. Int J Cancer. 2003;105:692–700. doi: 10.1002/ijc.11150. [DOI] [PubMed] [Google Scholar]
- 38.Hemminki K, Sundquist J, Brandt A. Do discordant cancers share familial susceptibility? Eur J Cancer. 2012;48:1200–1207. doi: 10.1016/j.ejca.2011.09.017. [DOI] [PubMed] [Google Scholar]
- 39.Brown, M. B. 400: A method for combining non-independent, one-sided tests of significance. Biometrics, 987–992 (1975).
Associated Data
This section collects any data citations, data availability statements, or supplementary materials included in this article.
Supplementary Materials
Supplementary Table S1 Familial associations of ovarian cancer with liver cancers
Supplementary Table S2 Familial associations of histology-specific ovarian cancers with gall bladder cancer
Supplementary Table S3 Risk of endometrioid ovarian cancer after diagnosis of endometrial cancer and risk of endometrial cancer after diagnosis of endometrioid ovarian cancer
Data Availability Statement
The data that support the findings of this study are available from Lund University but restrictions apply to the availability of these data, which were used under license for the current study and so are not publicly available.