Abstract
MicroRNAs (miRNAs) are confirmed to be tumor promoters or suppressors in multiple squamous cell carcinomas (SCCs). miR‐99a‐5p has been demonstrated to be downregulated in cancerous tissues, but its functional role in head and neck SCC (HNSCC) and its mechanism of action have not been fully elucidated. Here, we studied the expression of miR‐99a‐5p in HNSCC and performed a clinical value assessment and then extracted mature expression data from The Cancer Genome Atlas (TCGA) and microarrays from Gene Expression Omnibus (GEO). Furthermore, biological analysis was constructed via online prediction tools. The results revealed that miR‐99a‐5p expression was markedly lower in HNSCC tissues than in normal tissues, which also showed significance in the prognosis of HNSCC. However, its diagnostic value could not be verified due to the lack of body fluid samples. Additionally, miR‐99a‐5p was expressed at higher levels in patients with low histological grade neoplasms than those with high histological grade neoplasms. The age of the patient might also be a possible clinical parameter affecting miR‐99a‐5p expression. Furthermore, miR‐99a‐5p significantly influenced HNSCC progression by regulating the PI3K‐Akt signaling pathway, in which the key target genes were upregulated in 519 HNSCC tissues compared to 44 normal tissues, as determined by the Gene Expression Profiling Interactive Analysis (GEPIA). In conclusion, our study may provide insights into the expression and mechanism of miR‐99a‐5p in HNSCC. Further studies are required to elucidate the role of miR‐99a‐5p and its potential clinical applications for HNSCC.
Keywords: expression, head and neck squamous cell carcinoma, miR‐99a‐5p, target genes
Abbreviations
- BP
biological process
- CC
cellular component
- DAVID
Database for Annotation, Visualization, and Integrated Discovery
- FN
false negative
- FP
false positive
- GEO
Gene Expression Omnibus
- GEPIA
Gene Expression Profiling Interactive Analysis
- GO
gene ontology
- HNSCC
head and neck squamous cell carcinoma
- IGF1R
insulin‐like growth factor 1 receptor
- KEGG
Kyoto Encyclopedia of Genes and Genomes
- LR
likelihood ratio
- MF
molecular function
- MTOR
mechanistic target of rapamycin
- PDGFRB
platelet‐derived growth factor receptor, beta polypeptide
- PIK3CD
phosphatidylinositol‐4,5‐bisphosphate 3‐kinase catalytic subunit data
- PPI
protein–protein interaction
- ROC
receiver operating characteristic
- SCC
squamous cell carcinoma
- TCGA
The Cancer Genome Atlas
- TN
true negative
- TNM
tumor, node, and metastasis
- TP
true positive
Squamous cell carcinomas (SCCs), also known as epidermoid carcinomas, are cancers that derived from squamous epithelial cells, which occur in the head and neck, thyroid, esophagus, lung, penis, prostate, bladder, vagina, and cervix 1, 2, 3, 4, 5, 6, 7, 8, 9. Of these, head and neck SCC (HNSCC) has attracted the attention of researchers due to its significant etiology including tobacco 10, alcohol 11, and human papilloma virus infection 12 associated with people's lifestyles. HNSCCs, the most frequent head and neck neoplasms, are originating from squamous cells in the nasal and oral cavity, paranasal sinuses, pharynx, larynx, and salivary glands. Men are at a higher risk of HNSCC than women. In particular, cancers of the oral cavity and pharynx were reported to cause 49 670 new cases and 9700 deaths worldwide in 2017 and were the ninth highest cause of new cancer cases in men.
A deeper understanding of HNSCC is accompanied with some remarkable explorations for diagnosis, prognosis, and potential pathogenesis 1, 13, 14, 15, 16, 17. Current treatment trends include targeted therapy combined with essential chemotherapy, radiotherapy, or immunotherapy 18, 19, 20, 21, 22, 23. Despite this progress, the increasing morbidity, mortality, and complex pathological changes of HNSCC urgently necessitate more effective means for its diagnosis and treatment, especially targeted treatments based on the further exploration of novel biomarkers.
MicroRNAs (miRNAs) are small noncoding RNAs with 21–25 nucleotides, which have been confirmed to be involved in the initiation and development of multiple SCCs 24, 25, 26, 27, 28, 29. Studies have shown significantly aberrant expression of several miRNAs in HNSCCs 27, 30, 31, 32, 33, indicating that miRNA expression levels may be valuable for the clinical diagnosis and prognosis of HNSCC. There is a strong need to characterize the clinical application of miRNAs for HNSCC. Among validated miRNAs, miR‐99a‐5p, the major member of miR‐99a family, has been demonstrated to be associated with carcinogenesis and deterioration in several cancers such as breast cancer, endometrial carcinoma, osteosarcoma, bladder cancer, lung adenocarcinoma, and hepatocellular carcinoma 34, 35, 36, 37, 38, 39. Several genes have been found to be regulated by miR‐99a‐5p, which is also enriched in relevant biological pathways 35, 40, 41, 42, 43, 44, 45.
In HNSCCs, miR‐99a‐5p has been reported to be downregulated in cancerous tissues 46, 47. Nevertheless, its functional role and relevant mechanism remain to be fully elucidated. In this study, based on the data acquired from Gene Expression Omnibus (GEO), The Cancer Genome Atlas (TCGA), and relevant literature, and using prediction tools (Fig. 1), we calculated the expression level and clinical value of miR‐99a‐5p, and performed biological analysis. This study might provide a comprehensive explanation of the clinical value and underlying mechanism of miR‐99a‐5p in HNSCC, to identify abnormally expressed miRNAs involved in HNSCC.
Figure 1.
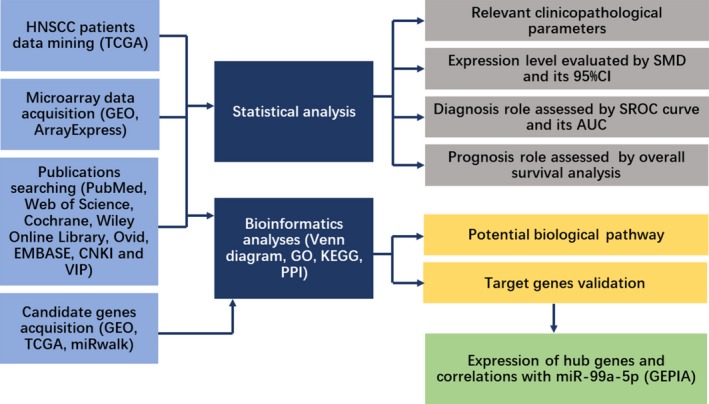
Flowchart of the study design.
Materials and methods
TCGA data in HNSCC patients
Mature expression data of miR‐99a‐5p in HNSCC and clinical information were obtained from TCGA datasets via UCSC (http://xena.ucsc.edu/; Accession Number: MIMAT0000097). The IIIuminaHiseq platform included 483 HNSCC patients and 44 adjacent noncancerous head and neck tissues, while the IIIuminaGA platform included 36 patients with HNSCC. No further transformation was performed for the expression data. We explored the possible association between miR‐99a‐5p expression and clinical parameters for HNSCC patients using the two platforms together or the IIIuminaHiseq platform alone, for further comparison of these two approaches. Based on TCGA data, the diagnostic and prognostic significance of miR‐99a‐5p was evaluated using the receiver operating characteristic (ROC) curve and the Kaplan–Meier curve, respectively.
Microarray data acquisition and extraction
We obtained available miRNA expression profiling of HNSCC from the GEO database (http://www.ncbi.nlm.nih.gov/geo/) and ArrayExpress (https://www.ebi.ac.uk/arrayexpress/). The search terms were as follows: (‘head AND neck’ OR ‘laryngeal’ OR ‘salivary gland’ OR ‘lip’ OR ‘mouth’ OR ‘tongue’ OR ‘nasopharyngeal’ OR ‘pharyngeal’ OR ‘OSCC’ OR ‘oral squamous cell’ OR ‘laryngeal’ OR ‘HNSCC’) AND (‘carcinoma’ OR ‘tumor’ OR ‘cancer’ OR ‘neoplas*’ OR ‘malignan*’). Microarray datasets were eligible with the entry criteria listed below: (1) Patients in each dataset were diagnosed with HNSCC; (2) both cancerous and noncancerous specimens were included in each dataset with a sample size of no less than three per group; and (3) miR‐99a‐5p expression data should be provided. Several relevant elements were extracted from the microarray datasets: author, publication year, country, platform, sample size, and miR‐99a‐5p expression level. Two authors (Yu‐ting Chen and Jianni Yao) independently extracted essential information from all selected chips. Conflicting opinions were solved by a discussion.
In addition, we searched the PubMed, Web of Science, Cochrane, Wiley Online Library, Ovid, EMBASE, CNKI, and VIP databases for relevant articles. The following strategy was constructed for searching: (microRNA‐99 OR hsa‐mir‐99 OR miR‐99 OR MIRN99a microRNA OR microRNA‐99a OR miR‐99a OR hsa‐mir‐99a OR MIRN99A OR mir‐99a) AND (‘head AND neck’ OR ‘laryngeal’ OR ‘salivary gland’ OR ‘lip’ OR ‘mouth’ OR ‘tongue’ OR ‘nasopharyngeal’ OR ‘pharyngeal’ OR ‘OSCC’ OR ‘oral squamous cell’ OR ‘laryngeal’ OR ‘HNSCC’) AND (‘carcinoma’ OR ‘tumor’ OR ‘cancer’ OR ‘neoplas*’ OR ‘malignan*’). Studies that provided case numbers, mean, and standard deviation (SD) were included.
Statistical analysis
Statistical analyses were performed using SPSS 23.0 (IBM, NY, USA) and Stata version 12.0. Scatter diagrams were plotted for each study using GraphPad Prism 7.0. We also used SPSS 23.0 to calculate the mean ± SD for all the studies based on the expression value of miR‐99a‐5p. Stata version 12.0 was used to perform continuous variable meta‐analysis by evaluating the overall SMD and 95% CI. Both fixed‐effect and random‐effect model were employed, while the heterogeneity was analyzed by chi‐square and I 2 tests. Sensitivity analysis was added to explain the heterogeneity. Results were considered statistically significant if the observed SMD with 95%CI did not cross 0. Additionally, we constructed Begg's funnel and Egger's plot to detect publication bias.
For diagnostic tests, we used SPSS 23.0 to plot the ROC curve and to calculate the true positive (TP), false positive (FP), false negative (FN), and true negative (TN) for each included study. Then, diagnosis meta‐analysis was performed via MetaDisc 1.4. Sensitivity, specificity, positive likelihood ratio (+LR), negative likelihood ratio (−LR), and diagnostic odds ratio (OR), as well as the summarized ROC curve (SROC), were chosen to describe the possible diagnostic value of miR‐99a‐5p for HNSCC. For practical application, we made a conclusion via the overall consideration of our diagnosis test results and the provided body fluid samples.
Bioinformatics analyses
To predict the putative target genes of miR‐99a‐5p, we acquired candidate genes from http://www.ncbi.nlm.nih.gov/geo/query/acc.cgi?acc=GSE85614 (log2FC < 0), TCGA database (log2FC > 1 and P < 0.05). The miRwalk 2.0, which included miRWalk, Targetscan, miRanda, miRDB, miRNAMap, miRBridge, RNA22, miRMap, PITA, RNAhybrid, PicTar, and Microt4, was also applied to selected genes with a computer algorithm. Genes overlapping at least two prediction platforms were selected. Based on the above source, prospective genes were screened through intersection by online tools (http://bioinformatics.psb.ugent.be/webtools/Venn/). Meanwhile, validated genes from publications were also added.
Based on the predicted target genes, we conducted Gene ontology (GO) and Kyoto Encyclopedia of Genes and Genomes (KEGG) pathway analysis using online tools (https://david.ncifcrf.gov/) to determine the underlying mechanism of miR‐99a‐5p in HNSCC. The STRING database (https://string-db.org/) was also utilized to construct a PPI network for further characterizing the interactions among promising target genes of miR‐99a‐5p. Furthermore, hub genes with over five degrees were selected. In addition, we acquired differentially expressed genes of HNSCC from the Gene Expression Profiling Interactive Analysis (GEPIA) (|log2FC| > 1.5, P < 0.05) and conducted another KEGG pathway analysis to detect the potential pathways for the progression of HNSCC.
Expression of hub genes and their correlations with miR‐99a‐5p
Based on GEPIA 48, we detected the expression of hub genes in HNSCC and normal tissues to further identify the target genes of miR‐99a‐5p. We also performed Spearman's correlation analysis to explain the correlation between hub genes and miR‐99a‐5p. Besides, the protein level of those hub genes was acquired from The Human Protein Atlas.
Results
Relationships between miR‐99a‐5p expression and clinicopathological parameters in HNSCC
Statistical analysis based on the IIIuminaHiseq platform (Table 1) revealed that miR‐99a‐5p was expressed at a lower level in HNSCC tissues than in normal tissues (7.987 ± 1.467 vs 10.348 ± 0.625, respectively; P < 0.001). In addition, miR‐99a‐5p was expressed at higher levels in G1–G2 than in G3–G4 neoplasms (8.140 ± 1.239 vs 7.968 ± 1.525, respectively, P = 0.001). When statistical analysis was carried out using a combination of the IIIuminaHiseq and IIIuminaGA platforms (Table 2), the results revealed that miR‐99a‐5p was expressed at lower levels in HNSCC tissues than in adjacent normal tissues (8.028 ± 1.498 vs 10.348 ± 0.625, respectively, P < 0.001). Significant differences were also observed among neoplasms of different histological grades (7.841 ± 1.410 vs 8.413 ± 1.622, respectively, P < 0.001). In addition, miR‐99a‐5p expression was higher in patients over 50 years than in those less than 50 years (8.090 ± 1.453 vs 7.691 ± 1.695, respectively, P = 0.027). As for the diagnostic test based on TCGA, miR‐99a‐5p might show significant diagnostic value for HNSCC (AUC = 0.934, P < 0.001; AUC = 0.926, P < 0.001; Fig. 2). However, the tissue types of patients were unknown. Additionally, survival analysis indicated a probable prognostic value for HNSCC patients (P < 0.01; Fig. 3). The added IIIuminaGA platform did not significantly affect our research; nevertheless, it reminds us of the need for more samples for further exploration of the relationships between miR‐99a‐5p expression and clinicopathological parameters of HNSCC patients.
Table 1.
Relationships between the expression value of miR‐99a‐5p and clinicopathological parameters in HNSCC patients based on the IIIuminaHiseq platform
| Clinicopathological features | n | miR‐99a‐5p expression level | P value | |
|---|---|---|---|---|
| Tissue | Noncancerous | 44 | 10.348 ± 0.625 | < 0.001 |
| Cancerous | 483 | 7.987 ± 1.467 | ||
| Gender | Male | 351 | 8.046 ± 1.515 | 0.152 |
| Female | 132 | 7.831 ± 1.323 | ||
| Age | ≥ 50 | 405 | 8.040 ± 1.424 | 0.061 |
| < 50 | 77 | 7.698 ± 1.660 | ||
| T | T1–T2 | 172 | 8.092 ± 1.477 | 0.05 |
| T3–T4 | 251 | 7.817 ± 1.371 | ||
| N | N0 | 163 | 8.005 ± 1.374 | 0.308 |
| N1–N3 | 227 | 7.854 ± 1.482 | ||
| M | M0 | 174 | 8.008 ± 1.482 | 0.139 |
| M1 | 1 | |||
| Stage | I–II | 109 | 8.140 ± 1.239 | 0.282 |
| III–IV | 361 | 7.968 ± 1.525 | ||
| Histologic grade | G1–G2 | 341 | 7.816 ± 1.393 | 0.001 |
| G3–G4 | 122 | 8.332 ± 1.582 | ||
| Lymphovascular invasion | Yes | 113 | 7.968 ± 1.458 | 0.180 |
| No | 211 | 7.747 ± 1.388 | ||
| Alcohol | Yes | 319 | 8.046 ± 1.445 | 0.194 |
| No | 156 | 7.859 ± 1.521 | ||
Table 2.
Relationships between the expression value of miR‐99a‐5p and clinicopathological parameters in HNSCC patients based on the IIIuminaHiseq and IIIuminaGA platforms
| Clinicopathological features | n | miR‐99a‐5p expression level | P value | |
|---|---|---|---|---|
| Tissue | Noncancerous | 44 | 10.348 ± 0.625 | 0.001 |
| Cancerous | 519 | 8.028 ± 1.498 | ||
| Gender | Male | 379 | 8.079 ± 1.558 | 0.198 |
| Female | 140 | 7.889 ± 1.317 | ||
| Age | ≥ 50 | 436 | 8.090 ± 1.453 | 0.027 |
| < 50 | 82 | 7.691 ± 1.695 | ||
| T | T1 ~ T2 | 184 | 8.097 ± 1.475 | 0.117 |
| T3 ~ T4 | 272 | 7.882 ± 1.402 | ||
| N | N0 | 175 | 8.034 ± 1.386 | 0.314 |
| N1 ~ N3 | 245 | 7.890 ± 1.486 | ||
| M | M0 | 187 | 8.076 ± 1.488 | 0.153 |
| M1 | 1 | |||
| Stage | I–II | 115 | 8.174 ± 1.267 | 0.300 |
| III–IV | 390 | 8.010 ± 1.559 | ||
| Histologic grade | G1–G2 | 368 | 7.841 ± 1.410 | 0.001 |
| G3–G4 | 130 | 8.413 ± 1.622 | ||
| Lymphovascular invasion | Yes | 122 | 7.988 ± 1.451 | 0.282 |
| No | 229 | 7.814 ± 1.424 | ||
| Alcohol | Yes | 346 | 8.065 ± 1.474 | 0.366 |
| No | 164 | 7.936 ± 1.563 | ||
Figure 2.
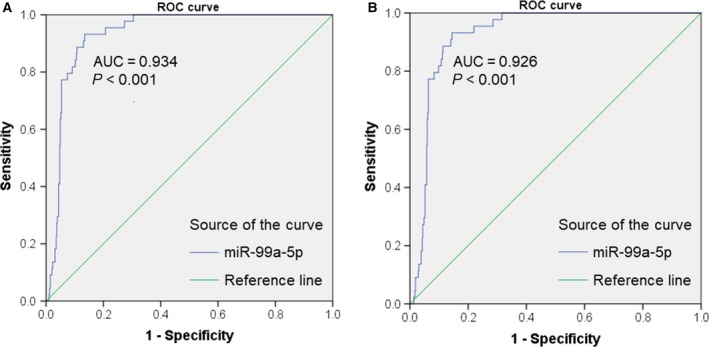
Receiver operating characteristic (ROC) curves of miR‐99a‐5p in HNSCC based on TCGA data. (A) Diagnostic value of miR‐99a‐5p for HNSCC based on the IIIuminaHiseq platform (AUC = 0.934, P < 0.001). (B) Diagnostic value of miR‐99a‐5p for HNSCC based on the IIIuminaHiseq and IIIuminaGA platforms (AUC = 0.926, P < 0.001).
Figure 3.
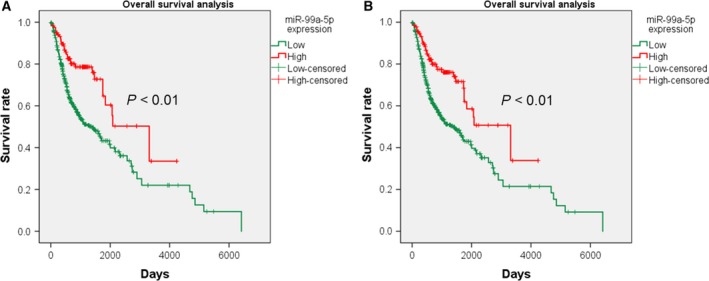
Kaplan–Meier curves of different miR‐99a‐5p expression levels based on TCGA data. (A) The overall survival of HNSCC patients varies with different miR‐99a‐5p expression levels based on the IIIuminaHiseq platform (P < 0.01). (B) The overall survival of HNSCC patients varies with different miR‐99a‐5p expression levels based on the IIIuminaHiseq and IIIuminaGA platforms (P < 0.01).
Comprehensive meta‐analysis based on microarrays
MiR‐99a‐5p expression level in HNSCC
A total of 18 eligible microarrays were selected from GEO datasets. Finally, 924 HNSCC tissues and 212 noncancerous head and neck tissues were included as http://www.ncbi.nlm.nih.gov/geo/query/acc.cgi?acc=GSE34496 and http://www.ncbi.nlm.nih.gov/geo/query/acc.cgi?acc=GSE73460 acted equally. However, no publications met our criteria. Then, continuous variable meta‐analysis pooled the expression data from 17 microarrays (Table 3), among which there were 6 significant microarrays (P ≤ 0.05; Fig. 4). Other microarrays without statistical significance were displayed in Fig. S1 (A‐K). As the overall result revealed, miR‐99a‐5p expression was lower in HNSCC tissue than in the control group both for fixed‐effect (SMD = −0.60, 95% CI = −0.78 to −0.42, I 2 = 87.5%) and random‐effect (SMD = −0.54, 95% CI = −1.06 to −0.01, I 2 = 87.5%) models (Fig. 5). Sensitivity analysis was then carried out to evaluate the influence of each chip. http://www.ncbi.nlm.nih.gov/geo/query/acc.cgi?acc=GSE45238 and http://www.ncbi.nlm.nih.gov/geo/query/acc.cgi?acc=GSE32960 might be the sources of heterogeneity (Fig. 6). Additionally, Begg's funnel and Egger's plot indicated no obvious publication bias (Fig. 7).
Table 3.
Basic characteristics and data of the included microarrays
| Accession | Author | Year | Country | Platform | Sample | Exp mean ± Exp SD | Ctrl mean ± Ctrl SD | TP | FP | FN | TN |
|---|---|---|---|---|---|---|---|---|---|---|---|
| http://www.ncbi.nlm.nih.gov/geo/query/acc.cgi?acc=GSE11163 | Avissar M et al. | 2008 | USA | GPL6680 | 21 | 8.952 ± 1.693 | 10.531 ± 0.792 | 12 | 1 | 4 | 4 |
| http://www.ncbi.nlm.nih.gov/geo/query/acc.cgi?acc=GSE22587 | Li T et al. | 2013 | China | GPL8933 | 12 | 560.969 ± 304.226 | 540.273 ± 73.556 | 3 | 0 | 5 | 4 |
| http://www.ncbi.nlm.nih.gov/geo/query/acc.cgi?acc=GSE28100 | Jung HM et al. | 2012 | USA | GPL10850 | 20 | 8.151 ± 1.449 | 8.167 ± 1.431 | 15 | 2 | 2 | 1 |
| http://www.ncbi.nlm.nih.gov/geo/query/acc.cgi?acc=GSE31277 | Severino P et al. | 2014 | Brazil | GPL4133 | 30 | 13.218 ± 0.97 | 14.45 ± 0.418 | 15 | 2 | 0 | 13 |
| http://www.ncbi.nlm.nih.gov/geo/query/acc.cgi?acc=GSE32906 | Luo Z et al. | 2012 | China | GPL11350 | 22 | 6780.977 ± 3169.49 | 3233.222 ± 1786.07 | 16 | 6 | 0 | 0 |
| http://www.ncbi.nlm.nih.gov/geo/query/acc.cgi?acc=GSE32960 | Ma J et al. | 2012 | China | GPL14722 | 330 | 9.913 ± 0.808 | 11.433 ± 0.888 | 242 | 3 | 70 | 15 |
| http://www.ncbi.nlm.nih.gov/geo/query/acc.cgi?acc=GSE34496 | Ochs MF et al. | 2013 | USA | GPL8786 | 69 | 7.215 ± 1.202 | 7.762 ± 0.858 | 27 | 8 | 17 | 17 |
| http://www.ncbi.nlm.nih.gov/geo/query/acc.cgi?acc=GSE36682 | Wei R et al. | 2012 | China | GPL15311 | 68 | 12.56 ± 1.001 | 13.513 ± 0.391 | 40 | 0 | 22 | 6 |
| http://www.ncbi.nlm.nih.gov/geo/query/acc.cgi?acc=GSE41268 | Xie Z et al. | 2012 | China | GPL10850 | 10 | 5.978 ± 0.995 | 5.499 ± 0.703 | 1 | 0 | 6 | 3 |
| http://www.ncbi.nlm.nih.gov/geo/query/acc.cgi?acc=GSE43039 | Li X et al. | 2015 | China | GPL16414 | 40 | −0.053 ± 3.322 | −0.515 ± 1.23 | 2 | 0 | 18 | 20 |
| http://www.ncbi.nlm.nih.gov/geo/query/acc.cgi?acc=GSE43329 | Zheng X et al. | 2013 | China | GPL16475 | 50 | 102.21 ± 30.963 | 98.606 ± 0.583 | 6 | 2 | 25 | 17 |
| http://www.ncbi.nlm.nih.gov/geo/query/acc.cgi?acc=GSE45238 | Shiah S et al. | 2015 | Taiwan | GPL8179 | 80 | 4094.715 ± 2167.8 | 9774.709 ± 1957.02 | 38 | 4 | 2 | 36 |
| http://www.ncbi.nlm.nih.gov/geo/query/acc.cgi?acc=GSE46172 | Plieskatt JL et al. | 2014 | USA | GPL16770 | 8 | 8.262 ± 2.384 | 9.443 ± 0.614 | 2 | 0 | 2 | 4 |
| http://www.ncbi.nlm.nih.gov/geo/query/acc.cgi?acc=GSE62819 | Lian M et al. | 2014 | China | GPL16384 | 10 | 10.288 ± 1.185 | 11.078 ± 1.012 | 4 | 1 | 1 | 4 |
| http://www.ncbi.nlm.nih.gov/geo/query/acc.cgi?acc=GSE69002 | Creighton C et al. | 2016 | USA | GPL18044 | 7 | 3.305 ± 0.058 | 3.405 ± 0.115 | 3 | 2 | 0 | 2 |
| http://www.ncbi.nlm.nih.gov/geo/query/acc.cgi?acc=GSE70970 | Bruce J et al. | 2015 | Canada | GPL20699 | 263 | 9.078 ± 2.033 | 9.421 ± 0.891 | 73 | 1 | 173 | 16 |
| http://www.ncbi.nlm.nih.gov/geo/query/acc.cgi?acc=GSE82064 | Valeri N et al. | 2017 | Switzerland | GPL21968 | 96 | 212.885 ± 194.605 | 139.667 ± 60.085 | 21 | 4 | 57 | 14 |
Figure 4.
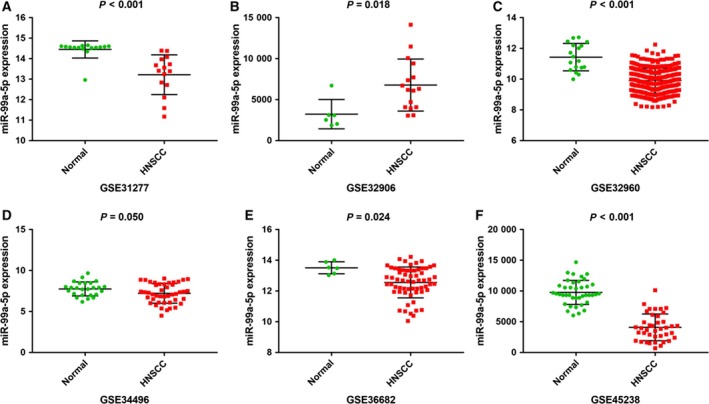
Representative scatter plots of miR‐99a‐5p expression data in normal and HNSCC tissues in microarrays. Expression data of miR‐99a‐5p in normal and HNSCC tissues from microarrays with P value ≤ 0.05 were plotted: (A) http://www.ncbi.nlm.nih.gov/geo/query/acc.cgi?acc=GSE31277 (P < 0.001). (B) http://www.ncbi.nlm.nih.gov/geo/query/acc.cgi?acc=GSE32906 (P = 0.018). (C) http://www.ncbi.nlm.nih.gov/geo/query/acc.cgi?acc=GSE32960 (P < 0.001). (D) http://www.ncbi.nlm.nih.gov/geo/query/acc.cgi?acc=GSE34496 (P = 0.050). (E) http://www.ncbi.nlm.nih.gov/geo/query/acc.cgi?acc=GSE36682 (P = 0.024). (F) http://www.ncbi.nlm.nih.gov/geo/query/acc.cgi?acc=GSE45238 (P < 0.001).
Figure 5.
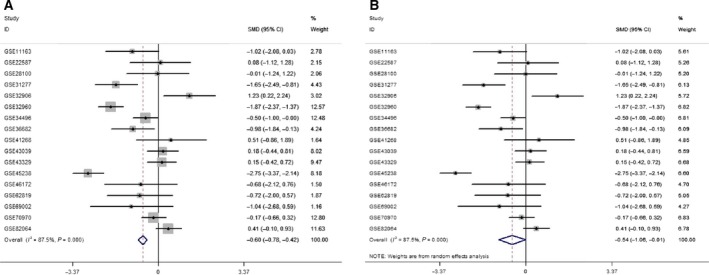
MiR‐99a‐5p expression levels in normal tissue and HNSCC by forest plot. (A) Forest plot constructed by the fixed‐effect model (SMD = −0.60, 95% CI= −0.78 to −0.42, I 2 = 87.5%). (B) Forest plot constructed by the random‐effect model (SMD = −0.54, 95% CI = −1.06 to −0.01, I 2 = 87.5%).
Figure 6.
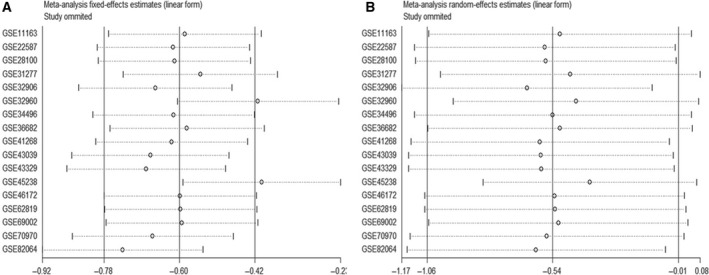
Sensitivity analysis. (A) Fixed‐effect model. (B) Random‐effect model. http://www.ncbi.nlm.nih.gov/geo/query/acc.cgi?acc=GSE45238 and http://www.ncbi.nlm.nih.gov/geo/query/acc.cgi?acc=GSE32960 might be sources of heterogeneity according to the fixed‐effect model.
Figure 7.
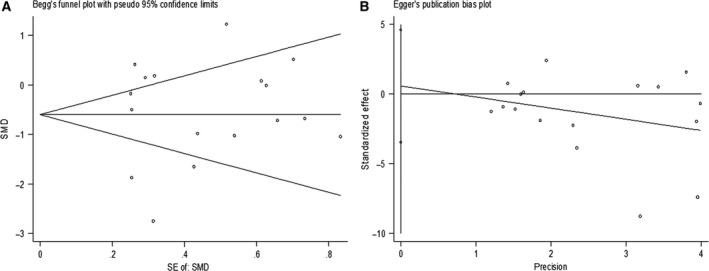
Publication bias detection. (A) Begg's funnel. (B) Egger's plot.
Diagnostic value of miR‐99a‐5p for HNSCC
ROC curves for all eligible studies were plotted. Four representative ROC curves including http://www.ncbi.nlm.nih.gov/geo/query/acc.cgi?acc=GSE31277, http://www.ncbi.nlm.nih.gov/geo/query/acc.cgi?acc=GSE32960, http://www.ncbi.nlm.nih.gov/geo/query/acc.cgi?acc=GSE36682 and http://www.ncbi.nlm.nih.gov/geo/query/acc.cgi?acc=GSE45238 were displayed in Fig. 8, with P value less than 0.05, while the other studies showing no statistical significance were in Fig. S1 (L‐X). Further analysis was performed based on the TP, FP, FN, and TN results (Table 3). As shown in Fig. 9, the SROC curve verified the diagnostic value of miR‐99a‐5p in HNSCC as the AUC was 0.85 (95% CI = 0.77–0.92), with a sensitivity of 0.56 (95%CI=0.52–0.59, P < 0.001) and a specificity of 0.85 (95% CI = 0.80–0.90, P = 0.030). Furthermore, likelihood ratios were calculated (Pool +LR = 2.90, 95% CI = 1.91–4.39, P = 0.074; pool −LR = 0.52, 95% CI = 0.38–0.73, P < 0.001), respectively. The diagnostic OR of 8.23 (95% CI = 3.71–18.25, P = 0.006) also suggested a significant diagnostic value when based on all the included samples. However, only the http://www.ncbi.nlm.nih.gov/geo/query/acc.cgi?acc=GSE41268 and http://www.ncbi.nlm.nih.gov/geo/query/acc.cgi?acc=GSE69002 chips provided body fluid samples (AUC = 0.333, P = 0.201 and AUC = 0.750, P = 0.197, respectively). Thus, the clinical diagnostic value of miR‐99a‐5p for HNSCC could not be fully verified.
Figure 8.
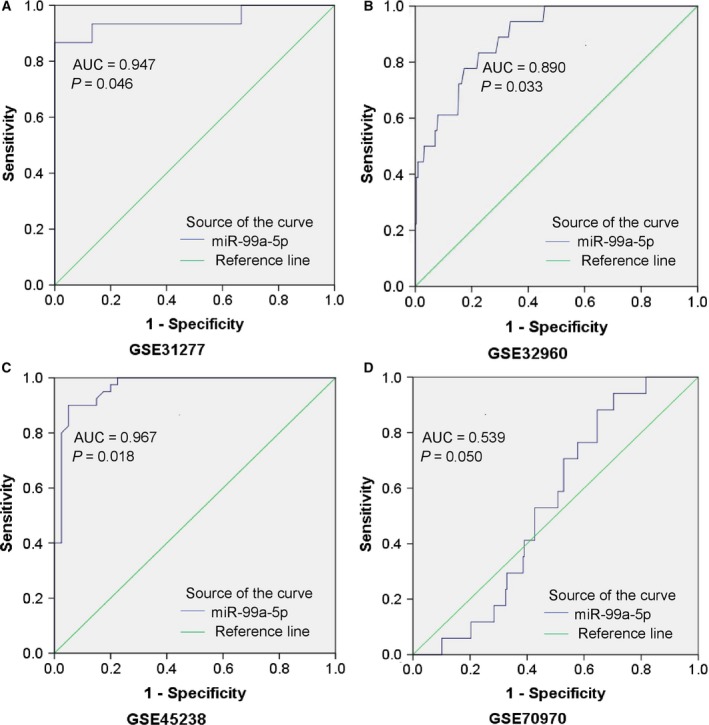
Representative ROC curves of the microarrays. ROC curve of miR‐99a‐5p expression in normal and HNSCC tissues from microarrays with P value ≤ 0.05 were plotted: (A) http://www.ncbi.nlm.nih.gov/geo/query/acc.cgi?acc=GSE31277 (AUC = 0.947, P = 0.046). (B) http://www.ncbi.nlm.nih.gov/geo/query/acc.cgi?acc=GSE32960 (AUC = 0.890, P = 0.033). (C) http://www.ncbi.nlm.nih.gov/geo/query/acc.cgi?acc=GSE45238 (AUC = 0.967, P = 0.018). (D) http://www.ncbi.nlm.nih.gov/geo/query/acc.cgi?acc=GSE70970 (AUC = 0.539, P = 0.050).
Figure 9.
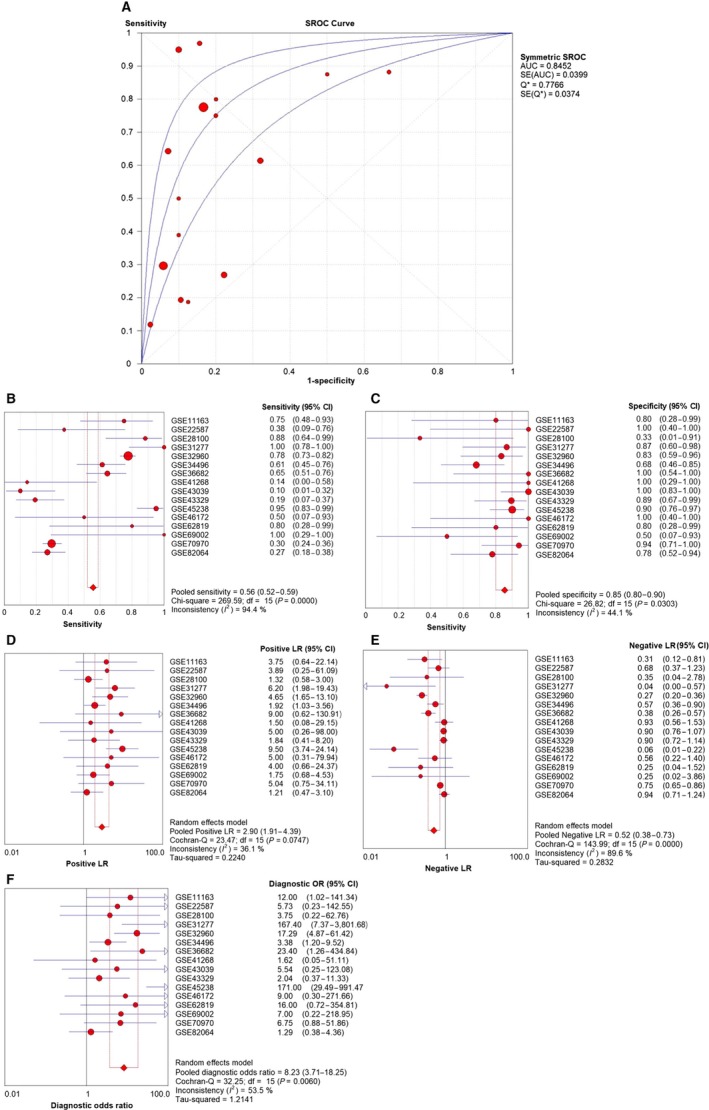
Diagnostic test based on the 17 included microarrays. (A) The summarized receiver operating characteristic (SROC) curve (AUC = 0.85, 95% CI = 0.77–0.92 calculated manually). (B) Sensitivity value of 0.56 (95%CI = 0.52–0.59, P < 0.001). (C) Specificity value of 0.85 (95% CI = 0.80–0.90, P = 0.030). (D) Pool positive likelihood ratio of 2.90 (95% CI = 1.91–4.39, P = 0.074). (E) Pool negative likelihood ratio of 0.52 (95% CI = 0.38–0.73, P < 0.001). (F) Diagnostic odds ratio of 8.23 (95% CI = 3.71–18.25, P = 0.006).
Bioinformatics analyses of miR‐99a‐5p and HNSCC
Prediction of miR‐99a‐5p target genes
We screened 14 174 genes from GSM2279805, 1532 genes from the TCGA dataset, and 3085 genes from miRwalk 2.0 after removing duplicates. As the analytical integration shown, a total of 98 genes overlapped in the GSM microarray and online software (Fig. 10). MTMR3, IGF1R, MTOR, NOX4, and HOXA1, which were searched from published literature, were also included 49, 50, 51, 52, 53. Finally, a total of 103 genes were identified as the promising target genes of miR‐99a‐5p in HNSCC (Table 4).
Figure 10.
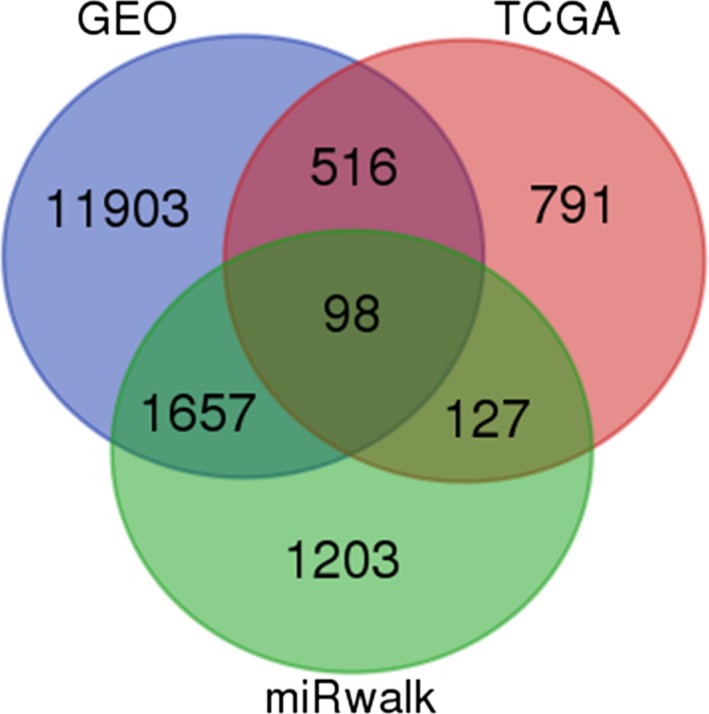
Venn diagram for identifying 98 promising target genes of miR‐99a‐5p in HNSCC.
Table 4.
Validated genes of miR‐99a‐5p from the GEO, TCGA, and miRwalk databases and literature
| Genes | ||||||
|---|---|---|---|---|---|---|
| Validated in HNSCC | MTMR3 | IGF1R | MTOR | NOX4 | HOXA1 | |
| Validated by analytical integration | LAMA5 | AGO2 | HIP1 | SLC44A1 | TNFAIP8L1 | POLE |
| RELB | U2SURP | RNF213 | DNASE2 | MPP3 | TRAM2 | |
| LHFPL2 | NCS1 | FAM64A | TTYH3 | HSP90B1 | GUCY1A3 | |
| WNT7B | CELSR1 | SLC39A14 | MXRA8 | NRIP3 | PAPLN | |
| ASNS | PIK3CD | NAV1 | FANCA | STK10 | AFAP1L1 | |
| B4GALNT1 | TAPBP | WARS | TUSC3 | CASK | PRSS23 | |
| HENMT1 | ACVR1 | ANGPT2 | BICD1 | DLX5 | RGS3 | |
| ABCG1 | ITGA3 | SH2B3 | COL5A1 | CTLA4 | ECE1 | |
| ETS1 | EXT2 | FOXM1 | BCAM | MN1 | PDGFRB | |
| PYCR1 | MAPK12 | SLC1A4 | GPR68 | STC2 | UBE2L6 | |
| SCRN1 | IGF2BP2 | TSPAN9 | SLC2A6 | KIAA0930 | FLRT2 | |
| TMEM184B | DKK3 | EPB41L4B | KIRREL | YEATS2 | IPO9 | |
| FAM111A | STRA6 | ORAI2 | LBH | APH1B | KRBA1 | |
| RNASE7 | MARVELD3 | C1QTNF1 | ANTXR2 | GJB4 | C10orf35 | |
| NPNT | SH3PXD2B | ADAM8 | COL6A2 | HAS2 | ODC1 | |
| TGFB3 | FADD | DDIT4 | MISP | MFAP5 | SYT7 | |
| ARHGEF39 | NRBP2 | |||||
GO enrichment and KEGG pathway analysis
For GO enrichment analysis, the results comprised biological process (BP), cellular component (CC), and molecular function (MF). The potential target genes of miR‐99a‐5p significantly influence 15 GO terms (P < 0.05), including cell migration and phosphatidylinositol‐mediated signaling in BP, and focal adhesion in CC. Additionally, KEGG pathway analysis also indicated that the PI3K‐Akt signaling pathway and pathways in cancer were the most enriched for miR‐99a‐5p in HNSCC (P < 0.001, FDR < 0.05; Fig. 11). According to another KEGG pathway analysis, the PI3K‐Akt signaling pathway and pathways in cancer were also confirmed to be significant in the progression of HNSCC (P < 0.001; Fig. 12).
Figure 11.
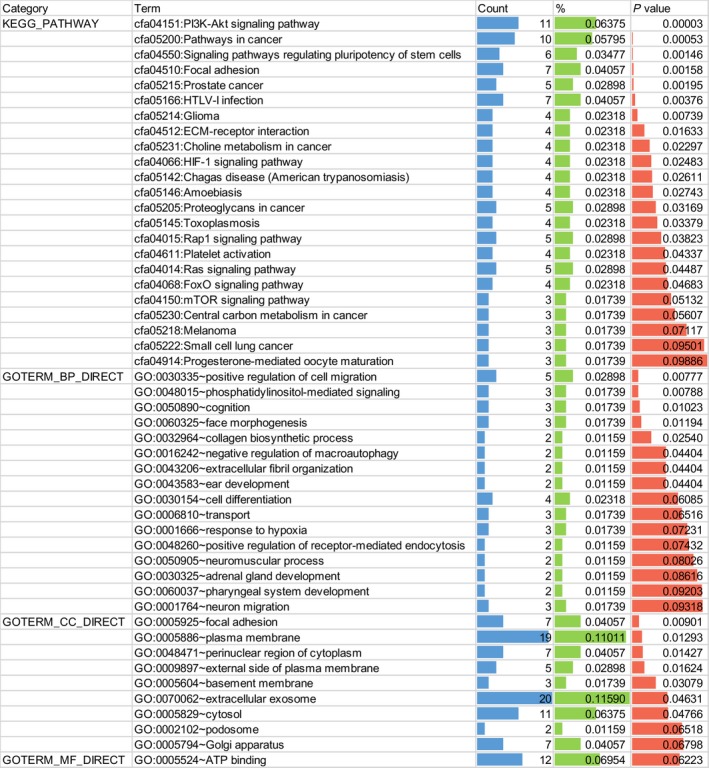
Functional annotation of target genes by GO enrichment and KEGG pathway analysis (P value < 0.05 for KEGG, BP, and CC).
Figure 12.
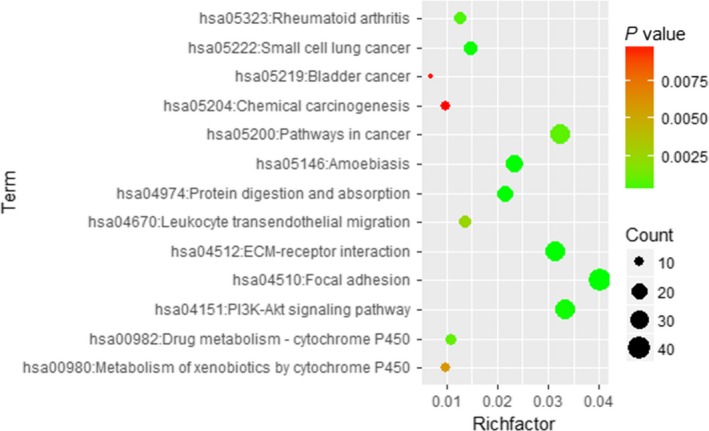
Bubble diagram of KEGG pathway for HNSCC. Significant pathways with P value < 0.01 were plotted by R language.
PPI network construction
The 103 putative target genes were inputted into STRING for constructing a PPI network (Fig. 13). There were 103 nodes and 49 edges with an enrichment P value of 0.007. Thus, we further identified PIK3CD, IGF1R, PDGFRB, and MTOR as the hub genes of miR‐99a‐5p in HNSCC (all degrees > 5).
Figure 13.
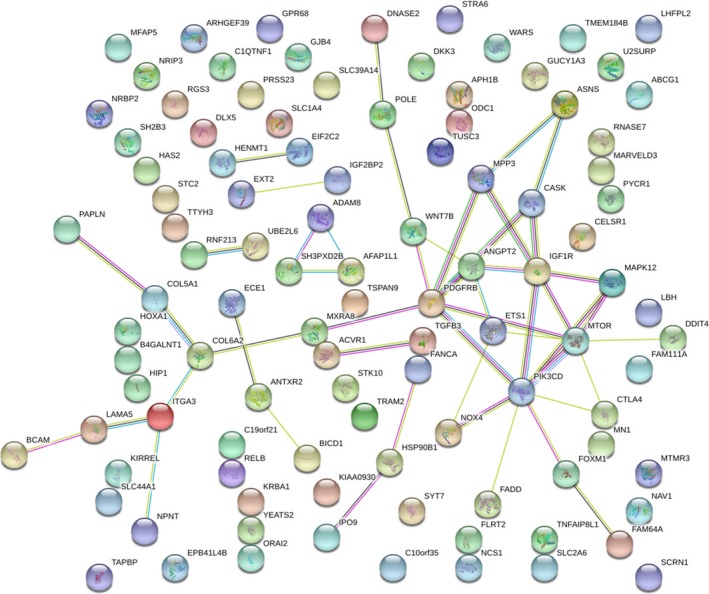
PPI network of 103 promising target genes of miR‐99a‐5p in HNSCC.
Expression value of hub genes and their correlations with miR‐99a‐5p
As shown in the boxplot (Fig. 14), PIK3CD, IGF1R, PDGFRB, and MTOR all exhibited higher expression levels in 519 HNSCC tissues compared to the 44 normal tissues. PIK3D and IGFR1 expression levels were significant negatively correlated to miR‐99a‐5p in HNSCC (PIK3D: r = −0.318, P < 0.001; IGFR1: r = −0.118, P = 0.005), while PDGFRB and MTOR were mildly negatively correlated with miR‐99a‐5p (PDGFRB: r = −0.036, P = 0.393; MTOR: r = −0.012, P = 0.774; Fig. 15).
Figure 14.
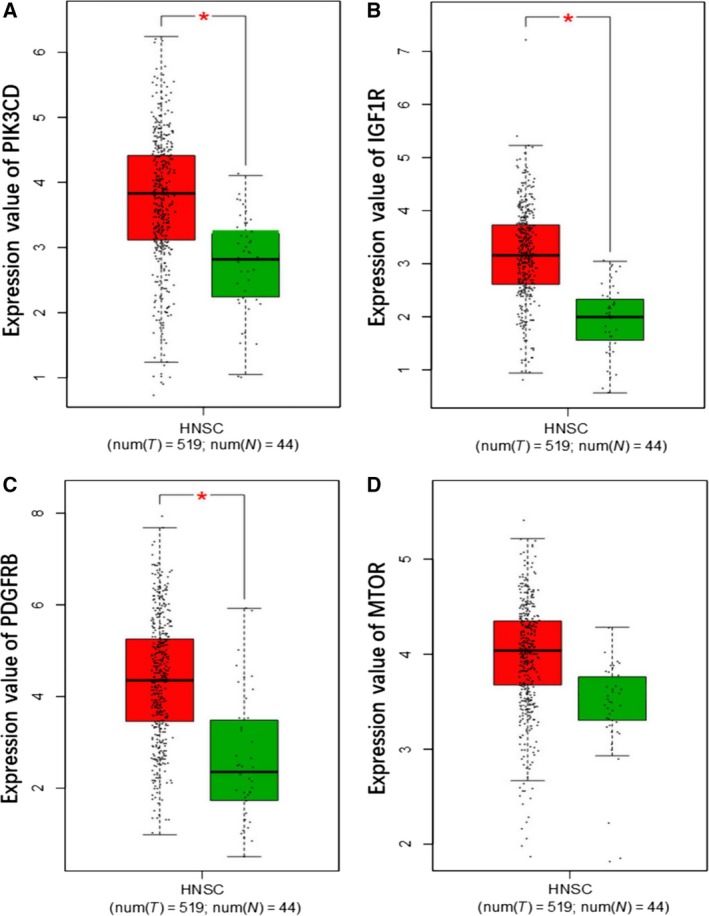
Expression analysis of four hub genes in 44 normal tissues and 519 HNSCC tissues based on GEPIA. (A) Expression value of PIK3CD. (B) Expression value of IGF1R. (C) Expression value of PDGFRB. (D) Expression value of MTOR.
Figure 15.
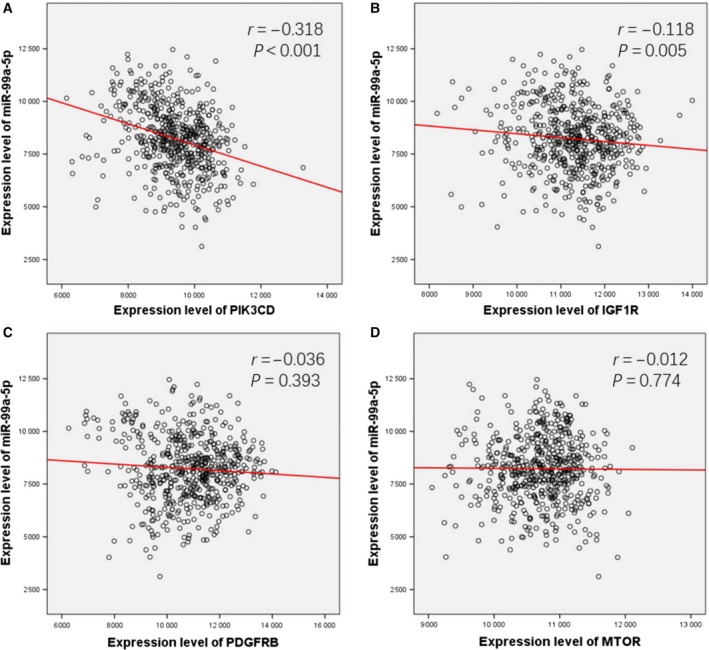
Spearman's correlation analysis. Expression value of PIK3CD (A), IGF1R (B), PDGFRB (C), and MTOR (D) and their correlations with miR‐99a‐5p.
Discussion
There has been a trend of targeted treatment for human cancers in recent years. Illuminated by the abnormal biological signals in cancer cells, people commit to detecting novel biomarkers for exploring the potential mechanism of tumorigenesis and progression as well as further clinical applications such as cancer diagnosis, treatment, and prognosis. Therein, the miRNAs, which appear to be involved in gene regulation, were confirmed to be tumor suppressors or promoters 54, 55.
Several studies have demonstrated that miR‐99a‐5p could affect proliferation, migration, and invasion in various cancers, including HNSCCs, via modulating gene expression 36, 56, 57. The reduced miR‐99a‐5p expression was confirmed to suppress the insulin‐like growth factor mammalian of rapamycin signaling (IGF‐mTOR signaling) through binding sites in their 3ʹ‐untranslated regions (UTRs) in childhood adrenocortical tumors 58. According to Kuo et al., miR‐99a‐5p could inhibited myotubularin‐related protein 3 (MTMR3) expression then suppress the metastasis of oral cancer (OC) 49. As for HNSCC, Chen et al. also reported that IGFR1 and MTOR were repressed by ectopic transfection of miR‐99‐5p 51. In addition, Yan et al. suggested that downregulation of miR‐99a‐5p contributed to oral squamous cell carcinoma (OSCC) by targeting MTOR, further indicating the relation between miR‐99a‐5p and HNSCC development 59. Recently, miR‐99a‐5p was found to facilitate oral tumor cells by targeting NADPH oxidase 4 (NOX4) 52. To achieve a deeper understanding of the mechanism underlying miR‐99a‐5p, we identified its potential targets and performed the comprehensive biological pathway analysis. According to our KEGG pathway analysis, miR‐99a‐5p significantly affected the progression of HNSCC by regulating the PI3K‐Akt signaling pathway, of which the predicted target genes, phosphatidylinositol‐4,5‐bisphosphate 3‐kinase catalytic subunit data (PIK3CD), insulin‐like growth factor 1 receptor (IGFR1), platelet‐derived growth factor receptor, beta polypeptide (PDGFRB), and mechanistic target of rapamycin (MTOR) were involved.
The PI3K‐Akt signaling pathway, concretely explained as the phosphatidylinositol 3‐kinase (PI3K)/AKT/mammalian target of the rapamycin (mTOR) signaling pathway, is aberrant in many types of cancer 60, 61, 62, 63. The involved PIK3CD, IGFR1, PDGFRB, and MTOR4, also screened out by PPI construction, were further utilized to analyze the correlations with miR‐99a‐5p. We found that the four hub genes all exhibited higher expression levels in HNSCC tissues than in normal tissues, gaining more possibility to be the target genes of miR‐99a‐5p. Interestingly, a negative correlation was found between these four genes and miR‐99a‐5p, with PIK3D and IGFR1 showing significant negative correlation with miR‐99a‐5p in HNSCC and PDGFRB and MTOR showing a mild negative correlation. Thus, together with the findings of previous researches and our results, we speculated that the dysfunctional PI3K‐Akt signaling pathway was implicated in the development of HNSCC. Moreover, it seems that PI3K‐Akt signaling pathway was regulated by miR‐99a‐5p according to the statistical correlation analysis, which further provided evidence for the potential clinical value of miR‐99a‐5p detection in HNSCC.
Statistical analysis of miR‐99a‐5p expression would confirm our speculation. Previous studies have suggested that repressed miR‐99a‐5p may contribute to tumorigenesis via being unable to control the target genes. Thus far, no study has specifically analyzed the miR‐99a‐5p expression level in HNSCC, but several studies have demonstrated the lower expression of miR‐99a‐5p in HNSCC 46, 51, 59. According to our GEO meta‐analysis and TCGA data mining results, the miR‐99a‐5p expression level was markedly lower in HNSCC than in normal tissues. In addition, miR‐99a‐5p expression was higher in low neoplasm histological grades than high histological grades, and the patient's age may also be a possible clinical parameter. Furthermore, we found that miR‐99a‐5p showed significance in diagnostic and prognostic tests; however, due to limited body fluid samples, the results could not be used as representative and its diagnostic applicability in the clinical setting could not be determined. Thus, additional studies are needed to demonstrate the clinical role of miR‐99a‐5p in the diagnosis and prognosis of HNSCC.
This study has some limitations. First, the different miRNA extraction methods may disturb the results of our meta‐analysis. Second, the HNSCC and corresponding samples were mostly derived from tissue sections, lead to an unverified diagnostic value. Third, although we utilized TCGA data to expand our data, the big gap between the quantity of cancerous and noncancerous tissues brought down the reliability. And fourth, the resource of online protein databases and relevant immunohistochemical staining samples were limited so that we could not further validate the function of miR‐99a‐5p via the protein level of hub genes. Despite these limitations, based on our meta‐analysis, the results suggest that miR‐99a‐5p expression was significantly lower in HNSCC than in normal tissue. Biological analysis also suggested that miR‐99a‐5p may participate in HNSCC by suppressing the hub genes, PIK3CD, IGFR1, PNGFRB, and MTOR.
In general, our study confirmed that miR‐99a‐5p might be a tumor suppressor in HNSCC with downregulated expression in HNSCC tissues, via the PI3K‐Akt signaling pathway. Further studies are required to elucidate the role of miR‐99a‐5p in diagnosis and prognosis for HNSCC and provide the basis for that miR‐99a‐5p execute its function via the protein level of the targets, especially those hub genes predicted by our research.
Author contributions
YQ, KH, FW, and YF conceived and designed the study. YC and JY collected, extracted, and analyzed the data. YQ and KH guided the statistical process and ensured the necessary graphs. YC and JY wrote the manuscript. All authors read and approved the final manuscript.
Supporting information
Fig. S1. (A‐K): Scatter plots of miR‐99a‐5p expression data in normal and HNSCC tissues in the other 11 microarrays without statistical significance. (L‐X): ROC curves of the other 13 microarrays without statistical significance.
Acknowledgements
The study was supported by the Youth Science Foundation of Guangxi Medical University (GXMUYSF2014032, YF and GXMUYSF201622, KH) and the Sharing Project Based on Tumor Precise Radiotherapy (ZY 18057006, YF).
References
- 1. Liu S, Ye D, Wang T, Guo W, Song H, Liao Y, Xu D, Zhu H, Zhang Z and Deng J (2017) Repression of GPRC5A is associated with activated STAT3, which contributes to tumor progression of head and neck squamous cell carcinoma. Cancer Cell Int 17, 34. [DOI] [PMC free article] [PubMed] [Google Scholar]
- 2. Au JK, Alonso J, Kuan EC, Arshi A and St John MA (2017) Primary squamous cell carcinoma of the thyroid: a population‐based analysis. Otolaryngol Head Neck Surg 157, 25–29. [DOI] [PubMed] [Google Scholar]
- 3. Feng JF, Chen S and Yang X (2017) Combination of c‐reactive protein and squamous cell carcinoma antigen in predicting postoperative prognosis for patients with squamous cell carcinoma of the esophagus. Oncotarget 8, 63132–63139. [DOI] [PMC free article] [PubMed] [Google Scholar]
- 4. Gu Z, Fang X, Li C, Chen C, Liang G, Zheng X and Fan Q (2017) Increased PTPRA expression leads to poor prognosis through c‐Src activation and G1 phase progression in squamous cell lung cancer. Int J Oncol 51, 489–497. [DOI] [PMC free article] [PubMed] [Google Scholar]
- 5. Taneja Y, Ram P, Dhaked SK and Sen TK (2017) Squamous cell carcinoma penis in a case of urethral stricture due to lichen sclerosus balanitis xerotica obliterans: a case report and review of literature. J Clin Diagn Res 11, PD17–PD18. [DOI] [PMC free article] [PubMed] [Google Scholar]
- 6. Moriyama H, Kajiwara M and Yonehara S (2016) Primary squamous cell carcinoma of the prostate in which docetaxel therapy was effective : a case report. Hinyokika Kiyo 62, 259–264. [PubMed] [Google Scholar]
- 7. Terada T (2010) Synchronous squamous cell carcinoma of the kidney, squamous cell carcinoma of the ureter, and sarcomatoid carcinoma of the urinary bladder: a case report. Pathol Res Pract 206, 379–383. [DOI] [PubMed] [Google Scholar]
- 8. Fedus T, Ras R, Ksiazek M, Filipowska J, Kaznowska E, Skret A, Skret‐Magierlo J and Barnas E (2017) Primary vaginal squamous cell carcinoma with bladder involvement in uterine prolapsed patient: case report. Medicine (Baltimore) 96, e8993. [DOI] [PMC free article] [PubMed] [Google Scholar]
- 9. Ellingsen C, Andersen LM, Galappathi K and Rofstad EK (2015) Hypoxia biomarkers in squamous cell carcinoma of the uterine cervix. BMC Cancer 15, 805. [DOI] [PMC free article] [PubMed] [Google Scholar]
- 10. Sterba KR, Garrett‐Mayer E, Carpenter MJ, Tooze JA, Hatcher JL, Sullivan C, Tetrick LA, Warren GW, Day TA, Alberg AJ et al (2017) Smoking status and symptom burden in surgical head and neck cancer patients. Laryngoscope 127, 127–133. [DOI] [PMC free article] [PubMed] [Google Scholar]
- 11. Sawabe M, Ito H, Oze I, Hosono S, Kawakita D, Tanaka H, Hasegawa Y, Murakami S and Matsuo K (2017) Heterogeneous impact of alcohol consumption according to treatment method on survival in head and neck cancer: a prospective study. Cancer Sci 108, 91–100. [DOI] [PMC free article] [PubMed] [Google Scholar]
- 12. Udager AM and McHugh JB (2017) Human papillomavirus‐associated neoplasms of the head and neck. Surg Pathol Clin 10, 35–55. [DOI] [PubMed] [Google Scholar]
- 13. Schrock A, Leisse A, de Vos L, Gevensleben H, Droge F, Franzen A, Wachendorfer M, Schrock F, Ellinger J, Teschke M et al (2017) Free‐circulating methylated DNA in blood for diagnosis, staging, prognosis, and monitoring of head and neck squamous cell carcinoma patients: an observational prospective cohort study. Clin Chem 63, 1288–1296. [DOI] [PubMed] [Google Scholar]
- 14. Cui L, Cheng S, Liu X, Messadi D, Yang Y and Hu S (2016) Syntenin‐1 is a promoter and prognostic marker of head and neck squamous cell carcinoma invasion and metastasis. Oncotarget 7, 82634–82647. [DOI] [PMC free article] [PubMed] [Google Scholar]
- 15. Yu V, Singh P, Rahimy E, Zheng H, Kuo SZ, Kim E, Wang‐Rodriguez J and Ongkeko WM (2016) RNA‐seq analysis identifies key long non‐coding RNAs connected to the pathogenesis of alcohol‐associated head and neck squamous cell carcinoma. Oncol Lett 12, 2846–2853. [DOI] [PMC free article] [PubMed] [Google Scholar]
- 16. Rothenberg SM and Ellisen LW (2012) The molecular pathogenesis of head and neck squamous cell carcinoma. J Clin Invest 122, 1951–1957. [DOI] [PMC free article] [PubMed] [Google Scholar]
- 17. Xu CZ, Jiang C, Wu Q, Liu L, Yan X and Shi R (2016) A feed‐forward regulatory loop between HuR and the long noncoding RNA HOTAIR promotes head and neck squamous cell carcinoma progression and metastasis. Cell Physiol Biochem 40, 1039–1051. [DOI] [PubMed] [Google Scholar]
- 18. Ma SR, Mao L, Deng WW, Li YC, Bu LL, Yu GT, Zhang WF and Sun ZJ (2017) AGR2 promotes the proliferation, migration and regulates epithelial‐mesenchymal transition in salivary adenoid cystic carcinoma. Am J Transl Res 9, 507–519. [PMC free article] [PubMed] [Google Scholar]
- 19. Wang C, Cheng Y, Liu H, Xu Y, Peng H, Lang J, Liao J, Liu H, Liu H and Fan J (2016) Pectolinarigenin suppresses the tumor growth in nasopharyngeal carcinoma. Cell Physiol Biochem 39, 1795–1803. [DOI] [PubMed] [Google Scholar]
- 20. Huang J, Zhang J, Shi C, Liu L and Wei Y (2016) Survival, recurrence and toxicity of HNSCC in comparison of a radiotherapy combination with cisplatin versus cetuximab: a meta‐analysis. BMC Cancer 16, 689. [DOI] [PMC free article] [PubMed] [Google Scholar]
- 21. Mohanti BK, Thakar A, Kaur J, Bahadur S, Malik M, Gandhi AK, Bhasker S and Sharma A (2017) Postoperative radiotherapy dose requirement in standard combined‐modality practice for head and neck squamous cell carcinoma: analysis of salient surgical and radiotherapy parameters in 2 cohorts. Head Neck 39, 1788–1796. [DOI] [PubMed] [Google Scholar]
- 22. Sun W, Wei FQ, Li WJ, Wei JW, Zhong H, Wen YH, Lei WB, Chen L, Li H, Lin HQ et al (2017) A positive‐feedback loop between tumour infiltrating activated Treg cells and type 2‐skewed macrophages is essential for progression of laryngeal squamous cell carcinoma. Br J Cancer 117, 1631–1643. [DOI] [PMC free article] [PubMed] [Google Scholar]
- 23. Hilly O, Strenov Y, Rath‐Wolfson L, Hod R, Shkedy Y, Mizrachi A, Koren R and Shpitzer T (2016) The predictive value of dendritic cells in early squamous cell carcinoma of the tongue. Pathol Res Pract 212, 1138–1143. [DOI] [PubMed] [Google Scholar]
- 24. Kumamoto T, Seki N, Mataki H, Mizuno K, Kamikawaji K, Samukawa T, Koshizuka K, Goto Y and Inoue H (2016) Regulation of TPD52 by antitumor microRNA‐218 suppresses cancer cell migration and invasion in lung squamous cell carcinoma. Int J Oncol 49, 1870–1880. [DOI] [PMC free article] [PubMed] [Google Scholar]
- 25. Mizuno K, Seki N, Mataki H, Matsushita R, Kamikawaji K, Kumamoto T, Takagi K, Goto Y, Nishikawa R, Kato M et al (2016) Tumor‐suppressive microRNA‐29 family inhibits cancer cell migration and invasion directly targeting LOXL2 in lung squamous cell carcinoma. Int J Oncol 48, 450–460. [DOI] [PMC free article] [PubMed] [Google Scholar]
- 26. Powrozek T, Kuznar‐Kaminska B, Dziedzic M, Mlak R, Batura‐Gabryel H, Sagan D, Krawczyk P, Milanowski J and Malecka‐Massalska T (2017) The diagnostic role of plasma circulating precursors of miRNA‐944 and miRNA‐3662 for non‐small cell lung cancer detection. Pathol Res Pract 213, 1384–1387. [DOI] [PubMed] [Google Scholar]
- 27. Nunez Lopez YO, Victoria B, Golusinski P, Golusinski W and Masternak MM (2018) Characteristic miRNA expression signature and random forest survival analysis identify potential cancer‐driving miRNAs in a broad range of head and neck squamous cell carcinoma subtypes. Rep Pract Oncol Radiother 23, 6–20. [DOI] [PMC free article] [PubMed] [Google Scholar]
- 28. Suetsugu T, Koshizuka K, Seki N, Mizuno K, Okato A, Arai T, Misono S, Uchida A, Kumamoto T and Inoue H (2018) Downregulation of matrix metalloproteinase 14 by the antitumor miRNA, miR‐150‐5p, inhibits the aggressiveness of lung squamous cell carcinoma cells. Int J Oncol 52, 913–924. [DOI] [PubMed] [Google Scholar]
- 29. Wang HB, Jiang ZB and Li M (2014) Research on the typical miRNA and target genes in squamous cell carcinoma and adenocarcinoma of esophagus cancer with DNA microarray. Pathol Oncol Res 20, 245–252. [DOI] [PubMed] [Google Scholar]
- 30. Zhang X, Gee H, Rose B, Lee CS, Clark J, Elliott M, Gamble JR, Cairns MJ, Harris A, Khoury S et al (2016) Regulation of the tumour suppressor PDCD4 by miR‐499 and miR‐21 in oropharyngeal cancers. BMC Cancer 16, 86. [DOI] [PMC free article] [PubMed] [Google Scholar]
- 31. Irani S (2016) miRNAs signature in head and neck squamous cell carcinoma metastasis: a literature review. J Dent (Shiraz) 17, 71–83. [PMC free article] [PubMed] [Google Scholar]
- 32. Sun X, Xiao D, Xu T and Yuan Y (2016) miRNA‐24‐3p promotes cell proliferation and regulates chemosensitivity in head and neck squamous cell carcinoma by targeting CHD5. Future Oncol 12, 2701–2712. [DOI] [PubMed] [Google Scholar]
- 33. Moratin J, Hartmann S, Brands R, Brisam M, Mutzbauer G, Scholz C, Seher A, Muller‐Richter U, Kubler AC and Linz C (2016) Evaluation of miRNA‐expression and clinical tumour parameters in oral squamous cell carcinoma (OSCC). J Craniomaxillofac Surg 44, 876–881. [DOI] [PubMed] [Google Scholar]
- 34. Li J, Song ZJ, Wang YY, Yin Y, Liu Y and Nan X (2016) Low levels of serum miR‐99a is a predictor of poor prognosis in breast cancer. Genet Mol Res 15, 1–8. [DOI] [PubMed] [Google Scholar]
- 35. Li Y, Zhang Z, Zhang X, Lin Y, Luo T, Xiao Z and Zhou Q (2016) A dual PI3K/AKT/mTOR signaling inhibitor miR‐99a suppresses endometrial carcinoma. Am J Transl Res 8, 719–731. [PMC free article] [PubMed] [Google Scholar]
- 36. Xing B and Ren C (2016) Tumor‐suppressive miR‐99a inhibits cell proliferation via targeting of TNFAIP8 in osteosarcoma cells. Am J Transl Res 8, 1082–1090. [PMC free article] [PubMed] [Google Scholar]
- 37. Feng Y, Kang Y, He Y, Liu J, Liang B, Yang P and Yu Z (2014) microRNA‐99a acts as a tumor suppressor and is down‐regulated in bladder cancer. BMC Urol 14, 50. [DOI] [PMC free article] [PubMed] [Google Scholar]
- 38. Gu W, Fang S, Gao L, Tan Y and Yang Z (2013) Clinic significance of microRNA‐99a expression in human lung adenocarcinoma. J Surg Oncol 108, 248–255. [DOI] [PubMed] [Google Scholar]
- 39. Li D, Liu X, Lin L, Hou J, Li N, Wang C, Wang P, Zhang Q, Zhang P, Zhou W et al (2011) MicroRNA‐99a inhibits hepatocellular carcinoma growth and correlates with prognosis of patients with hepatocellular carcinoma. J Biol Chem 286, 36677–36685. [DOI] [PMC free article] [PubMed] [Google Scholar]
- 40. Cappuzzo F, Sacconi A, Landi L, Ludovini V, Biagioni F, D'Incecco A, Capodanno A, Salvini J, Corgna E, Cupini S et al (2014) MicroRNA signature in metastatic colorectal cancer patients treated with anti‐EGFR monoclonal antibodies. Clin Colorectal Cancer 13, 37–45. e4. [DOI] [PubMed] [Google Scholar]
- 41. Oliveira RC, Ivanovic RF, Leite KRM, Viana NI, Pimenta RCA, Junior JP, Guimaraes VR, Morais DR, Abe DK, Nesrallah AJ et al (2017) Expression of micro‐RNAs and genes related to angiogenesis in ccRCC and associations with tumor characteristics. BMC Urol 17, 113. [DOI] [PMC free article] [PubMed] [Google Scholar]
- 42. Wang X, Li Y, Qi W, Zhang N, Sun M, Huo Q, Cai C, Lv S and Yang Q (2015) MicroRNA‐99a inhibits tumor aggressive phenotypes through regulating HOXA1 in breast cancer cells. Oncotarget 6, 32737–32747. [DOI] [PMC free article] [PubMed] [Google Scholar]
- 43. Yang Z, Han Y, Cheng K, Zhang G and Wang X (2014) miR‐99a directly targets the mTOR signalling pathway in breast cancer side population cells. Cell Prolif 47, 587–595. [DOI] [PMC free article] [PubMed] [Google Scholar]
- 44. Yu SH, Zhang CL, Dong FS and Zhang YM (2015) miR‐99a suppresses the metastasis of human non‐small cell lung cancer cells by targeting AKT1 signaling pathway. J Cell Biochem 116, 268–276. [DOI] [PubMed] [Google Scholar]
- 45. Zhang Y, Xu W, Ni P, Li A, Zhou J and Xu S (2016) MiR‐99a and MiR‐491 regulate cisplatin resistance in human gastric cancer cells by targeting CAPNS1. Int J Biol Sci 12, 1437–1447. [DOI] [PMC free article] [PubMed] [Google Scholar]
- 46. Chen D, Cabay RJ, Jin Y, Wang A, Lu Y, Shah‐Khan M and Zhou X (2013) MicroRNA deregulations in head and neck squamous cell carcinomas. J Oral Maxillofac Res 4, e2. [DOI] [PMC free article] [PubMed] [Google Scholar]
- 47. Hou B, Ishinaga H, Midorikawa K, Shah SA, Nakamura S, Hiraku Y, Oikawa S, Murata M and Takeuchi K (2015) Circulating microRNAs as novel prognosis biomarkers for head and neck squamous cell carcinoma. Cancer Biol Ther 16, 1042–1046. [DOI] [PMC free article] [PubMed] [Google Scholar]
- 48. Tang Z, Li C, Kang B, Gao G, Li C and Zhang Z (2017) GEPIA: a web server for cancer and normal gene expression profiling and interactive analyses. Nucleic Acids Res 45, W98–W102. [DOI] [PMC free article] [PubMed] [Google Scholar]
- 49. Kuo YZ, Tai YH, Lo HI, Chen YL, Cheng HC, Fang WY, Lin SH, Yang CL, Tsai ST and Wu LW (2014) MiR‐99a exerts anti‐metastasis through inhibiting myotubularin‐related protein 3 expression in oral cancer. Oral Dis 20, e65–e75. [DOI] [PubMed] [Google Scholar]
- 50. Yen YC, Shiah SG, Chu HC, Hsu YM, Hsiao JR, Chang JY, Hung WC, Liao CT, Cheng AJ, Lu YC et al (2014) Reciprocal regulation of microRNA‐99a and insulin‐like growth factor I receptor signaling in oral squamous cell carcinoma cells. Mol Cancer 13, 6. [DOI] [PMC free article] [PubMed] [Google Scholar]
- 51. Chen Z, Jin Y, Yu D, Wang A, Mahjabeen I, Wang C, Liu X and Zhou X (2012) Down‐regulation of the microRNA‐99 family members in head and neck squamous cell carcinoma. Oral Oncol 48, 686–691. [DOI] [PMC free article] [PubMed] [Google Scholar]
- 52. Shi Y, Bo Z, Pang G, Qu X, Bao W, Yang L and Ma Y (2017) MiR‐99a‐5p regulates proliferation, migration and invasion abilities of human oral carcinoma cells by targeting NOX4. Neoplasma 64, 666–673. [DOI] [PubMed] [Google Scholar]
- 53. Wang JG, Tang WP, Liao MC, Liu YP and Ai XH (2017) MiR‐99a suppresses cell invasion and metastasis in nasopharyngeal carcinoma through targeting HOXA1. Onco Targets Ther 10, 753–761. [DOI] [PMC free article] [PubMed] [Google Scholar]
- 54. Gambari R, Brognara E, Spandidos DA and Fabbri E (2016) Targeting oncomiRNAs and mimicking tumor suppressor miRNAs: new trends in the development of miRNA therapeutic strategies in oncology (Review). Int J Oncol 49, 5–32. [DOI] [PMC free article] [PubMed] [Google Scholar]
- 55. Nguyen DD and Chang S (2017) Development of novel therapeutic agents by inhibition of oncogenic MicroRNAs. Int J Mol Sci 19, E65. [DOI] [PMC free article] [PubMed] [Google Scholar]
- 56. Mei LL, Qiu YT, Huang MB, Wang WJ, Bai J and Shi ZZ (2017) MiR‐99a suppresses proliferation, migration and invasion of esophageal squamous cell carcinoma cells through inhibiting the IGF1R signaling pathway. Cancer Biomark 20, 527–537. [DOI] [PubMed] [Google Scholar]
- 57. Sun M, Hong S, Li W, Wang P, You J, Zhang X, Tang F, Wang P and Zhang C (2016) MiR‐99a regulates ROS‐mediated invasion and migration of lung adenocarcinoma cells by targeting NOX4. Oncol Rep 35, 2755–2766. [DOI] [PubMed] [Google Scholar]
- 58. Doghman M, El Wakil A, Cardinaud B, Thomas E, Wang J, Zhao W, Peralta‐Del Valle MH, Figueiredo BC, Zambetti GP and Lalli E (2010) Regulation of insulin‐like growth factor‐mammalian target of rapamycin signaling by microRNA in childhood adrenocortical tumors. Cancer Res 70, 4666–4675. [DOI] [PMC free article] [PubMed] [Google Scholar]
- 59. Yan B, Fu Q, Lai L, Tao X, Fei Y, Shen J, Chen Z and Wang Q (2012) Downregulation of microRNA 99a in oral squamous cell carcinomas contributes to the growth and survival of oral cancer cells. Mol Med Rep 6, 675–681. [DOI] [PubMed] [Google Scholar]
- 60. Ersahin T, Tuncbag N and Cetin‐Atalay R (2015) The PI3K/AKT/mTOR interactive pathway. Mol BioSyst 11, 1946–1954. [DOI] [PubMed] [Google Scholar]
- 61. Kumar D, Haldar S, Gorain M, Kumar S, Mulani FA, Yadav AS, Miele L, Thulasiram HV and Kundu GC (2018) Epoxyazadiradione suppresses breast tumor growth through mitochondrial depolarization and caspase‐dependent apoptosis by targeting PI3K/Akt pathway. BMC Cancer 18, 52. [DOI] [PMC free article] [PubMed] [Google Scholar]
- 62. Shi L, Zhao SM, Luo Y, Zhang AW, Wei LH, Xie ZY, Li YY and Ma W (2017) MiR‐375: a prospective regulator in medullary thyroid cancer based on microarray data and bioinformatics analyses. Pathol Res Pract 213, 1344–1354. [DOI] [PubMed] [Google Scholar]
- 63. Ye J, Huang J, Xu J, Huang Q, Wang J, Zhong W, Lin X, Li Y and Lin X (2017) ERp29 controls invasion and metastasis of gastric carcinoma by inhibition of epithelial‐mesenchymal transition via PI3K/Akt signaling pathway. BMC Cancer 17, 626. [DOI] [PMC free article] [PubMed] [Google Scholar]
Associated Data
This section collects any data citations, data availability statements, or supplementary materials included in this article.
Supplementary Materials
Fig. S1. (A‐K): Scatter plots of miR‐99a‐5p expression data in normal and HNSCC tissues in the other 11 microarrays without statistical significance. (L‐X): ROC curves of the other 13 microarrays without statistical significance.


