



Abstract
The olfactory epithelium (OE) of vertebrates is a highly regenerative neuroepithelium that is maintained under normal conditions by a population of stem and progenitor cells, globose basal cells (GBCs), which also contribute to epithelial reconstitution after injury. However, aging of the OE often leads to neurogenic exhaustion, the disappearance of both GBCs and olfactory sensory neurons (OSNs). Aneuronal tissue may remain as olfactory, with an uninterrupted sheet of apically arrayed microvillar-capped sustentacular cell, or may undergo respiratory metaplasia. We have generated a transgenic mouse model for neurogenic exhaustion using olfactory marker protein-driven Tet-off regulation of the A subunit of Diphtheria toxin such that the death of mature OSNs is accelerated. At as early as 2 months of age, the epithelium of transgenic mice, regardless of sex, recapitulates what is seen in the aged OE of humans and rodents. Areas of the epithelium completely lack neurons and GBCs; whereas the horizontal basal cells, a reserve stem cell population, show no evidence of activation. Surprisingly, other areas that were olfactory undergo respiratory metaplasia. The impact of accelerated neuronal death and reduced innervation on the olfactory bulb (OB) was also examined. Constant neuronal turnover leaves glomeruli shrunken and affects the dopaminergic interneurons in the periglomerular layer. Moreover, the acceleration of OSN death can be reversed in those areas where some GBCs persist. However, the projection onto the OB recovers incompletely and the reinnervated glomeruli are markedly altered. Therefore, the capacity for OE regeneration is tempered when GBCs disappear.
SIGNIFICANCE STATEMENT A large percentage of humans lose or suffer a significant decline in olfactory function as they age. Therefore, quality of life suffers and safety and nutritional status are put at risk. With age, the OE apparently becomes incapable of fully maintaining the neuronal population of the epithelium despite its well known capacity for recovering from most forms of injury when younger. Efforts to identify the mechanism by which olfactory neurogenesis becomes exhausted with age require a powerful model for accelerating age-related tissue pathology. The current OMP-tTA;TetO-DTA transgenic mouse model, in which olfactory neurons die when they reach maturity and accelerated death can be aborted to assess the capacity for structural recovery, satisfies that need.
Keywords: aging, degeneration, neuroepithelium, olfactory, stem
Introduction
With age, our ability to smell deteriorates. Although various diseases and environmental factors may contribute, one study reports that >60% of the population between the ages of 65 and 80 years and 80% of those >80 years of age have olfactory impairment. Age is arguably the number one cause of olfactory impairment (Doty et al., 1984) and anosmia has been identified as a predictor of 5-year mortality in people between 57 and 85 (Pinto et al., 2014).
Age-associated decline in regenerative capacity is usually due to dysfunction or disappearance of the adult tissue stem cells that are responsible for maintaining the tissue. For example, in the hematopoietic system, the bone marrow stem cells are regulated through multiple intrinsic/extrinsic factors that set a balance between activation versus dormancy; that balance and the capacity of the stem cells to replenish the blood are affected by age (Rando, 2006). An imbalance between activation and dormancy can then lead to pathologic consequences such as cancer or organ failure (Vilchez et al., 2014).
In the case of the olfactory epithelium (OE), a pseudostratified neuroepithelium lining the nasal cavity, tissue stem cells are activated in response to damage and can replace cells that were lost, including the olfactory sensory neurons (OSNs). The regenerative capacity for OE stem cells after injury has been reported in several injury models (Graziadei et al., 1979; Morrison and Costanzo, 1989; Schwob et al., 1995, 1999). Two separate populations of basal cells act as stem cells in the OE. The first are the globose basal cells (GBCs), among which are the active stem cell population responsible for day-to-day maintenance of the neuronal population (Graziadei and Graziadei, 1979) and which can regenerate the entire epithelium after epithelial injury (Huard et al., 1998; Chen et al., 2004). The second group are the horizontal basal cells (HBCs), which are a reserve stem population that is activated by severe direct epithelial injury and can also regenerate the OE under the appropriate conditions (Leung et al., 2007; Schnittke et al., 2015).
In apparent contrast to the regenerative capacity exemplified by the manipulations described above, our group and others have shown that the OE of elderly humans often contains large areas of the epithelium devoid of neurons and GBCs (Nakashima et al., 1984; Holbrook et al., 2005, 2011). Moreover, the same has been noted in aged mice (Kondo et al., 2009; Van de Bittner et al., 2017). The emergence of an aneuronal OE lacking GBCs leads to the notion that this population can become exhausted either due to intrinsic limits on the proliferative potential of GBC stem cells or to an imbalance in the putative environmental cues directing toward progression or self-renewal (Kondo et al., 2010).
A detailed and mechanistic understanding of the consequences of aging on the OE requires an animal model that mimics the pathology of neurogenic exhaustion and respiratory metaplasia on an accelerated time scale. Consistent with the hypothesis that accelerated turnover of OSNs causes an abbreviated lifespan, we challenged GBCs in the mouse OE to deplete their progenitive potential by means of constantly destroying OSNs, which is the likely mechanism underlying the neurogenic exhaustion in a prior, and now unavailable, mouse model (Largent et al., 1993). We took advantage of the TetO system for gene regulation (Gossen and Bujard, 1992) and crossed OMP-tTA and TetO-DTA mouse strains to drive expression of the A subunit of Diphtheria toxin (DTA) in mature OSNs. It is also advantageous that DTA expression in mice of the OMP-tTA;TetO-DTA genotype can be terminated by doxycyline ingestion. We report that the OE in these mice quickly develop similar pathologies as noted in the aged human OE, including neurogenic exhaustion of OE and a progression to respiratory metaplasia. Recovery upon doxycycline-mediated reversal of accelerated turnover is only partial in the absence of other types of intervention.
Materials and Methods
Animals.
All mice were kept in a heat and humidity controlled, Association for Assessment and Accreditation of Laboratory Animal Care International-accredited vivarium operating under a standard light/dark cycle. All protocols have been approved by the Committee for the Humane Use of Animals at Tufts University School of Medicine, where the mice were housed and the experiments were conducted.
OMP-tTA mice purchased from the The Jackson Laboratory (stock #017754) (Yu et al., 2004; Nguyen et al., 2007) were crossed with the TetO-DTA mice also purchased from The Jackson Laboratory (stock #008468) (Gossen and Bujard, 1992; Lee et al., 1998). Mice of the desired genotype (OMP-tTA;TetO-DTA) were either maintained ad libitum on standard rodent chow and water or on chow containing 200 mg of doxycycline (doxy chow) and killed at 2, 4, or 6 months of age. Recovery mouse tissue was collected after 2 or 4 months on regular chow, followed by an additional 2 months on doxy chow to relieve the accelerated neuronal turnover caused by DTA expression and thereby assess the consequences with respect to basal cell activation.
K5-CreERT2 mice were provided by P. Chambon (University of Strasbourg Institute for Advanced Study, Strasbourg, France via R. Reed, Johns Hopkins University School of Medicine, Baltimore) and Rosa26-fl(stop)-TdTomato mice were purchased from the The Jackson Laboratory (stock #007909). The two strains were crossed together and bred to homozygosity (Schnittke et al., 2015; Herrick et al., 2017). Intraperitoneal tamoxifen injections were performed at 6 weeks of age and tissue was harvested at 18–26 months.
Tissue processing.
Mice were injected subcutaneously with BrdU (100 mg/kg) 2 h before killing. At time points indicated in the experiments, mice were anesthetized by intraperitoneal injection of a triple mixture of ketamine (37.5 mg/kg), xylazine (7.5 mg/kg), and acepromazine (1.25 mg/kg). These mice were then transcardially flushed with PBS and perfused with Zamboni's fixative (2% PFA; 15% picric acid; pH 7.3). After dissection, the tissue was postfixed under vacuum for 1 h in Zamboni's fixative, washed in PBS, and placed in saturated EDTA overnight. The tissue was then cryoprotected in 30% sucrose in PBS, placed in optimal cutting temperature (OCT) compound (Miles), and frozen in liquid nitrogen. Coronal sections were cut on a Leica cryostat at 10 μm, mounted on “Plus” slides (Thermo Fisher Scientific), and stored at −20°C until needed.
Immunostaining.
Primary antibodies that are used in this study and their RRID codes are listed in Table 1. The antibody against P63 was derived from a hybridoma line (4A4) obtained from American Type Culture Collection (ATCC Manassas, VA, catalog number PTA-6626) (Yang et al., 1998). Before immunostaining, tissue sections were rinsed in PBS to remove OCT and underwent antibody-specific pretreatments. The pretreatments include heating in 0.01 m citrate buffer, pH 6.0, for 10 min in a commercial food steamer and incubation in 3% hydrogen peroxide in MeOH for 5 min. Sections were blocked with 10% donkey serum/5% nonfat dry milk/4% BSA/0.1% Triton X-100 in PBS and incubated overnight with primary antibody. Table 2 provides the conditions (concentrations and pretreatments) for primary antibodies used in immunohistochemical staining on both human and mouse sections and the cell types recognized by each antibody. The following day, the staining was visualized using an array of fluorescent-tagged antibodies. Unless otherwise indicated, Hoechst was used for a nuclear counterstain. Slides were coverslipped with 0.1 m n-propyl gallate.
Table 1.
Identification of antibodies used in this study
| Primary antibody | Source and catalog no. | RRID | Species |
|---|---|---|---|
| BrdU | Abcam ab6326 | AB_305426 | Rat |
| βIV tubulin | Abcam ab179509 | AB_2716759 | Rabbit |
| CD3 | BioLegend 100201 | AB_312658 | Rat |
| CD19 | LSBio LS-C122956 | AB_10801983 | Rat |
| CK14 | Proteintech 10143-1-AP | AB_2134831 | Rabbit |
| Cleaved Caspase III | Cell Signaling Technology 9661S | AB_2341188 | Rabbit |
| GAP43 | Abcam EP890Y | AB_1310252 | Rabbit |
| Iba1 | Wako 019-19741 | AB_839504 | Rabbit |
| Ki67 | BD Biosciences 556003 | AB_396287 | Mouse |
| Ly6g | LSBio LS-C112469 | AB_10699395 | Rat |
| MOR28 | Invitrogen OSR00212W | AB_962172 | Rabbit |
| ND1 | R&D Systems AF2746 | AB_150440 | Rabbit |
| OMP | Santa Cruz Biotechnology sc-49070 | AB_2158008 | Goat |
| OMP | Santa Cruz Biotechnology sc-365818 | AB_10842164 | Mouse |
| P63 | ATCC | N/A | Mouse |
| PGP 9.5 | Proteintech14730-1-AP | AB_2210497 | Rabbit |
| Sox2 | eBioscience 14-9811-82 | AB_11219471 | Rat |
| Tbx21 | Abcam ab150440 | AB_150440 | Rabbit |
| CK19 | DSHB TROMA-III-c | AB_2133570 | Rat |
| Tuj1 (NST) | BioLegend MMS-435P-250 | AB_2313773 | Mouse |
| Tyrosine hydroxylase | Thermo Fisher Scientific P21962 | AB_2539844 | Rabbit |
| Vglut2 | Synaptic Systems 135402 | AB_2187539 | Rabbit |
P63 antibody was produced in house from a cell line purchased from ATCC (Yang et al., 1998).
Table 2.
Immunohistochemical staining conditions
| Primary antibody | Pretreatment | Antibody concentration | Amplification | Cell types |
|---|---|---|---|---|
| BrdU | Steam | 1:300 | 2° | Proliferating cells |
| βIV tubulin | Steam | 1:1000 (1:1000) | 2° | RE sus cells |
| CD3 | None | 1:100 | 3° | T-cells |
| CD19 | None | 1:100 | 3° | B-cells |
| CK14 | Steam | 1:300 | 2° | HBCs |
| Cleaved Caspase III | None | 1:100 | 2° | Apoptotic cells |
| GAP43 | Steam | 1:750 [1:500] | 3° | Immature OSNs |
| Iba1 | Steam | 1:500 | 3° | Macrophages |
| Ki67 | Steam | 1:300 | 2° | Proliferating cells |
| Ly6g | MeOH | 1:500 | TSA | Granulocytes |
| MOR28 | Steam and MeOH | 1:1000 | TSA | MOR28 OSNs |
| ND1 | Steam and MeOH | 1:600 | TSA | Immediate neuronal precursor GBCs |
| OMP (goat) | Steam | 1:40 (1:100) | 3° | Mature OSNs |
| OMP (mouse) | Steam | 1:40 [1:1000] | 3° | Mature OSNs |
| P63 | Steam and MeOH | 1:500 (1:100) [1:1000] | 2° | Quiescent HBCs |
| PGP 9.5 | Steam | 1:600 [1:10000] | 2° | OSNs |
| Sox2 | Steam | 1:300 (1:300) | 3° | Upstream GBCs, HBCs, sus cells |
| Tbx21 | Steam | 1:100 [1:1000] | 3° | Mitral cell |
| CK19 | Steam | 1:300 | 2° | RE sus cells, HBCs |
| Tuj1 (NST) | Steam | 1:300 (1:1000) | 2° | OSNs |
| Tyrosine Hydroxylase | Steam | 1:100 [1:1000] | 3° | Dopaminergic periglomerular cells |
| Vglut2 | Steam | 1:100 | 3° | Synaptic terminals of OSNs in OB glomeruli |
Several fluorophores were used in this study: Alexa Fluor-488 (green), Cy3 (red), Alexa Fluor-647 (far-red), and Hoechst (blue). All direct fluorophore-conjugated antibodies were purchased from Jackson ImmunoResearch and were used at 1:150 for secondary amplification/detection (2°). For tertiary amplification/detection (3°), biotin-conjugated secondary antibodies (Jackson ImmunoResearch) and fluorophore-conjugated streptavidin (SA) were used at 1:150. For tyramide signal amplification (TSA), SA-HRP and FITC-tyramide were used at 1:400 and 1:100, respectively. All concentrations are for staining for mouse sections. Concentrations used for human sections are indicated in parentheses and concentrations used for Western blot are indicated in brackets.
Whole-mount visualization of the olfactory septum.
To visualize and assess the global extent of epithelial degeneration, the nasal septal mucosa from DTA-on and DTA-off mice was subjected to a modification of the “clarity” technique for intact-tissue imaging (Chung and Deisseroth, 2013; Tomer et al., 2014). The protocol for clearing the OE was modified as described previously (Schnittke et al., 2015). OMP-tTA;TetO-DTA mice fed either a doxy chow or a regular chow for 6 months were perfused with hydrogel monomer (HM) solution [4% acrylamide, 0.025% bis-acrylamide, 4% paraformaldehyde, 0.25% VA-044 (a polymerization thermal initiator), 1× PBS], and the septum containing OE was dissected out and postfixed in HM overnight at 4°C. The OE septum was embedded in HM and polymerized at 37°C. After polymerization, the extra gel around the tissue was removed and the tissue was then cleared in clearing solution (4% SDS, 200 mm boric acid, pH 8.5) for 3–4 d at 40°C while stirring. After washing with 0.1% Triton X-100 in PBS, the tissue was then stained with goat anti-olfactory marker protein (anti-OMP; Santa Cruz Biotechnology, 1:500) and rabbit anti-βIV tubulin (Abcam, 1:1000). The septum was mounted in X-Clarity Mounting Solution (Logos Biosystems). Once fully cleared in the mounting medium, the tissue was imaged on a Zeiss LSM800 confocal microscope in multitrack mode using either EC Plan-Neofluar (10×/0.30 WD = 5.2) or Plan-Apo (20/0.8 WD = 0.55) objectives. After Z-stack stitched images were acquired, Zeiss Zen Blue 3D VisArt was used to generate low-resolution 3D-rendered images. For high-resolution 3D images, Icy in VTK rendering mode was used.
Image analysis.
Stained sections were imaged on a Zeiss LSM800 confocal microscope and Nikon Microphot-SA. These images were assembled using Adobe Photoshop and Illustrator CS5.1. Image analysis and quantification were performed in ImageJ. In all photos, only the balance, contrast, and evenness of illumination were adjusted.
The overall status of the epithelium was determined by mapping the degeneration of the epithelium across the entire OE according to a Grade I–IV classification, with normal-appearing tissue assigned grade 0. The grade of epithelial damage at each point along the OE was defined using a combination of OMP, Ki67, and CK19 labeling to assess the population of mature OSNs, proliferating GBCs, and columnar ciliated respiratory epithelial cells, respectively, as follows: Grade I, decreased OMP+ OSNs and dense Ki67 labeling indicating an increase in proliferative GBCs; Grade II, decreased OMP+ OSNs and sparse Ki67 labeling indicating a decrease in proliferative GBCs; Grade III, absence of OMP+ OSNs and of Ki67+ proliferating GBCs; and Grade IV, absence of neurons in association with CK19 labeling of columnar cells in areas of the epithelium that were demonstrably olfactory in doxy-fed DTA-off mice, thus indicating respiratory metaplasia. The different degrees (grades) of degeneration were then represented on mosaic images of multiple sections along the anteroposterior axis of the epithelium using different colors to signify location and severity. The linear extent of degeneration was quantified on one anterior and one posterior section for each animal and for each time point.
The extent of recovery in the OE of mice switched to doxy chow (DTA-off recovery) was ascertained in anterior sections because the degeneration effects were more severe in this region of OE.
GBC status, cell death, and macrophage recruitment were assayed in the epithelium lining ectoturbinate 2 because the degree of degeneration was most consistent in this region across the large cadre of mice that were analyzed. Cell counts were collected from one anterior and one posterior section using markers for the various populations of GBCs as described in the Results. Linear measurements along the basal lamina of this region were taken and used to normalize the extent and severity of degeneration and were also used to obtain the ratio of GBCs cells per micrometer. For the determination of cleaved Caspase3+, presumptive dying cells and immune cell recruitment were obtained from one section midway through the nose, where the counts were normalized using linear measurement of the entire ectoturbinate 2.
Total area of synaptic neuropil was determined within the glomerular layer of the olfactory bulb using ImageJ. Images of vesicular glutamate transporter 2 (VGlut2) immunolabel were manually thresholded to include all glomerular staining while excluding background. The area of staining was calculated using the “analysis” tool. Individual glomerular size was measured in a related fashion. Images were first modified using two different noise removal tools, the “despeckle” and “remove outliers” tools in ImageJ, the latter of which selects and removes pixels based on the median value of the surrounding pixels. Therefore, random single pixels were eliminated from the counting process. In addition, glomeruli were identified as objects when composed of contiguous pixels in excess of background and a minimum cutoff of 50 pixels in area.
Glomeruli were identified on mosaic images as contiguous pixels of VGlut2 or MOR28 immunostaining above background; area and perimeter of thresholded objects were determined using ImageJ and the entirety of the bulb sections was analyzed in the posterior region of the OB, with ∼20 slides per mouse being used.
Human tissue.
Autopsy nasal specimens were obtained through the National Disease Research Interchange and fixed in 10% formalin in saline. The septal mucosa was stripped off the underlying bone and cartilage. A rectangular area was removed for sectioning and the remaining sheet of mucosa was stained as a whole-mount specimen. Immunohistochemistry on sections was performed as above; however, in the case of the whole-mount specimens, the staining for neurons required pretreatment with 3% hydrogen peroxide for 10 min. The tissue was incubated in primary antibody solution for 5 d and the staining was visualized with a biotinylated secondary antibody and peroxidase system with 3,3′-diaminobenzadine (DAB) as the chromagen. The septal mucosa was then mounted flat on a glass slide and coverslipped with DPX mounting medium with lead weights during drying. Tables 1 and 2 provide a list of the antibodies used and the conditions required for human tissue labeling.
Western blot analysis of epithelial status.
For purposes of additional global analysis, pieces of OE ∼2 mm2 in area were excised from the septum of OMP-tTA;TetO-DTA mice at various doxy-free durations (DTA-on) or equivalent doxy-fed durations (DTA-off, i.e., control), photographed, and areas measured precisely from the photographs. Samples were normalized by area rather than protein concentration due to the differential and variable loss of cells as a function of time and doxy treatment, which precludes the use of a housekeeping protein or other protein for normalization. We confirmed the problem associated with using any other standard for normalization by assessing the concentration of laminin, lamin A, and CK18 in the same samples. For each of these, there were substantial differences in the relative values across samples, most likely as a consequence of the variability in degeneration and/or response of non-neuronal cells and tissue to that degeneration.
In similar fashion, the entire OB was collected at several time points from the two groups. The samples were then resuspended in ice-cold lysis buffer [20 mm Tris pH 7.5, 1 mm EDTA pH 8.0, 1% Triton X-100, 150 mm NaCl, HALT Protease/Phosphatase Inhibitor (Roche)] and pulsed twice for 2 s at 2 kHz on ice using a model 250 Sonifier (Branson Ultrasonics).
To normalize by epithelial area across groups, the samples from the degeneration group were diluted to the same extent as the age-matched controls independently of wet weight. Similarly, for the bulb, the whole bulbs from the animals in the degeneration group were diluted to the same extent as the control independently of the wet weight or volume of the OB.
Bolt LDS Sample Buffer and Reducing Agent (Life Technologies) were added to a final concentration of 1× as per the manufacturer's protocol and samples were denatured at 95°C for 10 min. Then, 30 μl of total lysate from controls and equal volumes from lesioned samples were electrophoresed in a 4–12% Bis-Tris Plus gel using the Bolt Electrophoresis system (Life Technologies). Gels were then transferred to PVDF membrane, blocked in TBS blocking buffer containing 0.1% Tween 20 with 5% milk, and probed with anti-OMP, anti-PGP, anti-GAP43, anti-P63, or anti-tyrosine hydroxylase (TH) overnight at 4°C. The membranes were then washed 3 times with blocking buffer, and incubated for 1 h in HRP-conjugated antibody. Bands were imaged on the ChemiDoc XRS+ System (Bio-Rad) and density was calculated using ImageJ.
Statistical analysis.
Statistical calculations were performed using SigmaPlot software (Systat Software). Images were processed through Fiji (ImageJ) to obtain area and cell counts were manually collected. All mice that were assessed were included in the analysis. All experimental conditions were performed on 3 mice with the ratio of male to female of ∼1:1.
For assessment of the extent of degeneration and the extent of recovery, a one-way ANOVA was run comparing the linear extent of each individual grade of degeneration, as well as a comprehensive value that was calculated by summing the product of the linear extent times the numerical grade for each grade of degeneration; p-values are listed in tabular form. One-way ANOVAs compared the extent of degeneration determined from the Western blot analysis for OMP, GAP43 (as a measure of immature OSNs) and PGP9.5 (as a measure for all OSNs). Unpaired t tests were used for comparison of OMP band intensity. GBC cell counts were assessed for differences using one-way ANOVA across control, Grade I, and Grade II for all time points. For comparisons of Iba1+ macrophages, CD3+ T cells, CD19+ B cells, and Ly6 g+ granulocytes, a three-way ANOVA was run comparing condition (recovery vs control), time (2 months vs 4 months), and cell type. For cleaved caspase III+ cell counts, a one-way ANOVA was used with p-values reported in the Results section. Unpaired t tests for each grade comparison were performed with p-values listed in the Results. Differences in glomerular measurements, TH+ interneuron counts, Tbx21+ mitral cell counts, and TH protein levels were assessed using separate one-way ANOVAs with p-values listed in the Results. The glomerular histograms were collected using ImageJ to obtain all object sizes. Differences in distribution between each group were calculated using a nonparametric rank–sum test. The area and complexity of MOR28 glomeruli was compared using a two-way ANOVA comparing condition (control vs recovery) and location (medial vs lateral). The complexity value was derived from the equation (perimeter)/√(area*4π), which produces a value that is the difference of a perfect circle with the given area.
Results
Aging of the mouse OE resembles the pathology seen in elderly humans
The changes observed with accelerated turnover in our mouse model need to be contextualized by reference to the pathology of the OE in elderly humans. Whole-mount staining of the lining of the nasal cavity in autopsy specimens using an antibody against neuron-specific tubulin (NST) demonstrates interruptions in what was, at birth, a continuous sheet of OSNs (Fig. 1A). The occurrence of areas of the olfactory region that lack olfactory neurons is a common finding in adult human tissue that we examined from 12 subjects (3 females, 9 males, ages 49–87) (Fig. 1A illustrates a typical example of the superior turbinate from a 72-year-old). The gaps are likely to correspond to areas of either respiratory metaplasia (absence of neurons and replacement of Sus cells by ciliated columnar cells) or aneuronal OE (where GBCs and OSNs are absent, but Sus cells remain) (Douek et al., 1975; Holbrook et al., 2011). Microscopic examination of sections of the OE from the same specimen using multiple immunofluorescent labels demonstrates relatively intact areas with a substantial population of both immature, NST+/OMP− neurons and mature, NST+/OMP+ neurons (“N” in Fig. 1B,C). The basal layer of the OE in these areas also contains the expected two types of basal cells: Sox2+, putatively upstream, multipotent GBCs, and P63+/Sox2+ HBCs (Fig. 1D). In contrast and in confirmation of previous reports, portions of OE that corresponding to the NST− patches visible in the whole-mount have one of two compositions. In the one, constituent cells can be labeled with anti-βIV-tubulin, a marker of respiratory columnar epithelial cells, indicating respiratory metaplasia (“R” in Fig. 1B). In the other, the epithelium is absent of βIV-tubulin labeling and lacks all neurons and Sox2+ GBCs (“A” in Fig. 1B,E,F). Sox2+ supporting cells remain prevalent at the apical surface and P63+ HBCs are arrayed linearly along the basal lamina (Fig. 1F).
Figure 1.

Human OE becomes increasingly aneuronal with age. Autopsy sample taken from 74-year-old human shows that the OE contains prominent areas devoid of staining with neuronal markers. A, Whole mount of septum using an antibody against NST (visualized with DAB) to stain OSNs reveals regions of OE lacking any OSNs (indicated by gaps within the NST+ OE). Orientation of the tissue is indicated as dorsal (d), ventral (v), anterior (a), and posterior (p). B, Mosaic image of a section taken from the same sample shown in A showing the neuronal OE with OMP+ (green) and NST+ (magenta) OSNs (designated as “N”) and the RE with βIV-Tubulin+ (gold) columnar cells (designated as “R”); between the neurogenic OE and the RE is a patch of the aneuronal OE with neither of OMP+/NST+ OSNs or βIV-Tubulin+ columnar cells (designated as “A”). Arrows indicate borders between regions and arrowheads indicate basal lamina. Orientation of the tissue is indicated as dorsal (d) and ventral (v). C–F, High magnification of neurogenic regions of OE (C, D) and aneuronal OE (E, F). The neurogenic OE consists of OMP+ (green)/NST+ (magenta) OSNs (C) as well as Sox2+ (green) GBCs (open arrow), Sox2+ (green)/P63+ (magenta) HBCs (white arrows) above the basal lamina (arrowhead) in D and F and Sox2+-supporting cells apically (D). The aneuronal OE lacks OMP+/NST+ neurons (E) and Sox2+ GBCs; however, Sox2+ HBCs are present and remain P63+ indicated by white arrows (F). Scale bars: A, 3 mm; B, 300 μm; C, 20 μm (also applies to D–F). Dashed line indicates basal lamina in C and E.
Given the occurrence of aneuronal epithelium in autopsy specimens of the olfactory area, we also assessed the OE of aged mice. Two sets of animals were available to us. One group of 6 wild-type C57BL/6 mice were allowed to age to ∼2 years of age, when they were killed and coronal sections of the OE collected. Much of the epithelium appeared relatively normal; the population of mature OMP+ neurons was substantial and immature NST+ neurons sat basal to them (Fig. 2A,B). Typical Sox2+ GBCs were found above a row of P63+ HBCs lining the basal lamina (Fig. 2C). However, patches of aneuronal OE are also found in the aged mice as in the human tissue and lack both mature and immature neurons as well as GBCs (Fig. 2A,D,E). As with the human tissue, these aneuronal regions were still populated by P63-expressing HBCs (Fig. 2E). Likewise, regions with respiratory metaplasia were also observed (Fig. 2F). The second group of two mice were of the transgenic line K5-CreERT2;Rosa26-fl(stop)-TdTomato (Schnittke et al., 2015; Herrick et al., 2017). Tamoxifen was injected when the mice were 6 weeks of age, as a consequence of which the majority of the HBCs and their progeny are labeled by expression of TdTomato. These HBC reporter mice survived for 18–26 months before harvest. Examination of the OE indicated that recombination was successful in 50–70% of the HBCs. In much of the epithelium, the TdTomato+ cells remain HBCs and lie flattened against the basal lamina. Rare spontaneous activation occurred in the animals such that an average of 350 non-HBC cells was found per section. Many of the non-HBCs were sustentacular cells and OSNs. However, we did observe instances of metaplastic respiratory epithelium (RE) in which all or the vast majority of ciliated columnar cells were TdTomato+ and thus derived from HBCs (Fig. 2G).
Figure 2.
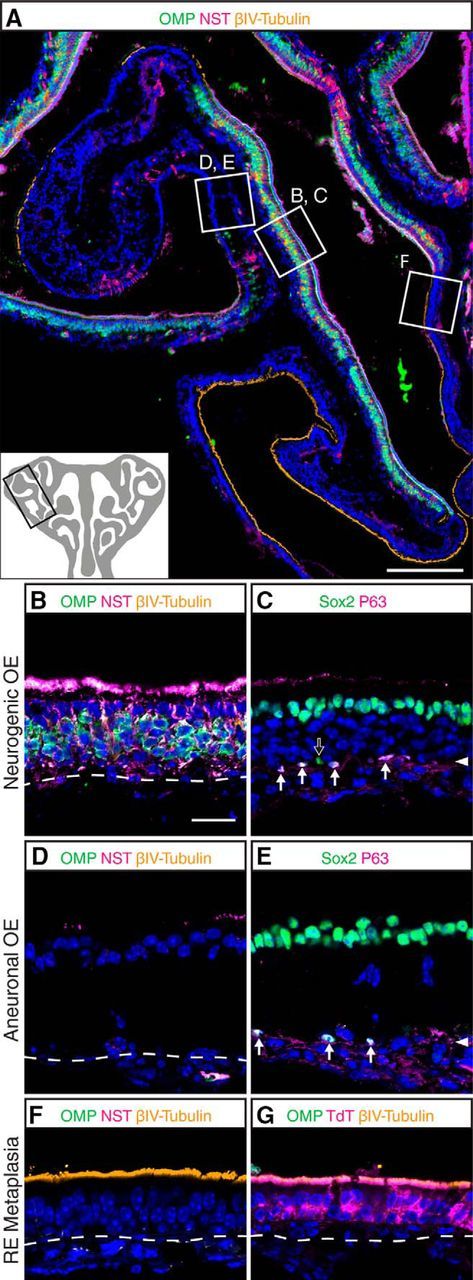
The OE from aging mice contains aneuronal areas similar to the OE from aging humans. Sample taken from 2-year-old wild-type C57BL/6 mouse shows extensive areas devoid of neuronal markers. A, Low magnification of ectoturbinate II of the OE (black box in the diagram inset indicates the location within the OE) shows the lining of both normal and neuronal OE with OMP+ (green) mature and NST+ (magenta) immature OSNs and aneuronal OE lacking OSNs. The RE is identified as βIV-Tubulin+ (gold) at its apical surface. The white boxes depict the areas that were photographed in B–F. B–F, High magnification of neurogenic OE (B, C), aneuronal OE (D, E), and respiratory metaplasia (F) found in aging wild-type C57BL/6 mice. Similar to the human OE (Fig. 1), the normal, neuronal OE consists of OMP+ (green)/NST+ (magenta) OSNs (B) as well as Sox2+ (green) GBCs (open arrow) and Sox2+ (green)/P63+ (magenta) HBCs (white arrows) above the basal lamina (arrowhead) and Sox2+ supporting cells apically (C). The aneuronal OE contains neither OMP+/NST+ nor immature NST+ neurons (D) nor Sox2+ GBCs (E). As in human OE, Sox2+/P63+ HBCs (white arrows) and Sox2+ supporting cells are evident and evidently dormant (E). G, Areas of respiratory metaplasia found in K5-CreERT2;Rosa26-fl(stop)-TdTomato (KT) mice. Neither OMP+ or NST+ neurons are present, however, βIV-Tubulin+/TdTomato+ ciliated columnar cells can be identified. KT mice injected with tamoxifen at 6 weeks and killed at 18 months contain areas of metaplastic RE in which ciliated columnar cells are derived from TdT+ HBCs as a result of activation. Scale bars: A, 3150 μm; B, 20 μm (also applies to C–G). Dashed lines indicate basal lamina in B, C, F, and G; arrowheads indicate basal lamina in D and E.
Development of a mouse model of aging in the OE
A potential explanation for the pathology described above is the exhaustion of neurocompetent stem and progenitor GBCs as a consequence of lifelong neurogenesis. As a corollary to this hypothesis, forcing the OE and GBCs into a chronic state of accelerated turnover might well result in eventual exhaustion of the regenerative potential and early appearance of aneuronal epithelium. Indeed, limited data in the literature suggest that the chronic acceleration of, for example, that which accompanies olfactory bulb ablation, may hasten the onset of such pathological changes (Largent et al., 1993; Kondo et al., 2009, 2010). To test the hypothesis, we took advantage of an inducible “Tet-Off” genetic approach using an OMP-tTA bicistronic targeted mutation in combination with a TetO-DTA transgene (OMP-tTA;TetO-DTA, hereafter) to drive the expression of the tetracycline transactivator protein and to initiate the expression of DTA within mature OSNs. In the absence of doxycycline, DTA expression would cause the death of mature OSNs and, in turn, chronically accelerate neurogenesis (Gossen and Bujard, 1992). This approach has the added virtue of reversibility; supplementation with doxycycline in the diet of these mice displaces the transactivator from the TetO-DTA promoter and prevents DTA expression (Fig. 3A). A dramatic difference is immediately evident when comparing doxy-fed control (+Dox) mice with mice expressing DTA (−Dox) (Fig. 3B,C, respectively). Coronal sections of control mice (+Dox) OE at 4 months of age show a normal band of OMP+ mature OSNs that lines the entire OE (Fig. 3B). In contrast, the layer of mature neurons in OMP-tTA;TetO-DTA heterozygous mice in the absence of doxycycline (−Dox) is either markedly thinner or absent (Fig. 3C). The areas of what should be the OE that lack OMP+ neurons entirely also encompass some where the apical labeling of columnar cells with the anti-CK19 indicates that they have undergone respiratory metaplasia. Therefore, areas of aneuronal epithelium are evident in several locations across the OE, which appear similar to the aged mice described above. Another aberrant feature of the tissue was the finding of cysts deep in the OE within the lamina propria of the OMP-tTA;TetO-DTA mice (see inset in Fig. 3C). These were reminiscent of similar cysts previously described in specimens of the mucosa of elderly humans (Feng et al., 1997).
Figure 3.
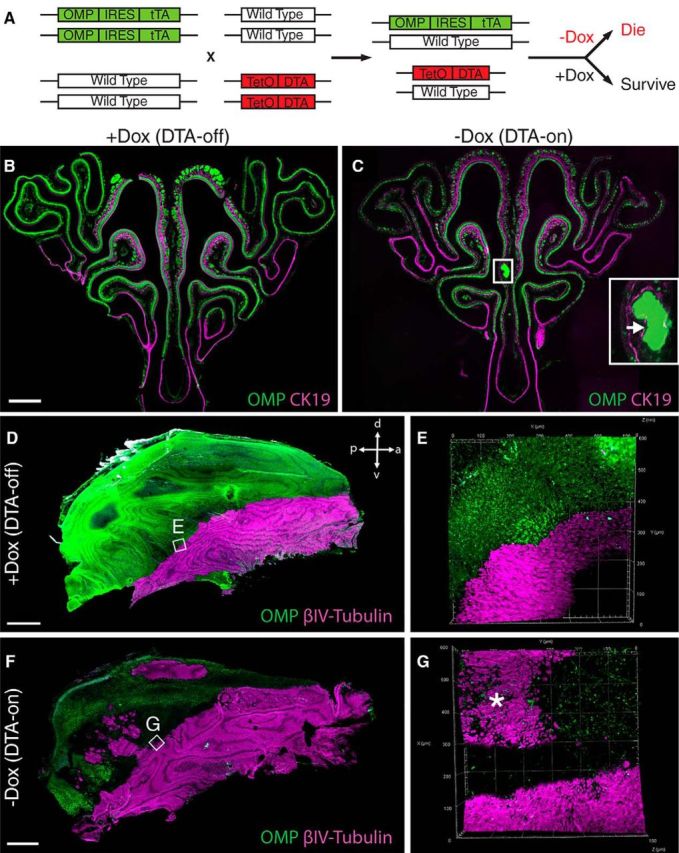
Mouse model of accelerated aging via continuous DTA destruction of mature OSNs. A, Breeding strategy used to generate mice that are heterozygous for the OMP-tTA and TetO-DTA alleles (OMP-tTA;TetO-DTA mice). In this “Tet-Off” paradigm, transcription of DTA leads to the death of OSNs (“Die”) in the absence of doxycycline (−DOX). DTA is not expressed in the presence of doxycycline (+Dox) and OSNs remain alive (“Survive”). B, C, Coronal sections of the OE from a 4 month-old control mouse (+Dox; B) and a 4 month-old degeneration mouse (−DOX, DTA-on; C). Labeling with OMP (green) and CK19 (magenta) mark the mature OSNs in the OE and the apical lining of the RE, respectively. The OSN layer in the degeneration mouse is thinner, the axon bundles are smaller, and the CK19+ RE area expands (C). The higher-magnification inset highlights an example of a cyst commonly observed in degeneration mice. D–G, Confocal images of a cleared whole-mount of septal OE stained with OMP (green) and βIV-Tubulin (magenta) from a 6-month-old control mouse (D) with boxed area (E) at higher magnification and a 6-month-old-Dox OMP-tTA;TetO-DTA mouse (F) with boxed area (G) at higher magnification. The OE from −DOX OMP-tTA;TetO-DTA mouse (F, G) is interrupted with more expanded areas of RE (F and asterisk in G) and swaths of aneuronal OE. Scale bars: B, 600 μm (also applies to C); D, 1 mm (also applies to F). Scale in E and G is shown in Z stack 3-D view (B also applies to C). Orientation in D and E: dorsal (d), ventral (v), posterior (p), and anterior (a).
We examined the extent of the pathology across the entire nasal septum using whole-mount tissue-clearing techniques (Chung and Deisseroth, 2013; Tomer et al., 2014). The septal OE from the control mice (+Dox; DTA-off) is characterized by the typical sharp border between the OMP+-stained neurons in the OE and to the βIV-tubulin+-labeled RE (Fig. 3D,E). In the control, the OE is free of aneuronal patches. In contrast, the septal OE from an age-matched 6-month-old mouse (−Dox; DTA-on) that has undergone degeneration shows reduced OMP staining with interspersed patches of RE and aneuronal epithelium within the region typically identified as OE (Fig. 3F,G). The characteristics of the DTA-expressing mice seen in whole mount here are similar to observations of human autopsy staining demonstrated above (Fig. 1).
Degeneration of the OE in the Dox-free OMP-DTA mice progresses through four grades of severity
To quantify and characterize the degenerative changes in the OE as a function of age in the DTA-expressing mice, we examined the cellular composition of the OE using antibody markers against several cell types: mature neurons (OMP+); immature neurons (NST+); RE (CK19+ cells that are stained by the antibody Troma III, which labels the brush-bordered, columnar cells of the RE, but also weakly labels both the HBCs in the OE and the basal cells in the RE); multipotent GBCs (marked by Sox2 but lacking HBC markers); neuronally committed GBCs [anti-NeuroD1 (ND1)]; proliferating cells (Ki67 and incorporation of BrdU); and HBCs (CK14 and P63). The status of the epithelium in the affected mice undergoing epithelial degeneration (−DOX) was compared with that of control mice (+Dox) according to the following.
The OE (Fig. 4A–C) harvested from doxycycline-fed control mice is indistinguishable from wild-type control animals and composed of the following: (1) a layer of mature OMP+ OSNs that is >5 cells thick (Fig. 4A); (2) a 1- to 2-cell-thick layer of NST+ immature OSNs between the mature neurons and the basal lamina (Fig. 4A), (3) the presence of proliferative Ki67/BrdU+ multipotent Sox2+ GBCs, although sparse and patchily distributed across the plane of the OE (Fig. 4B); and (4) the presence of Ki67/BrdU+ neuronally committed ND1+ GBCs, which are also patchy and sparse across the control OE (Fig. 4C). In control mice, the total number of Ki67+ cells is 0.0333 cells/μm (Ki67 counts gathered from ectoturbinate 2). These four features are used to characterize the extent of the degenerative changes in the DTA-on transgenic mice. In addition, the control OE is characterized by a monolayer of CK14+/P63+ HBCs that are attached to the basal lamina and rarely dividing (Fig. 4B,C). Again, in control OE, Sox2+ supporting cells, confirmed by CK18 staining (data not shown), form a continuous row along the apical surface of the epithelium (Fig. 4B).
Figure 4.
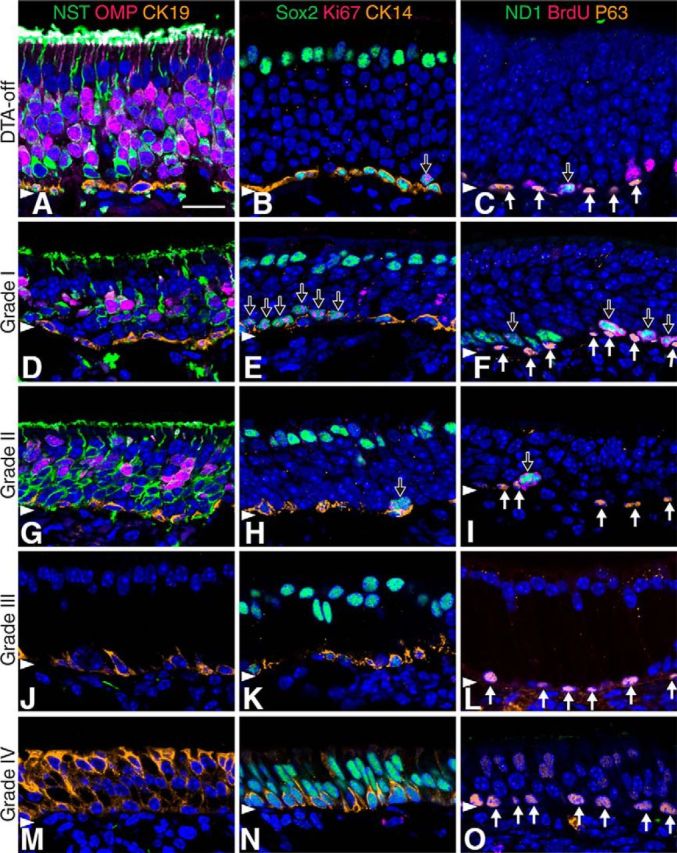
Epithelial grades of degeneration. The status of the OE in the Dox− OMP-tTA;TetO-DTA mice can be classified or graded on the basis of the abundance of mature and immature neurons, respiratory columnar cells, dividing GBCs, and upstream GBCs. Sections of the OE from a 6-month old Dox+ OMP-tTA;TetO-DTA control mouse (A–C) and a 6-month old Dox− OMP-tTA;TetO-DTA mouse (D–O) in which the OE is degenerating stained with multiple cell-specific markers demonstrate differences across Grades I–IV. As opposed to the normal-appearing OE in control mice (A), there is a progressive decrease in OMP+ (magenta)/NST+ (green) mature OSNs and OMP−/NST+ immature neurons in Grades I and II (D, G) with complete absence in Grades II and IV (J, M) and the presence of CK19+ (gold) RE columnar cells in Grade IV (M). As opposed to the occasional Sox2+ (green)/CK14− (gold)/Ki67+ (magenta) multipotent upstream GBCs (black arrow) in normal appearing control OE (B), Grade I displays an increase in upstream GBCs (black arrows in E). These proliferative, upstream Sox2+ GBCs decrease to normal levels in Grade II (H) and are essentially absent in Grade III and IV (K, N). Apically positioned Sox2+ Sus cells and basally positioned CK14+/Sox2+ HBCs are present throughout all grades and are rarely dividing. The presence of ND1+ (green)/BrdU+ (magenta) immediate neuronal precursor GBCs (black arrow) are also sporadic in normal appearing OE (C). These cells increase dramatically in Grade I (black arrows in F) and decrease again in Grade II (black arrows in I). As with dividing GBCs, the immediate neuronal precursors GBCs are absent in Grades III and IV OE (L, O). Nonactivated P63+ (gold) HBCs (white arrows in C–O) line the basal lamina (arrowheads) in all grades. Note the absence of cell bodies between the apical supporting cells and HBCs as indicated by the lack of nuclear staining (blue) in Grade III (J–L). Scale bar in A, 20 μm (also applies to B–O).
The classification of degeneration severity is as follows. Grade I degeneration (Fig. 4D–F) is considered the least severe and is distinguished by the following: (1) a reduction in the population of mature OSNs to a 2- to 3-cell-thick layer (Fig. 4D), (2) a slightly thicker than normal layer of immature OSNs directly basal to the mature neurons (Fig. 4D), (3) a more substantial population of proliferating Sox2+ GBCs that are disposed in large clusters than in control OE (Fig. 4E), and (4) a comparable increase in the number and clustering of proliferating ND1+ GBCs (Fig. 4F). The total number of Ki67+ cells in Grade I OE is 0.0633 cells/μm (∼2× the control value). The HBC monolayer appears to be unchanged (Fig. 4E,F) and the supporting cells appear undisturbed (Fig. 4E). Grade II degeneration (Fig. 4G–I) is more severe and defined by the following: (1) a further reduction in the population of mature OSNs relative to Grade I (Fig. 4G), (2) a comparable dwindling in the population of immature OSNs (Fig. 4G), (3) attenuation in the population of proliferative Sox2+ GBCs back to or even less that their number in the control OE (Fig. 4H), and (4) a substantial diminution in the proliferative ND1+ GBCs (Fig. 4I). The total number of Ki67+ cells in Grade II epithelium is 0.0175 cells/μm (∼½ of the control value). The layers of both HBCs and supporting cells remain largely unchanged from normal OE (Fig. 4H,I). Grade III degeneration (Fig. 4J–L) corresponds to an aneuronal OE and is defined by the following comparisons: the complete absence of (1) mature and (2) immature OSNs (Fig. 4J), (3) the absence of Sox2+ GBCs (Fig. 4K), and (4) the absence of proliferative ND1+ GBCs (Fig. 4L). Once again, the HBCs and Sus cells remain morphologically unchanged (Fig. 4K,L). The absence of neurons and GBCs can also be defined from the paucity of nuclei between the apically arrayed Sox2+ supporting cells and the basally located HBCs (Fig. 4J–L). Finally, Grade IV degeneration (Fig. 4M–O) corresponds to the shift of olfactory to metaplastic RE, which can be recognized by the absence of (1) mature and (2) immature OSNs (Fig. 4M) and the absence of proliferative (3) Sox2+ and (4) ND1+ GBCs (Fig. 4N,O, respectively). In contrast to the Grade III epithelium, which also lacks neurons and GBCs, Sus cells are replaced by CK19+ columnar respiratory epithelial cells (Fig. 4M). As is true of normal RE, the Sox2+ columnar respiratory epithelial cells have more elongated nuclei and a more simplified epithelial structure (Fig. 4N). All grades of degeneration exhibit a structural commonality; however, the monolayer of P63+ HBCs is maintained without morphological evidence of activation (Packard et al., 2011; Schnittke et al., 2015).
Quantification of degeneration across the OE
The four grades of degeneration defined above (Fig. 4) suggest a progressive degeneration of the OE with time in the DTA-on mice. To quantify the epithelial deterioration, we mapped the distribution of each of the four grades of degeneration along the entire circumference of coronal sections from an anterior and a posterior region of the OE at three different time points (2, 4, and 6 months of age; n = 3 at immunostained with the markers described above (Fig. 5). Degeneration was clearly more severe in the anterior regions than in the posterior regions, in that grades III and IV of the epithelium are more prevalent and become more extensive with advancing age. It is especially worth noting that particularly severe degeneration is seen in ectoturbinate 2 and the tissue areas categorized as grades III and IV were more frequently located near the borders between OE and RE.
Figure 5.
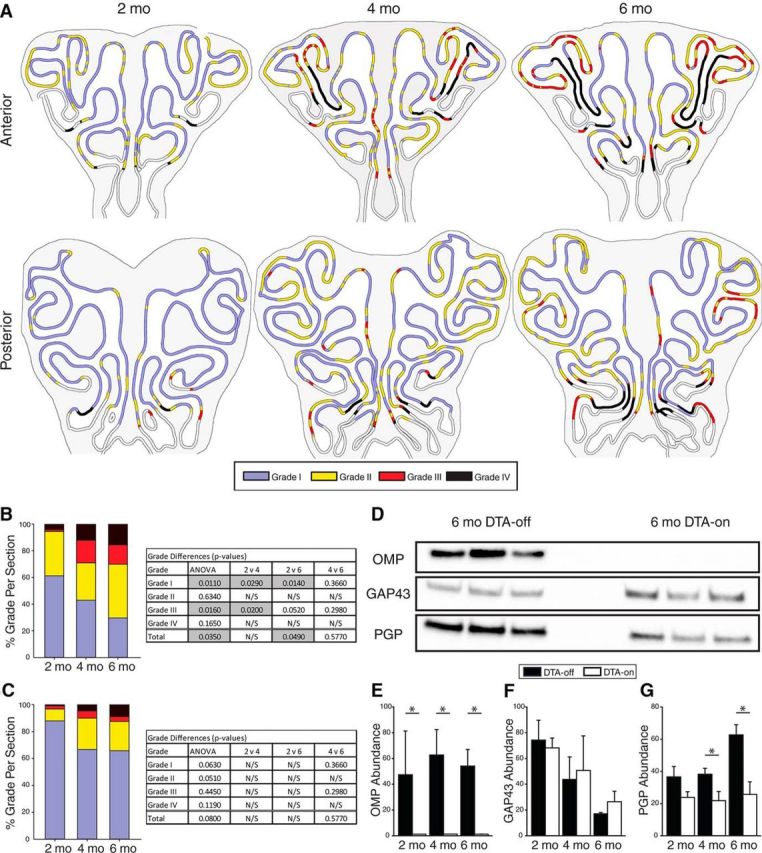
OE degeneration increases with time. A, Diagram renditions of coronal nasal sections through anterior and posterior OE areas after 2, 4, and 6 months of degeneration are labeled along the epithelium with colors indicating grades of degeneration: Grade I (blue), Grade II (yellow), Grade III (red), and Grade IV (black). Most severe degeneration can be seen in anterior sections in ectoturbinate 2 at 4 and 6 months. B, C, Averaged quantification of percentage total linear measurements of each grade at 2, 4, and 6 months for anterior (B) and posterior (C) sections demonstrate increases in more severe grades especially with anterior sections over time. Corresponding tables show p-values of t tests for comparisons after assigning numerical values of 1–4 for each grade for each measured length. Gray boxes represent significance of > 0.05. D, Western blots using antibodies against OMP, GAP43, and PGP9.5 were obtained from equal sized pieces of tissue removed from the septum of control and 6 month degeneration mice. E–G, Statistical analyses of the changes in the protein levels of OMP (E), GAP43 (F), and PGP9.5 (G). There is a significant decrease in OMP in degeneration mice compared with control at all ages and a decrease in PGP9.5 in degeneration mice compared with control at 4 and 6 months; however, GAP43 is not significantly changed. For E and F, *p < 0.05 (p-values are shown in the Results).
To quantify progressive degeneration like that in Figure 5A, the linear extent of each grade is summed over the section and reported as a percentage relative to the entire circumference of the OE averaged over three mice at anterior and posterior levels separately (Fig. 5B,C, respectively). The areas of severe degeneration (i.e., grades III and IV) expanded as mice aged while the extent of the less severely degenerating epithelium (i.e., grades I and II) decreased correspondingly. The degeneration overall is clearly more severe in the anterior sections than in the posterior sections. In the anterior OE, our statistical analysis shows that the progression of epithelial degeneration is statistically significant for comparisons between 2 months and either 4 or 6 months (see the table in Fig. 5B for individual p-values). However, there is no statistically significant difference between 4 and 6 months at any grade of degeneration in the anterior areas. In the posterior OE, degeneration is generally less severe at 2 months than in anterior OE. Moreover, the degenerative changes advance less drastically posteriorly as mice age, thereby lagging the extent of deterioration in the anterior OE (Fig. 5C). For purposes of summarizing the severity of degeneration across the entire section, we assigned a numerical value to each grade of degeneration (Grade I = 1, Grade II = 2, Grade III = 3, and Grade IV = 4), multiplied that by the percentage of the epithelial circumference that corresponds to each grade, and summed the values. A higher summary value indicates that the degeneration of the OE was more severe overall. In the anterior OE, the overall severity was significantly greater at 6 months relative to 2 months (p = 0.0490) (Fig. 5B). There was no statistically significant difference between 2 and 4 months (p = 0.0700) or 4 and 6 months (p = 0.577) (Fig. 5B). Perhaps surprisingly with regard to the posterior OE, the deterioration in the status of the epithelium did not advance significantly with time relative to the degree of degeneration already evident at 2 months (Fig. 5C).
The extent of degeneration was also assayed by comparing the abundance on Western blots of several protein markers that can serve as proxies for the size of the neuronal population: OMP for mature neurons, GAP43 for immature neurons, and PGP9.5 for both mature and immature neurons. Septal mucosa was sampled from the same region of the OE in both groups. Because total cell number varies between control mice (DTA-off) and mice undergoing degeneration and the ongoing cell death (DTA-on) and because the protein content of non-neuronal cells might change in response to the neuronal degeneration, the samples were normalized for area rather than a general cell marker. A real normalization was ensured by photographing and measuring the size of each piece of tissue in the two groups and then correcting sample concentration for size of the tissue (see Materials and Methods for more details). Figure 5D shows that total OMP protein in the samples collected from the degeneration mice at 6 months was drastically attenuated compared with the age-matched control mice such that it was barely detectable (n = 3 each). The amount of GAP43 protein does not differ between the control and degeneration mice, whereas the PGP9.5 level appears to be reduced (Fig. 5D). We then statistically compared the protein levels of all three neuronal markers at three time points (2, 4, and 6 months) in the control and degeneration mice (n = 3 each, Fig. 5E–G). The OMP level is significantly reduced (confirmed by unpaired t tests due to the severe diminution in the amount of the OMP in the degeneration groups) and so is the level of PGP9.5 (one-way ANOVA) across the time points; individual comparisons with control were significantly different at 4 and 6 months, but not at 2 months of degeneration (p = 0.044, p < 0.0001, and p = 0.123 respectively). The GAP43 level appears to be comparable between two groups at all time points (one-way ANOVA). Therefore, our Western analysis confirms an overall decrease in the neuronal population over time as a result of the decimation of mature OSNs.
GBC populations change as degeneration continues whereas HBCs persist in dormancy
The ongoing turnover of mature olfactory neurons in the DTA-on mice clearly affects the GBC population given the progression to the disappearance of all GBCs and the emergence of an aneuronal OE. The heterogeneous nature of the GBC population (Schwob et al., 2017) requires a determination of whether accelerated turnover shifts the balance among the GBC subpopulations as neurogenic capacity exhausts. Accordingly, we counted the number of Sox2+, ostensibly upstream GBCs and ND1+, ostensibly immediate neuronal precursor GBCs in epithelium for each of the four grades of degeneration at the three time points in both anterior and posterior regions (Fig. 6A–H). We specifically chose to examine ectoturbinate 2 because this region was most heavily and consistently affected by degeneration (Fig. 5). The number of Sox2+ GBCs present are significantly increased in Grade I areas of the OE both anteriorly and posteriorly compared with control and the number of ND1+ GBCs are trending toward an increase in both regions, but the difference is not significant (Fig. 6A–D). Both populations are smaller in Grade II areas compared with that peak. Near complete absence of GBCs in Grade III degeneration is observed at both levels across all time points.
Figure 6.
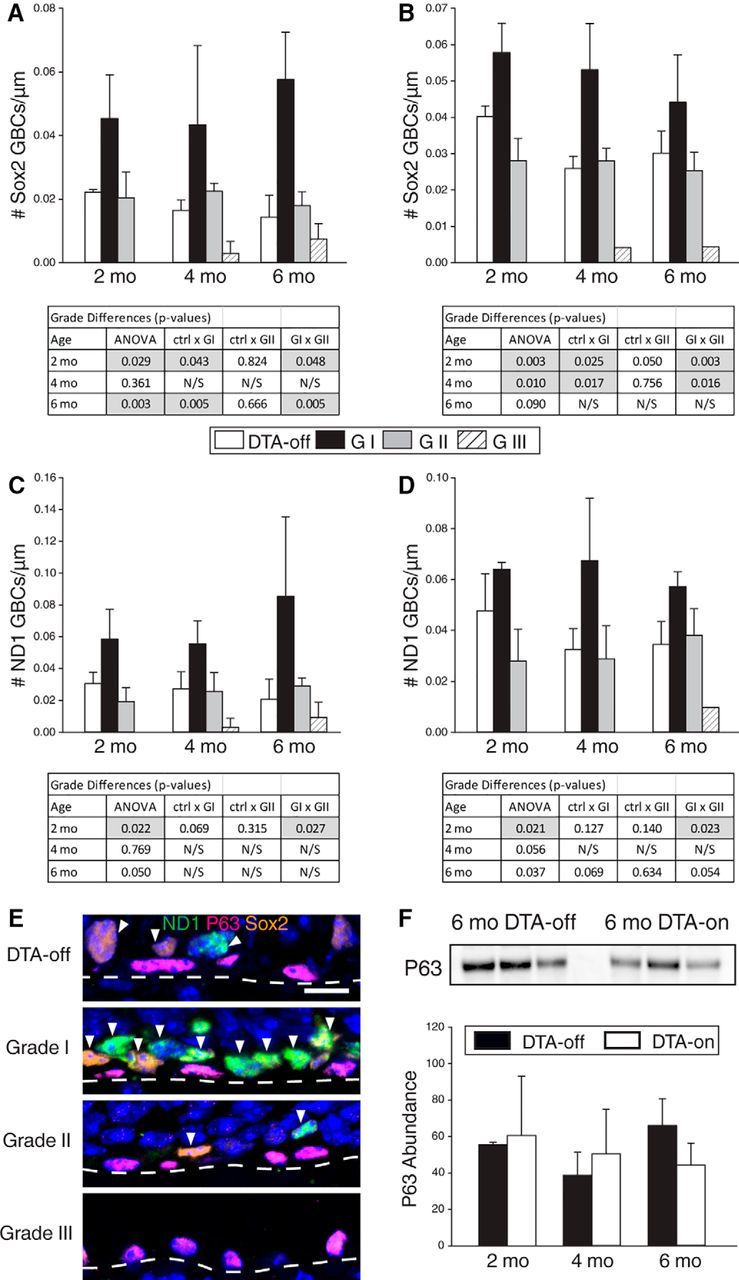
Numbers of GBCs across OE of degeneration mice vary with grade of degeneration, whereas HBCs remain stable. Cell counts of Sox2+ upstream GBCs per length of OE of ectoturbinate 2 in the anterior (A) and the posterior (B) regions were averaged for control mice and regions of Grade I–III of degeneration mice at 2, 4, and 6 months with representation in bar graphs. Overall, there is an increase in Sox2+ GBCs with Grade I degeneration compared with control and other grades. Similarly, ND1+ immediate neuronal precursor GBCs were counted in the anterior (C) and the posterior (D) Although the differences in the population of ND1+ cells do not reach statistical significance across various grades, the number of ND1+ GBCs appear to increase in Grade I OE. Tables in A–D provide p-values of ANOVA and t tests (gray boxes = p < 0.05). E, Immunohistochemical staining of the basal cell compartment (GBCs and HBCs) showing the differences between control tissue and each grade of degeneration (Grades I–III). ND1+ (green) and Sox2+ (gold) GBCs (arrowheads) are positioned above the P63+ (magenta) HBCs lining the basal lamina (dashed line) in a single row. F, Western blots of P63 protein levels in the septal OE from 6-month-old control and degeneration mice are not significantly different. Scale bar in E is 10 μm and applies to all images.
As opposed to GBCs, the HBCs, which are marked by both P63 and CK14, do not apparently shift in their frequency regardless of the severity of the degeneration (Figs. 4, 6E). We measured the level of P63 protein per unit area of epithelium in the same manner and on the same samples used for assessing the neuronal population (Fig. 5) because a decline in P63 is a necessary and sufficient predicate for the activation of the HBC population (Fletcher et al., 2011; Schnittke et al., 2015). When analyzed on Western blot, P63 protein levels did not change to a significant degree in the DTA-on mice (Fig. 6F), suggesting that the HBCs remained dormant despite this type of neuronal degeneration. Likewise, HBCs do not activate as a consequence of ablation of the olfactory bulb, which also abbreviates the lifespan of neurons born after the surgery and causes accelerated neuronal turnover (Leung et al., 2007; Herrick et al., 2017). HBC morphology is consistently more spherical in Grade III epithelium than the typical flattened shape observed in the control epithelium or at the milder degenerative grades (Fig. 6I). Although HBCs in either young or aged animals display morphological changes in response to injury (Holbrook et al., 1995; Brann et al., 2015), we found no signs of proliferation or activation in HBCs within aneuronal epithelium.
Infiltration of inflammatory cells during DTA-induced degeneration
To determine whether accelerated neuronal turnover was accompanied by an increased immune response, especially recruitment of inflammatory cells, various immune cell types (macrophages, T cells, B cells, and granulocytes) were assayed for their presence in the mucosa in our DTA-on mice (Fig. 7). Neurons are continuously being generated and undergoing enhanced turnover at this time shown by an increase of cleaved Caspase III+ apoptotic cells (Fig. 7B), which is accompanied by an increase in recruitment of Iba1+ activated macrophages (Fig. 7F) compared with the control (Fig. 7A,E, respectively). In contrast, cleaved Caspase III+ dying cells and Iba1+ macrophages are largely absent from parts of the epithelium that have undergone neuronal exhaustion, for example, at 4 months of degeneration (Fig. 7C,G). The total number of cleaved Caspase III+ cells undergoing apoptosis was counted across the epithelial region of ectoturbinate 2 inclusive of all grades of epithelial degeneration. The number of cleaved Caspase III+ is significantly increased in our degeneration mice compared with control at 2 months of age (p = 0.017); however, this increase is not seen at 4 months potentially due to the increase in aneuronal OE. We assessed the number of Iba1+-activated macrophages (Fig. 7H) that were found in the epithelium, CD3+ T cells (Fig. 7I), CD19+ B cells (Fig. 7J), and Ly6G+ granulocytes (Fig. 7K), in ectoturbinate 2; these elements are predominantly found in the basal lamina underneath the OE. There was a significant increase in the number of immune cells in our degeneration mice compared with control using a three-way ANOVA comparing immune cell type, duration of degeneration, and DTA status. DTA status and immune cell type demonstrated statistical significance as single variables; duration did not and nor did any of the interactions across the variables (Fig. 7D,I–L). Overall, our results suggest that the peak of the immune response coincides with neuronal death and precedes neuronal exhaustion.
Figure 7.
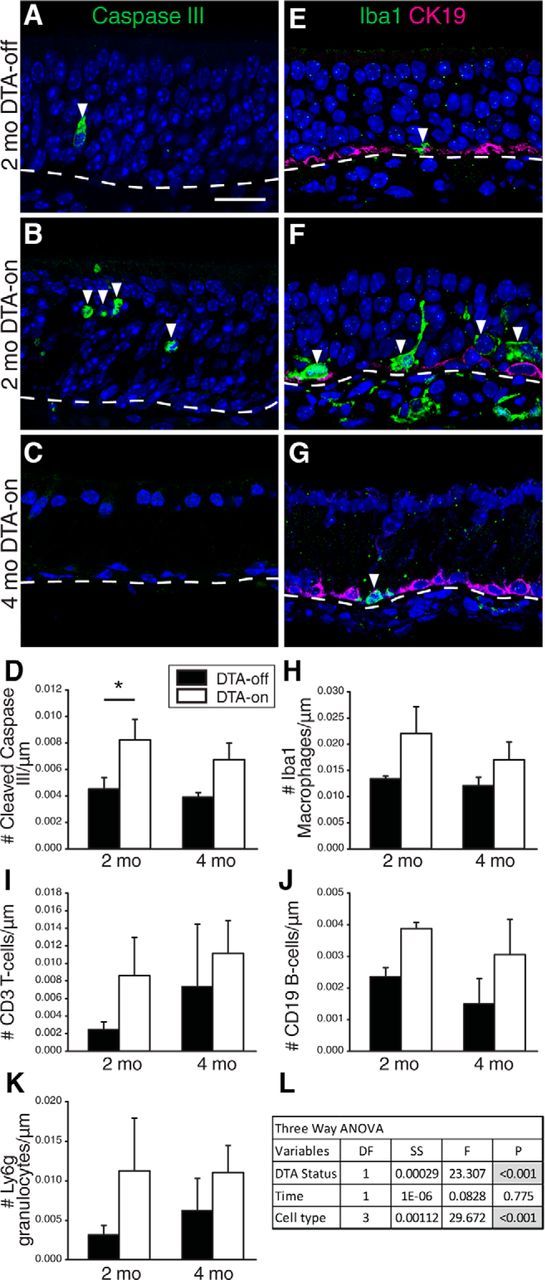
Macrophage recruitment and cell death is increased overall in Dox− OMP-tTA;TetO-DTA mice in which the OE is degenerating. A–C, Sections labeled for cleaved Caspase III+ (green) to mark dying cells demonstrate an increase in neuronal cell death in a 2 months DTA-on mouse (B) compared with control (A) cell counts were performed in ectoturbinate 2 including all grades (D). However, cleaved Caspase III+ cells are absent in aneuronal epithelium, as shown in the OE at 4 months of DTA-on (C). E–G, Macrophages are labeled with an antibody against Iba1 (green) in sections of OE from a control mouse at 2 months (E), degeneration mice at 2 months (F) and 4 months (G). CK19+ (magenta) cells are identified as HBCs (E–G). Macrophages appear clustered more densely in degeneration regions (F), but are infrequent in aneuronal epithelium as shown in the OE of a 4-month DTA-on mouse (G). The numbers of Iba1+ macrophages (H), CD3+ T-cells (I), CD19+ B-cells (J), and Ly6 g+ granulocytes (K) are increased in DTA-on mice compared with control without constraining for DTA status or age. A 4 × 2 × 2 ANOVA (cell type × DTA status × duration) was performed to assess the immune response to the lesion as a whole (L). Dashed line indicates the basal lamina. Arrowheads in A and B identify cleaved Caspase III+ dying neurons. Arrowheads identify individual macrophages in A–C). *p < 0.05. Scale bar in A, 20 μm (also applies to B, C, E–G).
Recovery after inhibition of DTA expression is limited to epithelium that is at an early grade of degeneration
We examined the capacity of the epithelium to recover from the degenerative changes caused by accelerated neuronal turnover in the DTA mice. DTA mice were maintained without doxycycline (DTA-on) for either 2 or 4 months from birth, at which time doxycycline was added to the diet (DTA-off) for the following 2 months. Much like the analysis of the progression of degeneration, recovery was mapped across coronal sections from anterior regions (Fig. 8A). The quantitative analysis of the status of the epithelium after the recovery period entailed comparison to the degree of degeneration in mice harvested at the onset of that period.
Figure 8.

Recovery of epithelium is substantial but incomplete. A, Diagram renditions of coronal nasal sections through anterior OE areas at 4 months of degeneration in a DTA-on mouse (image taken from Fig. 5A) and 4 months of degeneration (DTA-on) plus 2 months of recovery (DTA-off) are classified as to extent of the degeneration and recovery across the epithelium with colors indicating grades of degeneration: Grade 0 (equivalent to control, green), Grade I (blue), Grade II (yellow), Grade III (red), and Grade IV (black). Based on the extent of the damaged epithelium before and after recovery, the less severe Grades, for example, Grades I and II, appear to recover to normal (Grade 0), whereas OE that is aneuronal or metaplastic does not recover. B, Averaged extent of normal appearing OE (Grade 0) and each Grade of degeneration expressed as a percentage of the total length of OE for 2 months DTA-on, 2 months DTA-on plus 2 months DTA-off, 4 months DTA-on, and 4 months DTA-on plus 2 months DTA-off (n = 3 per conditions). The extent of normal (Grade 0) OE is markedly increased after the DTA-off recovery period in the 2 + 2 mice, whereas the extents of Grade I and II OE are significantly decreased after 2 months recovery (blue and yellow asterisks indicate that the decline in both Grade I and Grade II is significant at p < 0.05); however, severe degeneration (Grades III and IV and absent of GBCs) does not change. Similarly after 4 months of DTA-on degeneration, 2 months of DTA-off recovery increases normal appearing OE (Grade 0) and decreases Grade I degeneration (blue asterisks indicates p < 0.05), but regions of severe degeneration remain unchanged. C–F, Immunohistochemistry of sections from a 4-month DTA-on mouse (C, E) and a 4 month DTA-on + 2 months DTA-off recovery mouse (D, F) demonstrates a robust increase of OMP+ (green) mature OSNs and NST+ (magenta) immature neurons after recovery in neurogenic OE (D), whereas βIV-Tubulin− (gold) aneuronal regions (E, F) remain devoid of neurons. Arrowheads indicate basal lamina. Scale bar in C, is 20 μm (also applies to D–F).
For the animals that experienced 2 months of degeneration followed by 2 months of recovery, much of the tissue has apparently reverted to normal appearing; that is, the layer of OMP+ neurons is many cells thick (Fig. 8D). The extent of the epithelium that is classified as Grade I or Grade II is much reduced (although not eliminated), whereas the area that is classified as normal appearing (grade 0) is much expanded by the end of the recovery period (Fig. 8A). Linear measurements of epithelial status confirmed this; the decrease in the extent of both Grade I and II was statistically significant (Grade I, p = 0.0002; Grade II, p = 0.0004). In contrast the extents of grades III and IV were not significantly different in this comparison of the degeneration and degeneration-plus-recovery group (Grade III, p = 0.447; Grade IV, p = 0.381; Fig. 8B).
For the animals in the 4-month degeneration/2-month recovery group, normal epithelium reemerges, although to a lesser but still significant extent compared with the group with the shorter period of degeneration (Fig. 8B–D). In this latter group, more of the epithelium is aneuronal (Grade III) or metaplastic and no longer olfactory (Grade IV) at the time when DTA is turned off. As suggested in the group with the shorter degeneration, severely affected areas (Grades III and IV) did not appear to recover because much of the epithelium remained aneuronal OE or metaplastic RE (Fig. 8B,E,F). Indeed, there was again no difference between the degeneration mice and the degeneration-recovery mice with respect to these more severe grades (Grade III, p = 0.0776; Grade IV, p = 0.332; Fig. 8B). The common finding of GBCs in OE classified as Grades I and II and their absence in Grades III and IV suggests that these cells are required for recovery in our degeneration model, as in the setting of recovery after olfactotoxic injury (Jang et al., 2003).
Degeneration of OE is accompanied by degeneration of the olfactory bulbs
Given the effects of naris occlusion and forms of OE lesioning on the olfactory bulb, we also assessed the impact on the bulb of prolonged accelerated neuronal turnover and a reduced population of mature OSNs. Compared with the age-matched 6-month control, the overall size of the OB from 6-month degeneration mice was noticeably smaller (Fig. 9A,B). Immunostaining with both OMP and VGlut2 to mark incoming presynaptic axons of the OSNs demonstrates that individual glomeruli are markedly smaller after 6 months of degeneration compared with control (Fig. 9C,D). Sparse staining with OMP and VGlut2 indicates that the glomeruli are hypo-innervated in the setting of ongoing degeneration. Total glomerular area was measured at both anterior and posterior levels using OMP and VGlut2 staining and found to be significantly reduced at all 3 time points (2, 4, and 6 months of degeneration) at both the anterior and posterior levels of the bulb compared with age-matched controls (Fig. 9I,J). It is worth noting that the total glomerular area does not show a further significant reduction beyond 2 months of degeneration.
Figure 9.
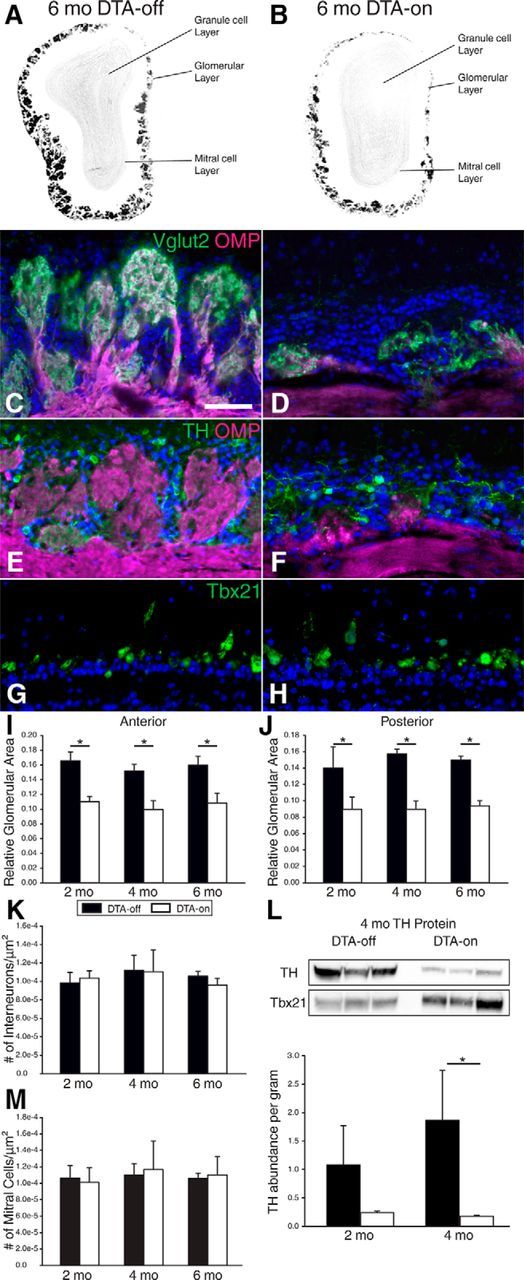
Degeneration of the OE due to accelerated turnover alters the OB. A, B, Diagrams of coronal sections through the OB labeled with Vglut2 antibody reveal smaller glomeruli in the 6 months DTA-on mouse (B) compared with age-matched DTA-off control (A). C, D, In the DTA-off mice, individual glomeruli, labeled with OMP (magenta) and Vglut2 (green), are plump and normal in appearance as shown in this section from the medial surface of the OB (C), but glomeruli are markedly shrunken after 6 months of degeneration in the DTA-on mice (D). E, F, Likewise, periglomerular dopaminergic interneurons labeled with an antibody against TH (green) are prominent and surround OMP+ (magenta) glomeruli in the DTA-off control mice (E); in the DTA-on mice at 6 months of degeneration, TH+ are evident despite the substantial shrinkage of the glomeruli (F). G, H, Labeling of Tbx21+ (green) mitral cells appears unchanged comparing the OB of DTA-off control mice (G) versus the OB DTA-on mice at 4 months of degeneration (H). Total glomerular area was calculated from Vglut2 stained DTA-off coronal sections from anterior (I) and posterior (J) regions of the OB and from equivalent levels of the bulb from DTA-on mice after 2, 4, and 6 months of degeneration. There was a significant decrease in glomerular area compared with control (*p < 0.05) at all durations of degeneration points, but glomerular area is not further reduced by lengthening the period of degeneration to 4 and 6 months. K, Cell counts of TH+ interneurons from similar sections demonstrated no difference between control and degeneration mice. L, However, when TH protein levels were assessed using Western blots of OBs obtained from 2 and 4 month degeneration mice and normalized to Tbx21 protein concentration, there was a statistically significant decrease compared with age-matched controls (*p < 0.05). M, As with TH+ interneurons, counts of Tbx21+ mitral cells from OB sections did not change when comparing control and 2, 4, and 6 month degeneration mice. Scale bar in C, 50 μm (also applies to D–H).
In addition, the populations of dopaminergic periglomerular cells and mitral cells were evaluated with antibodies against TH (Fig. 9E,F) and anti-Tbx21 (Fig. 9G,H), respectively. Numbers of mitral cells and dopaminergic periglomerular cells are not significantly different between control and DTA-on mice at any of the three time points of degeneration analyzed (Fig. 9K,M). However, the level of TH expression is diminished as a consequence of the degeneration, as shown by anti-TH Western blot analyses of whole OB normalized against the expression of Tbx21 (Fig. 9L). There is a significant decrease in TH protein abundance in the olfactory bulb at 4 months of degeneration (p = 0.035) that is not seen by 2 months. This finding is consistent with the decline in TH after other manipulations of the olfactory periphery (Baker, 1993). Although the numbers of TH+ periglomerular interneurons may not have been affected, the level of TH protein expression may be decreased as a consequence of diminished peripheral input, as was demonstrated previously after naris occlusion.
Recovery of the OB after OE degeneration is incomplete
Given the substantial recovery of the OE in mice that are switched from DTA-on to DTA-off status by the addition of doxycycline to the diet, we assessed the condition of the OB in animals after 2 months of recovery. When mice were introduced to doxy for 2 months (DTA-off) after either 2 or 4 months of degeneration (DTA-on), both the size of the OB and Vglut2+/OMP+ glomeruli recovered substantially compared with age-matched control mice (4 and 6 months old, respectively) (Fig. 10A,C). Our measurements of total glomerular area (as marked by Vglut2+/OMP+ staining) at anterior and posterior levels demonstrate that glomerular innervation in the 2 months degeneration/2 months recovery group had improved to such a degree that they were statistically no different from controls (Fig. 10E). Likewise, in the 4 months degeneration/2 months recovery mice, glomerular area recovered fully compared with control (Fig. 10F). However, individual glomeruli appear to be more fragmented after recovery; that is, glomerular innervation after recovery appears as multiple discrete small foci of labeling rather than a conjoined mass (Fig. 10A,G,I vs C,H,J). To use an everyday analogy, the distribution of OSN axons after recovery looks less like many individual heads of cauliflower and more like many bunches of grapes.
Figure 10.
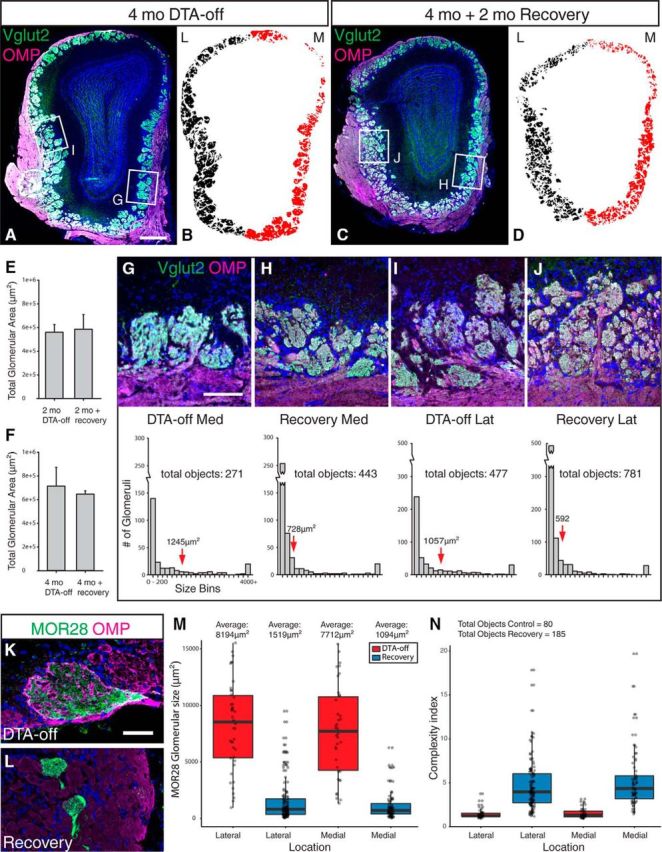
The OB does not recover to normal after OE degeneration. A–D, Sections of OB from 4 month DTA-off (A, B) and 4 months of degeneration with 2 months of recovery (DTA-on to DTA-off) (C, D) mice labeled with OMP (magenta) to stain the axons of mature OSNs and with Vglut2+ (green) to mark axon terminals within glomeruli (A, C). Boxes in A and C indicate the locations of the higher-magnification images shown in G–J. Mosaics of OB sections stained for Vglut2 were acquired and then stained pixels were highlighted in ImageJ and rendered into schematics (B, D). The images were then split into medial (M, red) and lateral (L, black) compartments (B, D). E, F, Measures of total glomerular area were not statistically different when comparing 2 months DTA-off (control) versus 2 months DTA-on followed by 2 months DTA-off recovery (E) or 4 months control versus 4 months degeneration with 2 months recovery (F). G–J, Higher magnification of glomeruli labeled with antibodies against OMP (magenta) and Vglut2 (green); for purposes of the statistical comparison, a glomerulus is defined as an object composed of contiguous stained pixels that exceed background. The glomeruli in the degeneration–recovery mice are markedly smaller than in the DTA-off control bulb, but they are also more numerous (histograms below G–J). Mean glomerular size in square micrometers (red arrows) is much smaller in recovered mice than in control mice (graphs in G–J). K, L, The set of olfactory neurons that were labeled with antibodies against the MOR28 olfactory receptor (green) was mapped in control (K) and recovered (L) mice. OMP labeling (magenta) was used to mark all OSN axons in the glomerulus. K, L, Photographs documenting MOR28 staining on the medial side of the OB. In the control mice, each MOR28+ glomerulus was completely filled by that individual receptor type, whereas glomeruli in recovered mice are small in size and appeared to be more than one glomerulus on this side. M, N, Measurements of the size (M) and the complexity (N) of the glomeruli that are innervated by MOR28 neurons in both the lateral and medial OB from control and recovery mice. In the recovery mice, the size of the individual glomerular objects are smaller (M), but the complexity index (the complexity of the shape of objects relative to the complexity of perfect circle calculated as described in the Results) is higher (N) after recovery from degeneration compared with control, DTA-off mice on both sides of the OB. Scale bars: A, 300 μm (also applies to C); G, 100 μm (also applies to H–J), and K, 50 μm (also applies to L).
To quantify the degree of glomerular fragmentation, images of VGlut2-stained sections from mice in the 2 months degeneration/2 months recovery group (n = 3) and from control mice (n = 3) were segmented by fluorescent intensity to highlight staining above background (Fig. 10B,D). Segmented objects composed of contiguous pixels above background were sized in ImageJ (Fig. 10G–J). Total glomerular area was no different from control to recovery. However, the total number of segmented objects at the sampled levels of the OB differed between the conditions. In control OB, the count was 271 in the medial region compared with the 443 objects counted in the OB of mice that had recovered (at least in part) from the DTA-induced degeneration. Similarly, the count of glomeruli in the lateral region of the control OB was 477 objects compared with 781 objects in the recovery OB. The average size of the stained objects was substantially smaller in the degeneration recovery mice compared with age-matched control: average object size on the medial side of degeneration–recovery mice = 728 μm2; lateral side = 592 μm2; medial side of control = 1245 μm2; lateral side = 1057 μm2. The fragmentation of olfactory sensory innervation is somewhat more pronounced in the lateral half of the bulb, which is innervated by the part of the epithelium that is more severely affected by DTA expression. It is particularly noteworthy that the occurrence of very many small foci of olfactory axons in the glomerular layer is reminiscent of the appearance of the human olfactory bulb in autopsy and surgical specimens (Smith et al., 1993; Maresh et al., 2008).
We also assessed the pattern of innervation of the subset of OSNs labeled by an antibody generated against MOR28 (Barnea et al., 2004). Compared with the normal MOR28 glomeruli (one on the medial and one on the lateral side) from the control mice (the lateral glomerulus is shown in Fig. 10K), it appears that the regenerating MOR28 neurons project to mulitple glomeruli (Fig. 10L) that are smaller in size; the MOR28 fibers target the general vicinity of the normal loci. In similar fashion, M72 neurons project to multiple glomeruli after a cycle of degeneration–regeneration in neonatal OMP-tTA;TetO-DTA mice (Ma et al., 2014). Each of the glomeruli targeted by the MOR28 fibers is demarcated by a collection of periglomerular cells despite their smaller size and multiplicity. The MOR28 fibers fill the glomeruli, which differentiates the innervation from that observed with P2 fibers after recovery from methyl bromide lesion, in which setting the P2 fibers are plastered at the margins and do not fill the multiple glomeruli that receive P2 innervation after regeneration (Holbrook et al., 2014). The overall size and complexity in shape of each glomerulus after recovery are significantly different from control (n = 3 each; Fig. 10M,N). The average size of the MOR28 glomeruli after recovery is 1519 and 1094 μm2 on the lateral and medial side, respectively, compared with 8194 and 7712 μm2 in control mice on the lateral and medial side, respectively. A two-way ANOVA comparing status (control vs recovery) and location (lateral vs medial) as variables shows that the size of the MOR28 glomeruli are significantly reduced in the recovery group compared with control (p < 0.001); there is no difference in their size when comparing the lateral and medial side (Fig. 10M). A complexity index was calculated for the individual MOR28 glomerular “objects” on both lateral and medial side of the OB in the control versus recovery group, which compared the perimeter of the object to the perimeter of a perfect circle, (object perimeter)/√(area*4π), such that the higher the value, the more complex the shape of the object. The average complexity index of the MOR28 glomeruli after recovery is 4.70 and 5.26 (lateral and medial side, respectively) compared with 1.44 and 1.52 (lateral and medial side, respectively) in control. A two-way ANOVA analysis shows that the complexity index is significantly higher in recovery mice than in the control (p < 0.001) in both the lateral and medial side (Fig. 10N), indicating more fragmentation of the MOR28 glomeruli in the recovery mice.
Discussion
The work presented here generates, characterizes, and exploits a mouse model for the aging process of the OE and its axonal projection onto the olfactory bulb that parallels the degeneration of the olfactory system of elderly humans (Bhatnagar et al., 1987; Paik et al., 1992; Holbrook et al., 2011) and mice (Kondo et al., 2009) but at an accelerated rate. Mice that are heterozygous for two transgenes, OMP-tTA and TetO-DTA, experience an enhanced turnover of OSNs, which can be reversed by the addition of doxycycline to the diet. Similarly, the aberrant expression of an oncogene in mature OSNs also produces these types of changes in relatively short order (Largent et al., 1993). The degenerative changes in the OE include the progressive disappearance of GBCs and OSNs, which we term neurogenic exhaustion, and the metaplastic transformation of OE to RE. The accelerated turnover of neurons in the epithelium had the further consequence of reducing the sensory innervation of the glomeruli in the olfactory bulb, leading to a decline in TH expression without any evidence of a loss of dopaminergic interneurons or mitral and tufted cells.
Prevention of DTA-mediated neuronal death by dietary doxycycline results in substantial recovery of the epithelium that is apparently limited to areas that had not yet undergone neurogenic exhaustion or respiratory metaplasia. The regeneration of the neuronal population in the periphery expands the glomerular innervation overall to a level that is indistinguishable from control; that the areal extent of the neuronal periphery is reduced suggests that there may be a compensatory expansion in the neuronal population in the recovered areas. However, glomerular structure appears degraded; olfactory axons coalesce into smaller and more numerous discrete units than in unaffected control, much like the appearance of the olfactory bulb in adult humans (Meisami et al., 1998). Targeting of a single olfactory neuronal type, MOR28-expressing OSNs, becomes abnormal as they project to more than one glomerulus per hemi-bulb, similar to the previously published finding that the M72 neurons reinnervate multiple glomeruli after a degeneration–regeneration cycle that occurs after a critical neonatal time point (Ma et al., 2014).
Several technical aspects of the model need additional consideration. We were surprised to find a substantial number of OMP+ OSNs in the doxy-free OMP-tTA;TetO-DTA mice. Expression of a single molecule of DTA is reportedly sufficient to trigger cell death (Lee et al., 1998) and OMP is a strongly expressed gene (Margolis, 1982). It is possible that the OMP construct and/or the DTA transgene is subject to epigenetic suppression in the OE. The expression of reporter molecules knocked-into an OMP locus and substituting for the coding sequence is variable but always detectable (Potter et al., 2001). However, DTA is a randomly inserted transgene and the map of the transgene is unavailable (Lee et al., 1998). Moreover, attempts to establish the genomic location of the transgene by inverse PCR were not successful because the amplicons did not reach the genome surrounding the insertion. Therefore, the modification to the genome is more complex than a single-copy insertion of a simple promoter–product transgene, which may render it more susceptible to genomic surveillance and suppression. Unfortunately, no DTA antibody is sufficiently sensitive to ascertain the presence or absence of the transgene-derived protein in the remaining OMP+ neurons.
The inefficient killing of OMP+ OSNs may also be responsible for the variable severity of epithelial degeneration along the medial-to-lateral and posterior-to-anterior axes (from less to more affected along both axes). The more severely affected regions are areas where the epithelium is thinner to begin with. Thinner epithelium shows a relatively higher rate of proliferation relative to the neuronal population compared with the septum and dorsal areas of the epithelium (Weiler and Farbman, 1997). Nonetheless, particular epithelial regions were consistently and equivalently damaged across the group of experimental animals. Therefore, assessing the extent of degeneration of those areas as a function of the duration allows us to illuminate the sequence of changes in the stem and progenitor cell populations.
Both the Sox2+ and NeuroD1+ GBC populations undergo an initial expansion, followed by a decline and then disappearance of all GBCs and neurons as the pathology advances. Perhaps surprisingly, there was no evidence for a selective loss of Sox2+ GBCs compared with NeuroD1+ GBCs at early stages in the process; that is, when comparing control and Grade 1 epithelium or Grade 1 and Grade 2 epithelium, NeuroD1+ GBCs remain in approximately the same proportion to Sox2+ GBCs in both groups. However, our analysis could not differentiate Sox2+/Ascl1− GBCs from Sox2+/Ascl1+ GBCs because the available anti-Ascl1 antibodies were not technically adequate to the task. The former type of GBC is upstream of the latter such that the Ascl1+ GBCs function as transit-amplifying GBCs as opposed to stem cell-like GBCs (for review, see Schwob et al., 2017). In other settings, neural stem cells are known to exhaust quickly due to accelerated neuronal production, for example, when Notch signaling is perturbed in neural stem cells of the CNS (Chapouton et al., 2010). In this case, the progenitor population shifts away from stem cell expansion and toward neurogenesis sooner, which probably accounts for the earlier disappearance of all progenitors and a consequent reduction in the total number of neurons (Kawaguchi et al., 2013). In the case of the OE, recent work has suggested that the functional capacity of the Sox2+/Ascl1+ transit-amplifying GBCs and the NeuroD1+ neuron-producing GBCs is substantially more plastic than previously thought (Lin et al., 2017) when isolated from an epithelium that is undergoing accelerated neurogenesis as a consequence of the acute degeneration of OSNs after ablation of the olfactory bulb. The parallels between the postbulbectomy epithelium and the current model of accelerated neuronal turnover are apparent. Despite any enhanced plasticity, the GBC population does collapse for reasons that are currently obscure but certainly worthy of further investigation. Among the signaling mechanisms that seem to regulate GBC behavior and the disruption of which might contribute to GBC eradication are Wnt and c-Kit (Wang et al., 2011; Goldstein et al., 2015). Alternatively, the increased inflammatory infiltrate in the degenerating mucosa may contribute. For example, a chronic inflammatory response is responsible for damaging stem cell niches in such tissues as skeletal muscle during aging (Carlson and Conboy, 2007; Gopinath and Rando, 2008).
Despite the accelerated turnover of neurons and the rapid depletion of GBCs, we saw no evidence of activation of HBCs. The HBCs remained flattened against the basal lamina and P63 expression was both indistinguishable from control and the same across epithelium that varied in severity of the degeneration (from Grade 1 to Grade 3) across the same tissue section. We did not directly assess activation of HBCs in the OMP-DTA model for aging using a genetic lineage tracing approach to define HBC progeny. However, we did study mice that were 18–26 months of age, in which heritable expression of TdTomato was induced in HBCs at 4–6 weeks of age. The epithelium of these animals included areas of neurogenic exhaustion and respiratory metaplasia, as well as areas that were normal in appearance. The relatively rare occurrence of HBC-derived neurons and sustentacular cells in these aged mice comports with the limited activation of HBCs in the absence of direct epithelial damage (Leung et al., 2007; Packard et al., 2011; Herrick et al., 2017). However, it was striking to find areas where TdTomato-expressing HBCs gave rise to all or most of the ciliated columnar cells in metaplastic RE. It has been shown that RE arises from olfactory HBCs after direct, severe epithelial injury by the olfactotoxin dichlobenil (Genter et al., 1996; Xie et al., 2013). However, it is extremely unlikely that the epithelium in these normal animals sustained an injury comparable to the magnitude caused by the olfactotoxin. The current results suggest that some change in the signaling milieu or cellular composition of the aging epithelium, perhaps as a consequence of inflammation, is responsible for the shift in outcome toward respiratory metaplasia after the rare occurrence of HBC activation. That hypothesis is consistent with the observation that postinjury metaplasia can be obviated under certain circumstances (Franceschini et al., 2014).
In sum, the enhanced turnover of olfactory neurons provides a model for the accelerated emergence of the degenerative changes in the OE that accompany aging. The expansion and then collapse of the GBC population suggest that the failure of the progenitor population is responsible for the advancing pathology. Two additional findings, respiratory metaplasia after disappearance of the GBC population and emergence of the ciliated columnar epithelial cells in metaplastic epithelium from HBCs in the absence of severe injury, emphasize the power of this aging model. Future investigations will focus on the nature of the signals leading to the collapse of the GBC population, the shift in HBC fate away from neurogenesis toward metaplasia, and the potential for activation of HBCs to restore neurogenesis.
Footnotes
This work was supported by the National Institute on Deafness and Other Communication Disorders–National Institutes of Health (Grant R01 DC014217 to J.E.S.). We thank Dr. Brian Lin for advice with the statistical analysis and Po Kwok-Tse for technical assistance.
The authors declare no competing financial interests.
References
- Baker H, Morel K, Stone DM, Maruniak JA (1993) Adult naris closure profoundly reduces tyrosine hydroxylase expression in mouse olfactory bulb. Brain Res 614:109–116. 10.1016/0006-8993(93)91023-l [DOI] [PubMed] [Google Scholar]
- Barnea G, O'Donnell S, Mancia F, Sun X, Nemes A, Mendelsohn M, Axel R (2004) Odorant receptors on axon termini in the brain. Science 304:1468. 10.1126/science.1096146 [DOI] [PubMed] [Google Scholar]
- Bhatnagar KP, Kennedy RC, Baron G, Greenberg RA (1987) Number of mitral cells and the bulb volume in the aging human olfactory bulb: a quantitative morphological study. Anat Rec 218:73–87. 10.1002/ar.1092180112 [DOI] [PubMed] [Google Scholar]
- Brann JH, Ellis DP, Ku BS, Spinazzi EF, Firestein S (2015) Injury in aged animals robustly activates quiescent olfactory neural stem cells. Front Neurosci 9:367. 10.3389/fnins.2015.00367 [DOI] [PMC free article] [PubMed] [Google Scholar]
- Carlson ME, Conboy IM (2007) Loss of stem cell regenerative capacity within aged niches. Aging Cell 6:371–382. 10.1111/j.1474-9726.2007.00286.x [DOI] [PMC free article] [PubMed] [Google Scholar]
- Chapouton P, Skupien P, Hesl B, Coolen M, Moore JC, Madelaine R, Kremmer E, Faus-Kessler T, Blader P, Lawson ND, Bally-Cuif L (2010) Notch activity levels control the balance between quiescence and recruitment of adult neural stem cells. J Neurosci 30:7961–7974. 10.1523/JNEUROSCI.6170-09.2010 [DOI] [PMC free article] [PubMed] [Google Scholar]
- Chen X, Fang H, Schwob JE (2004) Multipotency of purified, transplanted globose basal cells in olfactory epithelium. J Comp Neurol 469:457–474. 10.1002/cne.11031 [DOI] [PubMed] [Google Scholar]
- Chung K, Deisseroth K (2013) CLARITY for mapping the nervous system. Nat Methods 10:508–513. 10.1038/nmeth.2481 [DOI] [PubMed] [Google Scholar]
- Doty RL, Shaman P, Applebaum SL, Giberson R, Siksorski L, Rosenberg L (1984) Smell identification ability: changes with age. Science 226:1441–1443. 10.1126/science.6505700 [DOI] [PubMed] [Google Scholar]
- Douek E, Bannister LH, Dodson HC (1975) Recent advances in the pathology of olfaction. Proc R Soc Med 68:467–470. [DOI] [PMC free article] [PubMed] [Google Scholar]
- Feng WH, Kauer JS, Adelman L, Talamo BR (1997) New structure, the “olfactory pit,” in human olfactory mucosa. J Comp Neurol 378:443–453. 10.1002/(SICI)1096-9861(19970224)378:4%3C443::AID-CNE1%3E3.0.CO;2-2 [DOI] [PubMed] [Google Scholar]
- Fletcher RB, Prasol MS, Estrada J, Baudhuin A, Vranizan K, Choi YG, Ngai J (2011) P63 regulates olfactory stem cell self-renewal and differentiation. Neuron 72:748–759. 10.1016/j.neuron.2011.09.009 [DOI] [PMC free article] [PubMed] [Google Scholar]
- Franceschini V, Bettini S, Pifferi S, Menini A, Siciliano G, Ognio E, Brini AT, Di Oto E, Revoltella RP (2014) Transplanted human adipose tissue-derived stem cells engraft and induce regeneration in mice olfactory neuroepithelium in response to dichlobenil subministration. Chem Senses 39:617–629. 10.1093/chemse/bju035 [DOI] [PubMed] [Google Scholar]
- Genter MB, Owens DM, Carlone HB, Crofton KM (1996) Characterization of olfactory deficits in the rat following administration of 2,6-dichlorobenzonitrile (dichlobenil), 3,3′-iminodipropionitrile, or methimazole. Fundam Appl Toxicol 29:71–77. 10.1093/toxsci/29.1.71 [DOI] [PubMed] [Google Scholar]
- Goldstein BJ, Goss GM, Hatzistergos KE, Rangel EB, Seidler B, Saur D, Hare JM (2015) Adult c-Kit(+) progenitor cells are necessary for maintenance and regeneration of olfactory neurons. J Comp Neurol 523:15–31. 10.1002/cne.23653 [DOI] [PMC free article] [PubMed] [Google Scholar]
- Gopinath SD, Rando TA (2008) Stem cell review series: aging of the skeletal muscle stem cell niche. Aging Cell 7:590–598. 10.1111/j.1474-9726.2008.00399.x [DOI] [PubMed] [Google Scholar]
- Gossen M, Bujard H (1992) Tight control of gene expression in mammalian cells by tetracycline-responsive promoters. Proc Natl Acad Sci U S A 89:5547–5551. 10.1073/pnas.89.12.5547 [DOI] [PMC free article] [PubMed] [Google Scholar]
- Graziadei PP, Graziadei GA (1979) Neurogenesis and neuron regeneration in the olfactory system of mammals. I. Morphological aspects of differentiation and structural organization of the olfactory sensory neurons. J Neurocytol 8:1–18. 10.1007/BF01206454 [DOI] [PubMed] [Google Scholar]
- Graziadei PP, Levine RR, Monti Graziadei GA (1979) Plasticity of connections of the olfactory sensory neuron: regeneration into the forebrain following bulbectomy in the neonatal mouse. Neuroscience 4:713–727. 10.1016/0306-4522(79)90002-2 [DOI] [PubMed] [Google Scholar]
- Herrick DB, Lin B, Peterson J, Schnittke N, Schwob JE (2017) Notch1 maintains dormancy of olfactory horizontal basal cells, a reserve neural stem cell. Proc Natl Acad Sci U S A 114:E5589–E5598. 10.1073/pnas.1701333114 [DOI] [PMC free article] [PubMed] [Google Scholar]
- Holbrook EH, Leopold DA, Schwob JE (2005) Abnormalities of axon growth in human olfactory mucosa. Laryngoscope 115:2144–2154. 10.1097/01.MLG.0000181493.83661.CE [DOI] [PubMed] [Google Scholar]
- Holbrook EH, Wu E, Curry WT, Lin DT, Schwob JE (2011) Immunohistochemical characterization of human olfactory tissue. Laryngoscope 121:1687–1701. 10.1002/lary.21856 [DOI] [PMC free article] [PubMed] [Google Scholar]
- Holbrook EH, Iwema CL, Peluso CE, Schwob JE (2014) The regeneration of P2 olfactory sensory neurons is selectively impaired following methyl bromide lesion. Chem Senses 39:601–616. 10.1093/chemse/bju033 [DOI] [PMC free article] [PubMed] [Google Scholar]
- Holbrook EH, Szumowski KE, Schwob JE (1995) An immunochemical, ultrastructural, and developmental characterization of the horizontal basal cells of rat olfactory epithelium. J Comp Neurol 363:129–146. 10.1002/cne.903630111 [DOI] [PubMed] [Google Scholar]
- Huard JM, Youngentob SL, Goldstein BJ, Luskin MB, Schwob JE (1998) Adult olfactory epithelium contains multipotent progenitors that give rise to neurons and non-neural cells. J Comp Neurol 400:469–486. 10.1002/(SICI)1096-9861(19981102)400:4%3C469::AID-CNE3%3E3.0.CO;2-8 [DOI] [PubMed] [Google Scholar]
- Jang W, Youngentob SL, Schwob JE (2003) Globose basal cells are required for reconstitution of olfactory epithelium after methyl bromide lesion. J Comp Neurol 460:123–140. 10.1002/cne.10642 [DOI] [PMC free article] [PubMed] [Google Scholar]
- Kawaguchi D, Furutachi S, Kawai H, Hozumi K, Gotoh Y (2013) Dll1 maintains quiescence of adult neural stem cells and segregates asymmetrically during mitosis. Nat Commun 4:1880. 10.1038/ncomms2895 [DOI] [PMC free article] [PubMed] [Google Scholar]
- Kondo K, Watanabe K, Sakamoto T, Suzukawa K, Nibu K, Kaga K, Yamasoba T (2009) Distribution and severity of spontaneous lesions in the neuroepithelium and Bowman's glands in mouse olfactory mucosa: age-related progression. Cell Tissue Res 335:489–503. 10.1007/s00441-008-0739-9 [DOI] [PubMed] [Google Scholar]
- Kondo K, Suzukawa K, Sakamoto T, Watanabe K, Kanaya K, Ushio M, Yamaguchi T, Nibu K, Kaga K, Yamasoba T (2010) Age-related changes in cell dynamics of the postnatal mouse olfactory neuroepithelium: cell proliferation, neuronal differentiation, and cell death. J Comp Neurol 518:1962–1975. 10.1002/cne.22316 [DOI] [PubMed] [Google Scholar]
- Largent BL, Sosnowski RG, Reed RR (1993) Directed expression of an oncogene to the olfactory neuronal lineage in transgenic mice. J Neurosci 13:300–312. 10.1523/JNEUROSCI.13-01-00300.1993 [DOI] [PMC free article] [PubMed] [Google Scholar]
- Lee P, Morley G, Huang Q, Fischer A, Seiler S, Horner JW, Factor S, Vaidya D, Jalife J, Fishman GI (1998) Conditional lineage ablation to model human diseases. Proc Natl Acad Sci U S A 95:11371–11376. 10.1073/pnas.95.19.11371 [DOI] [PMC free article] [PubMed] [Google Scholar]
- Leung CT, Coulombe PA, Reed RR (2007) Contribution of olfactory neural stem cells to tissue maintenance and regeneration. Nat Neurosci 10:720–726. 10.1038/nn1882 [DOI] [PubMed] [Google Scholar]
- Lin B, Coleman JH, Peterson JN, Zunitch MJ, Jang W, Herrick DB, Schwob JE (2017) Injury induces endogenous reprogramming and dedifferentiation of neuronal progenitors to multipotency. Cell Stem Cell 21:761–774.e5. 10.1016/j.stem.2017.09.008 [DOI] [PMC free article] [PubMed] [Google Scholar]
- Ma L, Wu Y, Qiu Q, Scheerer H, Moran A, Yu CR (2014) A developmental switch of axon targeting in the continuously regenerating mouse olfactory system. Science 344:194–197. 10.1126/science.1248805 [DOI] [PubMed] [Google Scholar]
- Maresh A, Rodriguez Gil D, Whitman MC, Greer CA (2008) Principles of glomerular organization in the human olfactory bulb - implications for odor processing. PLoS One 3:e2640. 10.1371/journal.pone.0002640 [DOI] [PMC free article] [PubMed] [Google Scholar]
- Margolis FL. (1982) Olfactory marker protein (OMP). Scand J Immunol Suppl 9:181–199. 10.1111/j.1365-3083.1982.tb03764.x [DOI] [PubMed] [Google Scholar]
- Meisami E, Mikhail L, Baim D, Bhatnagar KP (1998) Human olfactory bulb: aging of glomeruli and mitral cells and a search for the accessory olfactory bulba. Ann N Y Acad Sci 855:708–715. 10.1111/j.1749-6632.1998.tb10649.x [DOI] [PubMed] [Google Scholar]
- Morrison EE, Costanzo RM (1989) Scanning electron microscopic study of degeneration and regeneration in the olfactory epithelium after axotomy. J Neurocytol 18:393–405. 10.1007/BF01190842 [DOI] [PubMed] [Google Scholar]
- Nakashima T, Kimmelman CP, Snow JB Jr (1984) Structure of human fetal and adult olfactory neuroepithelium. Arch Otolaryngol 110:641–646. 10.1001/archotol.1984.00800360013003 [DOI] [PubMed] [Google Scholar]
- Nguyen MQ, Zhou Z, Marks CA, Ryba NJ, Belluscio L (2007) Prominent roles for odorant receptor coding sequences in allelic exclusion. Cell 131:1009–1017. 10.1016/j.cell.2007.10.050 [DOI] [PMC free article] [PubMed] [Google Scholar]
- Packard A, Schnittke N, Romano RA, Sinha S, Schwob JE (2011) DeltaNp63 regulates stem cell dynamics in the mammalian olfactory epithelium. J Neurosci 31:8748–8759. 10.1523/JNEUROSCI.0681-11.2011 [DOI] [PMC free article] [PubMed] [Google Scholar]
- Paik SI, Lehman MN, Seiden AM, Duncan HJ, Smith DV (1992) Human olfactory biopsy: the influence of age and receptor distribution. Arch Otolaryngol Head Neck Surg 118:731–738. 10.1001/archotol.1992.01880070061012 [DOI] [PubMed] [Google Scholar]
- Pinto JM, Wroblewski KE, Kern DW, Schumm LP, McClintock MK (2014) Olfactory dysfunction predicts 5-year mortality in older adults. PLoS One 9:e107541. 10.1371/journal.pone.0107541 [DOI] [PMC free article] [PubMed] [Google Scholar]
- Potter SM, Zheng C, Koos DS, Feinstein P, Fraser SE, Mombaerts P (2001) Structure and emergence of specific olfactory glomeruli in the mouse. J Neurosci 21:9713–9723. 10.1523/JNEUROSCI.21-24-09713.2001 [DOI] [PMC free article] [PubMed] [Google Scholar]
- Rando TA. (2006) Stem cells, ageing and the quest for immortality. Nature 441:1080–1086. 10.1038/nature04958 [DOI] [PubMed] [Google Scholar]
- Schnittke N, Herrick DB, Lin B, Peterson J, Coleman JH, Packard AI, Jang W, Schwob JE (2015) Transcription factor p63 controls the reserve status but not the stemness of horizontal basal cells in the olfactory epithelium. Proc Natl Acad Sci U S A 112:E5068–5077. 10.1073/pnas.1512272112 [DOI] [PMC free article] [PubMed] [Google Scholar]
- Schwob JE, Youngentob SL, Mezza RC (1995) Reconstitution of the rat olfactory epithelium after methyl bromide-induced lesion. J Comp Neurol 359:15–37. 10.1002/cne.903590103 [DOI] [PubMed] [Google Scholar]
- Schwob JE, Youngentob SL, Ring G, Iwema CL, Mezza RC (1999) Reinnervation of the rat olfactory bulb after methyl bromide-induced lesion: timing and extent of reinnervation. J Comp Neurol 412:439–457. 10.1002/(SICI)1096-9861(19990927)412:3%3C439::AID-CNE5%3E3.0.CO;2-H [DOI] [PubMed] [Google Scholar]
- Schwob JE, Jang W, Holbrook EH, Lin B, Herrick DB, Peterson JN, Hewitt Coleman J (2017) Stem and progenitor cells of the mammalian olfactory epithelium: taking poietic license. J Comp Neurol 525:1034–1054. 10.1002/cne.24105 [DOI] [PMC free article] [PubMed] [Google Scholar]
- Smith RL, Baker H, Greer CA (1993) Immunohistochemical analyses of the human olfactory bulb. J Comp Neurol 333:519–530. 10.1002/cne.903330405 [DOI] [PubMed] [Google Scholar]
- Tomer R, Ye L, Hsueh B, Deisseroth K (2014) Advanced CLARITY for rapid and high-resolution imaging of intact tissues. Nat Protoc 9:1682–1697. 10.1038/nprot.2014.123 [DOI] [PMC free article] [PubMed] [Google Scholar]
- Van de Bittner GC, Riley MM, Cao L, Ehses J, Herrick SP, Ricq EL, Wey HY, O'Neill MJ, Ahmed Z, Murray TK, Smith JE, Wang C, Schroeder FA, Albers MW, Hooker JM (2017) Nasal neuron PET imaging quantifies neuron generation and degeneration. J Clin Invest 127:681–694. 10.1172/JCI89162 [DOI] [PMC free article] [PubMed] [Google Scholar]
- Vilchez D, Simic MS, Dillin A (2014) Proteostasis and aging of stem cells. Trends Cell Biol 24:161–170. 10.1016/j.tcb.2013.09.002 [DOI] [PubMed] [Google Scholar]
- Wang YZ, Yamagami T, Gan Q, Wang Y, Zhao T, Hamad S, Lott P, Schnittke N, Schwob JE, Zhou CJ (2011) Canonical wnt signaling promotes the proliferation and neurogenesis of peripheral olfactory stem cells during postnatal development and adult regeneration. J Cell Sci 124:1553–1563. 10.1242/jcs.080580 [DOI] [PMC free article] [PubMed] [Google Scholar]
- Weiler E, Farbman AI (1997) Proliferation in the rat olfactory epithelium: age-dependent changes. J Neurosci 17:3610–3622. 10.1523/JNEUROSCI.17-10-03610.1997 [DOI] [PMC free article] [PubMed] [Google Scholar]
- Xie F, Fang C, Schnittke N, Schwob JE, Ding X (2013) Mechanisms of permanent loss of olfactory receptor neurons induced by the herbicide 2,6-dichlorobenzonitrile: effects on stem cells and noninvolvement of acute induction of the inflammatory cytokine IL-6. Toxicol Appl Pharmacol 272:598–607. 10.1016/j.taap.2013.07.020 [DOI] [PMC free article] [PubMed] [Google Scholar]
- Yang A, Kaghad M, Wang Y, Gillett E, Fleming MD, Dötsch V, Andrews NC, Caput D, McKeon F (1998) p63, a p53 homolog at 3q27–29, encodes multiple products with transactivating, death-inducing, and dominant-negative activities. Mol Cell 2:305–316. 10.1016/S1097-2765(00)80275-0 [DOI] [PubMed] [Google Scholar]
- Yu CR, Power J, Barnea G, O'Donnell S, Brown HE, Osborne J, Axel R, Gogos JA (2004) Spontaneous neural activity is required for the establishment and maintenance of the olfactory sensory map. Neuron 42:553–566. 10.1016/S0896-6273(04)00224-7 [DOI] [PubMed] [Google Scholar]