

Abstract
The internal environment of an organism must remain stable to ensure optimal performance and ultimately survival. The generation of motivated behaviors is an adaptive mechanism for defending homeostasis. Although physiological state modulates motivated behaviors, the influence of physiological state on phasic dopamine signaling, an underlying neurobiological substrate of reward-driven behavior, is underexplored. Here, we use sodium depletion and water restriction, manipulations of body fluid homeostasis, to determine the flexibility and specificity of dopamine responses. Changes in dopamine concentration were measured using fast-scan cyclic voltammetry in the nucleus accumbens shell of male rats in response to intraoral infusions of fluids that either satisfied or did not satisfy homeostatic need. Increases in dopamine concentration during intraoral infusions were observed only under conditions of physiological deficit. Furthermore, dopamine increases were selective and limited to those that satisfied the need state of the animal. Thus, dopamine neurons track fluid balance and respond to salt and water stimuli in a state- and taste-dependent manner. Using Fluoro-Gold tracing and immunohistochemistry for c-Fos and Foxp2, a marker of sodium-deprivation responsive neurons, we revealed brainstem populations of neurons that are activated by sodium depletion and project directly to the ventral tegmental area. The identified projections may modulate dopamine neuron excitability and consequently the state-specific dopamine release observed in our experiments. This work illustrates the impact of physiological state on mesolimbic dopamine signaling and a potential circuit by which homeostatic disruptions are communicated to mesolimbic circuitry to drive the selective reinforcement of biologically-required stimuli under conditions of physiological need.
SIGNIFICANCE STATEMENT Motivated behaviors arise during physiological need and are highly selective for homeostasis-restoring stimuli. Although phasic dopamine signaling has been shown to contribute to the generation of motivated behaviors, the state and stimulus specificity of phasic dopamine signaling is less clear. These studies use thirst and sodium appetite to show that dopamine neurons dynamically track body fluid homeostasis and respond to water and salt stimuli in a state- and taste-dependent manner. We also identify hindbrain sodium deprivation-responsive neurons that project directly to the ventral tegmental area, where dopamine neuron cell bodies reside. This work demonstrates command of homeostasis over dopamine signaling and proposes a circuit by which physiological need drives motivated behavior by state- and taste-selective recruitment of phasic dopamine signaling.
Keywords: dopamine, motivation, nucleus accumbens, reward, voltammetry
Introduction
In response to physiological need, central circuits are recruited to direct behavior toward the approach and consumption of restorative stimuli. This is perhaps best illustrated by sodium appetite, the avid consumption of solutions containing the sodium ion following sodium deprivation (Richter, 1936). Under conditions of sodium deprivation (sodium deplete), animals will work for sodium (Wagman, 1963; Quartermain et al., 1967; Zhang et al., 1984) and approach predictors of sodium (Clark and Bernstein, 2006; Robinson and Berridge, 2013; Cone et al., 2016). When in positive sodium balance (sodium replete), such efforts are not observed. In fact, rats will actively avoid highly concentrated sodium chloride (NaCl) solutions unless they are sodium deplete (Nachman, 1962; Handal, 1965). Accompanying the change in intake behavior observed in sodium deplete animals is a marked increase in the palatability of NaCl (Berridge et al., 1984). In this way, sodium appetite powerfully demonstrates how the value of a biologically-required stimulus is dynamically modulated by physiological state and represents an opportunity to gain insight into the neural basis of motivated behavior.
Sodium deplete animals must be able to identify and discriminate stimuli to ingest those that are physiologically required. The highly refined gustatory system of rats allows for the immediate detection of NaCl during sodium appetite (Breslin et al., 1993; Spector et al., 1996). Sodium deplete rats selectively consume NaCl over other non-sodium salt solutions, like potassium chloride (KCl), illustrating that the taste system is sufficient to discriminate chemical differences on a single ion-level (Spector et al., 1996). The physiologically prompted and directed nature of motivated behavior (Stellar and Stellar, 1985) requires that underlying circuitry is in tune to sensory encoding of stimuli and the physiological state of the animal. Although the central circuits that identify disruptions in body fluid homeostasis and those that respond to taste are well characterized (Thornton and Norgren, 2016), the translation of that information into motor plans directed at the seeking and selective consumption of targeted stimuli is poorly understood.
The nucleus accumbens (NAc) converts motivation into action through cortical, limbic and thalamic afferents and motor-related efferents (Mogenson et al., 1980; Groenewegen et al., 1999; Meredith et al., 2008). The NAc shell subregion in particular has been implicated in encoding primary affective stimuli (Peciña et al., 2006). Appetitive stimuli, including the taste of hypertonic sodium under sodium deplete conditions, recruit differential firing patterns of NAc shell neurons relative to less palatable stimuli (Roitman et al., 2005; Loriaux et al., 2011). Pharmacological suppression of NAc shell neural activity increases appetitive orofacial responses to palatable tastes and promotes the initiation of nutrient-directed behaviors (Peciña and Berridge, 2000; Kelley, 2004; Mahler et al., 2007). Structures downstream to the NAc shell are differentially driven by sodium under deplete versus replete conditions (Smith and Berridge, 2007; Chang et al., 2017). Dopamine, which modulates the activity of the NAc (Nicola et al., 2000), is critical for NAc plasticity (Surmeier et al., 2011), is sufficient for positive reinforcement (Steinberg et al., 2014) and is a well supported neural substrate of goal-directed behavior (Schultz et al., 1997; Carelli, 2004). Although NAc dopamine is responsive to primary rewarding stimuli (Roitman et al., 2008), it remains unclear whether it selectively responds to stimuli that are only reinforcing under a particular set of physiological conditions.
We used sodium appetite and thirst to test the state and stimulus specificity of NAc shell dopamine signaling. We hypothesized that increases in phasic dopamine release, measured by fast-scan cyclic voltammetry (FSCV), would be evoked only by the taste of a biologically required stimulus (i.e., sodium chloride for a sodium deplete rat and water for a water-restricted rat). We also identified two cell populations that sense sodium deprivation and project directly to the ventral tegmental area (VTA). These projections represent a component of a potential circuit by which sodium deprivation facilitates dopamine signaling and the motivated behavior observed during sodium appetite.
Materials and Methods
Subjects
Adult male Sprague-Dawley rats (n = 124) weighing ∼350 g at the time of testing were used. Rats were individually housed in plastic cages with lights on from 7:00 A.M. to 7:00 P.M. All FSCV testing took place in standard operant chambers (Med Associates) during the light phase. Animals were given ad libitum access to standard laboratory chow (2010 Teklad global 18% protein diet) and tap water, unless otherwise noted. For details of housing as well as food and water access during the experiment, see Manipulations of body fluid homeostasis. All tested animals were naive to manipulations of body fluid homeostasis and intraoral infusions at the time of testing. Animal care and use was in accordance with the National Institute of Health (NIH) Guide for the Care and Use of Laboratory Animals and was approved by the Institutional Animal Care and Use Committee at the University of Illinois at Chicago.
Surgery
Animals used to investigate NAc phasic dopamine signaling patterns during intraoral fluid delivery (n = 80) were surgically prepared for FSCV and intraoral infusions. Animals were anesthetized with intraperitoneal ketamine hydrochloride (100 mg/kg) and xylazine hydrochloride (10 mg/kg). An in-depth description of the surgical preparation of animals for FSCV was described previously (Fortin et al., 2015). Briefly, a FSCV cannula (Bioanalytical Systems) was implanted above the NAc shell using coordinates [+1.7 mm anterior–posterior (AP), 0.9 mm medial-lateral (ML), and −2.5 mm dorsal-ventral (DV)] obtained from the rat brain atlas of Paxinos and Watson (2007). A chlorinated silver (Ag/AgCl) reference electrode was placed in the contralateral cortex. A bipolar stimulating electrode (0.20 mm diameter; Plastics One) was implanted into the VTA (−5.2 mm AP, +0.8 mm ML, −8.4 mm DV from the brain surface). All implants were secured with stainless steel surgical screws and dental cement.
To measure dopamine release patterns in the seconds before, during, and after the sensory experience of taste, we implanted all FSCV-prepared animals (n = 80) with intraoral catheters to directly infuse discrete boluses of tastants into the oral cavity (Grill and Norgren, 1978). Beyond allowing for analysis of dopamine release patterns during discrete time-locked taste exposures, this technique permitted examination of dopamine signaling in animals that were not motivated to consume the tested stimuli either because they did not have a physiological need for the stimulus (e.g., sodium replete) or because the tested stimulus did not satisfy the need state (e.g., KCl for a sodium depleted rat). Briefly, a catheter was constructed from ∼6 cm of PE-100 tubing (Scientific Commodities). One end of the catheter was flanged using a flame and a Teflon washer was fitted over the flanged end. A hypodermic needle was fitted to the other end, and the needle was inserted just anterolateral to the first maxillary molar and drawn, subcutaneously out the top of the scalp through a small (∼5 mm) incision. The catheter was drawn through the oral cavity until the washer lay flush against the molar. The catheter was secured in place with the addition of a second washer fitted over the exteriorized portion of the catheter and secured in place using epoxy. Following surgery, rats were injected with meloxicam (1 mg/kg, s.c.). Rats were given 5–7 d of postoperative recovery time. All animals returned to presurgical body weight during this time. To maintain catheter patency, intraoral catheters were flushed daily with distilled water throughout the postoperative period.
Animals used to investigate c-Fos activity of VTA projecting neurons (n = 7) were anesthetized with intraperitoneal ketamine hydrochloride (100 mg/kg) and xylazine hydrochloride (10 mg/kg). A trephine drill bit was used to remove the skull over the VTA (AP: −5.6 mm, ML: −0.5 mm). A custom injector was used to iontophoretically (5 μA, 7 s on/7 s off, 10 min) deliver the retrograde tracer Fluoro-Gold (FG; 2%, Fluorochrome) to the VTA (DV: 8 mm from skull) using a current pump (Digital Midgard Precision Current Source, Stoelting). Injectors were made by using a glass puller to create a taper on a capillary tube (1.0 × 0.5 mm, 4 inches, A-M Systems). The taper was cut under 10× magnification using a scalpel such that the diameter of the taper was 20 mm. After the current was terminated, the injector remained in situ for an additional 5 min to allow for residual diffusion before it was removed. The scalp of the rat was sutured closed. Following surgery, rats were injected with meloxicam (1 mg/kg, s.c.). Rats were given 5–7 d of postoperative recovery time. All animals returned to presurgical body weight during this time.
Manipulations of body fluid homeostasis
Sodium depletion.
Animals (n = 63) were made sodium deplete by two, equal-volume injections, spaced 1 h apart, of the diuretic furosemide (20 mg/ml, 0.5 ml/kg, s.c.; Sigma-Aldrich). Furosemide treatment is a well established method of sodium depletion that causes rapid diuresis and expression of a sodium appetite (Fitzsimons, 1998). Animals tested in a replete state (n = 36) were injected with vehicle (100% DMSO) in place of furosemide. All injections were spaced 1 h apart. FSCV recordings, the two-bottle intake test or sacrifice for immunohistochemistry (IHC; see Immunohistochemistry section) began 24 h after the first injection. During the 24 h depletion period, all animals were housed in hanging wire-bottomed cages to prevent the ingestion of urine.
Before injections, food and water were removed and the rats were weighed. Diuresis was evaluated by weighing the animal 2 h following the first injection. Animals were deemed “sodium deplete” if they lost at least 15 g of body weight during the 2 h period following furosemide injection. At this time, sodium deplete animals were provided ad libitum distilled water and sodium deficient diet (Teklad Sodium Deficient Diet; Harlan). Sodium replete animals were provided with ad libitum water and standard laboratory chow.
Water restriction.
Both water-restricted (n = 15) and ad libitum-watered (n = 10) animals were housed in hanging wire bottomed cages for the 24 h preceding the FSCV recording session. During this time water-restricted animals were provided with only ad libitum standard rodent chow. Ad libitum-watered animals were provided with ad libitum standard rodent chow and water. Water restriction was confirmed by weighing the animals following the restriction period. Animals were included in analysis if they lost at least 15 g of body weight during this 24 h period.
FSCV session
Before FSCV testing, the intraoral cannula was flushed with water to ensure patency. The intraoral cannula was then connected to an infusion line that ran through an electric swivel (for FSCV recording) and then through a fluid swivel and outside a sound-attenuated chamber to ensure freedom of movement. The infusion line was connected to a solenoid valve before terminating at reservoir containing either a salt solution (in m: 0.45 NaCl, 0.15 NaCl, 0.15 KCl, 0.15 LiCl) or distilled water. Solutions were gravity fed and the height of the reservoir was adjusted such that opening the solenoid valve for 4 s resulted in 200 μl of fluid delivered to the rat.
FSCV recording sessions in awake and behaving animals are described in detail previously (Fortin et al., 2015). Briefly, rats (n = 80) were connected to a FSCV head-mounted voltammetric amplifier in a sound-attenuated standard operant chamber (Med-Associates) by both their FSCV recording electrode and Ag/AgCl reference electrode. The FSCV carbon-fiber recording electrode was lowered into NAc shell dopamine terminals by means of a micromanipulator (Research Resource Center, UIC). A triangular voltage waveform was applied to the carbon-fiber (from −0.4 to 1.3 to −0.4 V relative to the Ag/AgCl reference electrode, 400 V/s, 60 Hz) for 30 min to allow for electrode equilibration. The rate was then changed to 10 Hz for 15 min before data acquisition and remained at that frequency throughout. Application of each waveform resulted in a background current, which was subtracted from the current resulting from the oxidation and reduction of dopamine evoked during recording. Current changes resulting from the oxidation and reduction of dopamine were converted into concentration changes using a calibration factor obtained from exposing the electrode to a known concentration of dopamine after data collection concluded (Sinkala et al., 2012). Application of the waveform as well as current measurements were computer controlled (National Instruments and Tarheel CV, UNC Electronics Facility).
While continuously sampling dopamine release patterns in the NAc shell, remotely controlled (Med Associates) intraoral infusions occurred. The solenoid valve was opened (flow rate = 50 μl/s) for 4 s to allow for discrete infusions (200 μl) of either a salt solution or distilled water to the mouth of the rat. Each experimental session consisted of 10 discrete intraoral infusions with a variable intertrial interval (range: 30–90 s, mean: 60 ± 8.2 s) to prevent anticipation of delivery. Following the intraoral infusion session, the VTA was electrically stimulated at 120 μA with a range of frequencies (30–60 Hz) and pulse numbers (5,8,10, 20, 24). Cyclic voltammograms (CV; current by voltage plots) from electrically evoked dopamine and pH changes were later used to extract dopamine concentration changes throughout the session (see FSCV data analysis). FSCV hardware and intraoral cannula were disconnected and rats were returned to hanging wire-bottom cages for 24 h postrecording measurements of food intake, fluid intake, and body weight.
At the conclusion of experiments, rats were deeply anesthetized with sodium pentobarbital (100 mg/kg; Sigma-Aldrich). A polyamide-insulated stainless steel electrode (A-M Systems) was lowered through the guide cannula to the same depth as the recording electrode and current was passed to create an electrolytic lesion. Next, brains were extracted and stored in formalin for 24 h before transferring them to 30% sucrose in 0.1 m phosphate buffer. Brains were then sectioned (35 μm) on a cryostat. Coronal sections were mounted on slides. Light microscopy, together with the rat atlas of Paxinos and Watson (2007) were used to determine the location of the electrolytic lesion. Only those recordings sites verified to have been in the NAc shell were analyzed.
Two-bottle intake test
Removal of the adrenal glands prevents sodium retention and leads to the development of a chronic sodium appetite (Richter, 1936; Epstein and Stellar, 1955). Two-bottle intake tests performed in adrenalectomized rats have reported that sodium deplete rats have a strong preference for NaCl over KCl but equally prefer NaCl and LiCl (Nachman, 1962). Here, we investigated whether similar preferences are obtained with acute, furosemide-depleted rats. All rats (n = 29) were made 24 h sodium deplete. Diuresis was confirmed in all animals as described in the Manipulation of body fluid homeostasis section. A two-bottle intake test was conducted in hanging wire bottom cages. Rats were presented with two graduated cylinder sipper tubes containing isomolar (0.15 m) solutions of either KCl and NaCl (n = 14) or LiCl and NaCl (n = 15). Placement of the NaCl-containing sipper tube on the right or left-hand side of the cage was pseudorandomly counterbalanced. Rats were allowed 10 min to voluntarily consume the solutions.
Immunohistochemistry
Sodium deplete (n = 7) and Sodium replete (n = 8) animals were sacrificed for IHC. Rats were deeply anesthetized with sodium pentobarbital (100 mg/kg; Sigma-Aldrich) and then transcardially perfused with 0.9% saline followed by 4% paraformaldehyde in 0.1 m sodium phosphate buffer (Sigma-Aldrich), pH 7.4. Brains were removed and stored in 4% paraformaldehyde in 0.1 m sodium phosphate buffer, pH 7.4, for 24 h before being transferred to 20% sucrose in sodium phosphate buffer. Brains were cut on a cryostat (35 μm) into three serial sets.
Coronal sections through the pons were processed for native FG fluorescence and immunohistochemical detection of FoxP2 (forkhead box protein P2) and c-Fos. Free-floating sections were washed three times with a 0.1 m sodium phosphate buffer. They were next incubated for 1 h at room temperature in a blocking solution containing 3% normal donkey serum (Jackson ImmunoResearch) and 0.3% Triton-X (Sigma-Aldrich) in 0.1 m sodium phosphate buffer. Sections were then incubated overnight at room temperature in an antibody mixture (1:2500 sheep anti-FoxP2; R&D Systems, catalog #AF5647; RRID:AB_2107133) and 1:2000 rabbit anti-c-Fos (Cell Signaling Technology, catalog #2250; RRID:AB_2247211)] containing 3% normal donkey serum and 0.3% Triton-X.
After the overnight primary antibody incubation, sections were washed three times with 0.1 m sodium phosphate buffer. They were next incubated for 4 h at room temperature in a secondary antibody (1:500 of both Cy3 donkey anti-sheep and AlexaFluor 488 donkey anti-rabbit; Jackson ImmunoResearch) solution in 3% normal donkey serum and 0.3% Triton-X. Sections were washed three times with a 0.1 m sodium phosphate buffer before being wet mounted onto Superfrost Plus microscope slides (Fisher Scientific) for imaging. Dry coronal sections were imaged under 200× magnification on an Olympus FV1000 microscope. Separate photographs of were taken of FG, FoxP2, and c-Fos expression under blue, red, and green fluorophore excitation, respectively, using an X-Cite XLED1 light source (Excelitas Technologies).
Experimental design and statistical analysis
FSCV session.
Individual infusion trials (5 s preceding and 10 s following the onset of the intraoral infusion) were isolated from the entirety of the experimental session. Trials were background-subtracted and dopamine concentration changes were extracted using template CVs obtained from VTA stimulation, a current to concentration conversion factor obtained through a postcalibration step (Sinkala et al., 2012) and principal component analysis (Heien et al., 2004). The average dopamine concentration during the 5 s before infusion (baseline, −5 to 0 s) was compared with the average dopamine concentration during the 4 s infusion period (infusion, 0 to 4 s). Individual animals' average dopamine concentration during each epoch (i.e., baseline and infusion) are plotted. Statistical comparisons of average dopamine concentration during the baseline and infusion periods were conducted for each intraoral stimulus in sodium replete, sodium deplete, ad libitum, and water-restricted rats using two-way ANOVAs (epoch × group) with Tukey's HSD post hoc tests where appropriate. Statistical analyses were performed in the programming language R.
Two-bottle intake test.
Intake of each solution during the 10 min test was measured. Cumulative intake was calculated by adding intake volumes of the two solutions. Preference scores for the non-sodium salt were calculated for each animal (intake volume of non-sodium salt/ total intake volume). Cumulative intake and preference scores of rats presented with LiCl and NaCl were compared with rats presented with KCl and NaCl using a two-tailed Student's t tests. All group data are expressed as mean ± SEM.
Immunohistochemistry.
For FG-injected animals (n = 7), coronal sections though the VTA were examined for native FG fluorescence. Only rats with FG injection sites restricted to the VTA were included in subsequent analysis. For all IHC analyses, three sections per animal for each region of interest within the pons [pre-locus ceruleus (pre-LC); inner segment of the external lateral parabrachial nucleus (PBel-inner)] were quantified. Coronal sections most anatomically representative of the pre-LC and PBel-inner were selected by a treatment-blind experimenter. Regions of interest were selected on the basis of past work indicating the anatomical location of sodium deprivation-responsive FoxP2 neurons (Geerling et al., 2011). Adobe Photoshop was used to merge images taken under blue (FG), red (FoxP2), and green (c-Fos) fluorophore excitation. A counting boundary for each regions of interest was drawn around the pre-LC and PBel-inner. For the pre-LC, a circle with a diameter of 400 μm was positioned with its lateral edge bordering the most medial region of the tract of the mesencephalic trigeminal nucleus. For the PBel-inner, a rectangle (350 × 210 μm), was positioned along the ventral border of the superior cerebellar peduncle with its medial edge bordering the most lateral region of the peduncle. The counting boundaries for both the pre-LC and PBel-inner are slightly more restrictive, yet overlap, with previously published reports (Geerling et al., 2011). Cell counts were made for FoxP2+, c-Fos+, and double-labeled (FoxP2+/c-Fos+) neurons in both regions of interest (pre-LC and Pbel-inner). Counts were made in Adobe Photoshop and entered into a Microsoft Excel spreadsheet by a treatment-blind experimenter. Total cell number counts of individual animals (Tables 1, 2) are graphically represented by open circles (see Figs. 4B,C, 5B,C) and reflective of the sum of the cells counted within the region of interest of the three quantified coronal sections. Average cell number counts (see Figs. 4B,C, 5B,C) are group data, expressed as the mean ± SEM. Cell number comparisons were made within each region using two-way ANOVAs (marker × group) with Tukey's HSD post hoc tests where appropriate. All other statistical comparisons for IHC data (see Figs. 4D, 5D–F) were made using two-way ANOVAs (region × group) with Tukey's HSD post hoc tests where appropriate. Statistical analyses were performed in R.
Table 1.
Expression of FoxP2 and c-Fos in the pre-LC and PBel-inner of both sodium replete and sodium deplete rats
| FoxP+ (total) | c-Fos+ (total) | FoxP2+ c-Fos+ | FoxP2+ c-Fos− | FoxP2− c-Fos+ | |
|---|---|---|---|---|---|
| pre-LC | |||||
| Replete 1 | 131 | 20 | 10 | 121 | 10 |
| Replete 2 | 153 | 16 | 16 | 137 | 0 |
| Replete 3 | 127 | 8 | 5 | 122 | 3 |
| Replete 4 | 125 | 5 | 1 | 124 | 4 |
| Mean | 134.0 | 12.3 | 8.0 | 126.0 | 4.3 |
| SEM | 6.45 | 3.47 | 3.24 | 3.72 | 2.10 |
| Deplete 1 | 197 | 110 | 107 | 90 | 3 |
| Deplete 2 | 136 | 89 | 85 | 51 | 4 |
| Deplete 3 | 121 | 86 | 82 | 39 | 4 |
| Deplete 4 | 172 | 117 | 116 | 56 | 1 |
| Mean | 156.5 | 100.5 | 97.5 | 59.0 | 3.0 |
| SEM | 17.23 | 7.66 | 8.31 | 10.93 | 0.71 |
| PbeI-inner | |||||
| Replete 1 | 104 | 6 | 3 | 101 | 3 |
| Replete 2 | 166 | 14 | 10 | 156 | 4 |
| Replete 3 | 130 | 5 | 3 | 127 | 2 |
| Replete 4 | 154 | 4 | 2 | 152 | 2 |
| Mean | 138.5 | 7.3 | 4.5 | 134.0 | 2.8 |
| SEM | 13.72 | 2.29 | 1.85 | 12.73 | 0.48 |
| Deplete 1 | 188 | 59 | 58 | 130 | 1 |
| Deplete 2 | 170 | 50 | 47 | 123 | 3 |
| Deplete 3 | 150 | 69 | 64 | 86 | 5 |
| Deplete 4 | 165 | 68 | 67 | 98 | 1 |
| Mean | 168.3 | 61.5 | 59.0 | 109.3 | 2.5 |
| SEM | 7.84 | 4.44 | 4.42 | 10.36 | 0.96 |
Top, Within the pre-LC, FoxP2 (FoxP2+ total), and c-Fos (c-Fos+ total) immunopositive neurons were quantified in both sodium replete (n = 4) and sodium deplete (n = 4) rats. Individual data along with the mean SEM is presented for each expression profile observed. Bottom, Within the PBel-inner, FoxP2 (FoxP2+ total), and c-Fos (c-Fos+ total) immunopositive neurons were quantified in both Sodium Replete (n = 4) and sodium deplete (n = 4) rats. Individual data along with the mean SEM is presented for each expression profile observed.
Table 2.
Expression of FG, FoxP2, and c-Fos in the pre-LC and PBel-inner of both sodium replete and sodium deplete rats
| FG+ (total) | FoxP2+ (total) | c-Fos (total) | FG+ FoxP2+ c-Fos+ | FG+ FoxP2+ c-Fos− | FG+ FoxP2− c-Fos− | FG+ FoxP2− c-Fos+ | FG− FoxP2+ c-Fos+ | FG− FoxP2+ c-Fos− | FG− FoxP2− c-Fos+ | |
|---|---|---|---|---|---|---|---|---|---|---|
| pre-LC | ||||||||||
| Replete A | 75 | 156 | 13 | 6 | 52 | 15 | 2 | 4 | 94 | 1 |
| Replete B | 73 | 157 | 15 | 10 | 50 | 12 | 1 | 0 | 97 | 4 |
| Replete C | 68 | 121 | 1 | 0 | 39 | 28 | 1 | 0 | 82 | 0 |
| Replete D | 56 | 181 | 4 | 0 | 29 | 27 | 0 | 3 | 149 | 1 |
| Mean | 68.0 | 153.8 | 8.3 | 4.0 | 42.5 | 20.5 | 1.0 | 1.8 | 105.5 | 1.5 |
| SEM | 4.26 | 12.35 | 3.40 | 2.45 | 5.33 | 4.09 | 0.41 | 1.03 | 14.86 | 0.87 |
| Deplete A | 65 | 141 | 120 | 50 | 5 | 5 | 5 | 60 | 26 | 5 |
| Deplete B | 99 | 233 | 157 | 77 | 12 | 10 | 0 | 80 | 64 | 0 |
| Deplete C | 91 | 202 | 149 | 68 | 9 | 9 | 5 | 73 | 52 | 3 |
| Mean | 85.0 | 192.0 | 142.0 | 65.0 | 8.7 | 8.0 | 3.3 | 71.0 | 47.3 | 2.7 |
| SEM | 10.26 | 27.02 | 11.24 | 7.94 | 2.03 | 1.53 | 1.67 | 5.86 | 11.22 | 1.45 |
| PBeI-inner | ||||||||||
| Replete A | 37 | 110 | 19 | 8 | 16 | 11 | 2 | 1 | 85 | 8 |
| Replete B | 36 | 188 | 12 | 4 | 28 | 3 | 1 | 4 | 152 | 3 |
| Replete C | 66 | 145 | 7 | 4 | 17 | 44 | 1 | 2 | 122 | 0 |
| Replete D | 56 | 87 | 5 | 3 | 5 | 48 | 0 | 2 | 77 | 0 |
| Mean | 48.8 | 132.5 | 10.8 | 4.8 | 16.5 | 26.5 | 1.0 | 2.3 | 109.0 | 2.8 |
| SEM | 7.36 | 22.01 | 3.12 | 1.11 | 4.70 | 11.41 | 0.41 | 0.63 | 17.36 | 1.89 |
| Deplete A | 38 | 123 | 58 | 3 | 1 | 34 | 0 | 51 | 68 | 4 |
| Deplete B | 46 | 181 | 74 | 28 | 9 | 9 | 0 | 45 | 99 | 1 |
| Deplete C | 51 | 122 | 77 | 36 | 12 | 3 | 0 | 41 | 33 | 0 |
| Mean | 45.0 | 142.0 | 69.7 | 22.3 | 7.3 | 15.3 | 0.0 | 45.7 | 66.7 | 1.7 |
| SEM | 3.79 | 19.50 | 5.90 | 9.94 | 3.28 | 9.49 | 0.00 | 2.91 | 19.06 | 1.20 |
Top, Within the pre-LC, FG (FG+ total), FoxP2 (FoxP2+ total), and c-Fos (c-Fos+ total) immunopositive neurons were quantified in both sodium replete (n = 4) and sodium deplete (n = 3) rats. Individual data along with the mean SEM is presented for each expression profile observed. Bottom, Within the PBel-inner, FG (FG+ total), FoxP2 (FoxP2+ total), and c-Fos (c-Fos+ total) immunopositive neurons were quantified in both sodium replete (n = 4) and sodium deplete (n = 3) rats. Individual data along with the mean SEM is presented for each expression profile observed.
Figure 4.

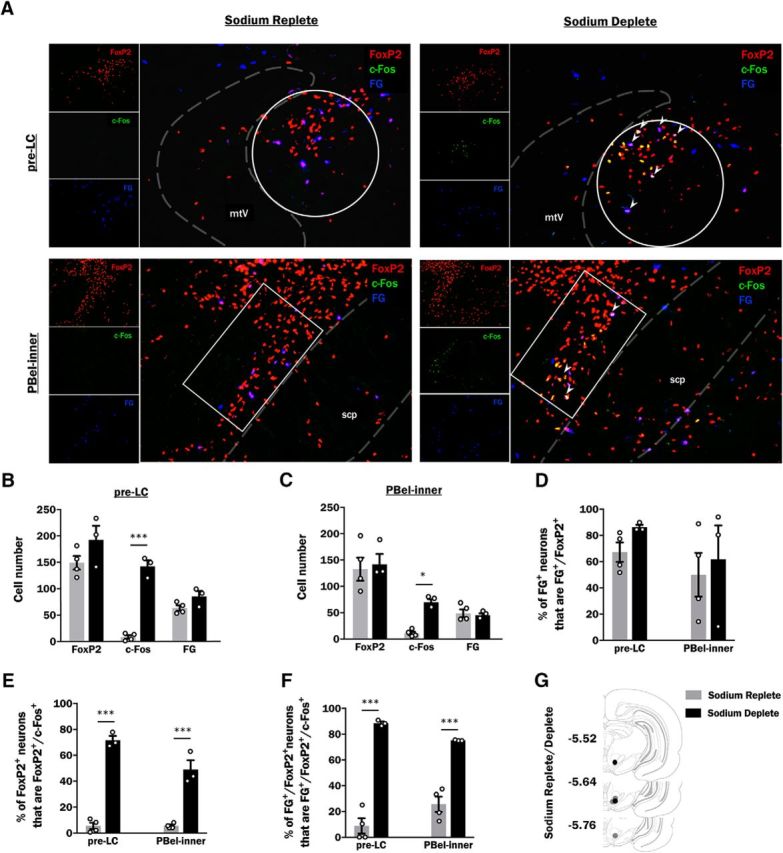
Expression of FoxP2 and c-Fos within the pre-LC and PBel-inner of sodium replete and sodium deplete rats. A, Representative photoimages through the pre-LC (top row) and PBel-inner (bottom row) of a sodium replete (left) and a sodium deplete (right) rat showing FoxP2 (red) and c-Fos (green)-immunoreactive neurons and their colocalization (yellow; larger image). White circles and rectangles are the defined area of interest selected for quantification within the pre-LC and PBel-inner, respectively, and dashed lines represent the boundaries of neuroanatomical landmarks used to establish the region-of-interest. B, Average cell counts (mean ± SEM) of FoxP2- and c-Fos-expressing neurons in the pre-LC of sodium replete (gray bars; n = 4) and sodium deplete (black bars; n = 4) rats. C, Average cell counts (mean ± SEM) of FoxP2- and c-Fos-expressing neurons in the PBel-inner of sodium replete (gray bars; n = 4) and sodium deplete (black bars; n = 4) rats. D, Sodium depletion increases c-Fos expression within FoxP2-expressing cells (FoxP2+/c-Fos+) of the pre-LC (left) and PBel-inner (right). B–D, Data are expressed as averages (mean ± SEM) and data points from individual animals are represented by open circles. mtV, Tract of the mesencephalic trigeminal nucleus; scp, superior cerebellar peduncle. **p < 0.01, ***p < 0.001.
Figure 5.
Expression of FG), FoxP2, and c-Fos within the pre-LC and PBel-inner of sodium replete and sodium deplete rats. A, Representative photoimages through the pre-LC (top row) and PBel-inner (bottom row) of a sodium replete (left) and a sodium deplete (right) rat showing FG (blue), FoxP2 (red), and c-Fos (green) immunoreactive neurons and their colocalization (larger image). Representative cells that express all three markers appear white and are indicated by arrowheads. White circles and rectangles are the defined area of interest selected for quantification within the pre-LC and PBel-inner, respectively, and dashed lines represent the boundaries of neuroanatomical landmarks used to establish the region of interest. B, Average cell counts (mean ± SEM) of FG-, FoxP2-, and c-Fos-expressing neurons in the pre-LC of sodium replete (gray bars; n = 4) and sodium deplete (black bars; n = 3) rats. C, Average cell counts (mean ± SEM) of FG-, FoxP2-, and c-Fos-expressing neurons in the PBel-inner of sodium replete (gray bars; n = 4) and sodium deplete (black bars; n = 3) rats. D, Sodium depletion does not change the percentage of FG-expressing neurons (FG+) that coexpress FoxP2 (FG+/FoxP2+) in the pre-LC (left) or PBel-inner (right). E, Sodium depletion increases c-Fos expression within FoxP2-expressing cells (FoxP2+/c-Fos+) of the pre-LC (left) and PBel-inner (right). F, Sodium depletion increases the expression of c-Fos within FG- and FoxP2-immunopositive cells of the pre-LC (left) and PBel-inner (right). In both brain regions, sodium deplete rats (black bars) have a significantly increased percentage of FG- and FoxP2-expressing neurons (FG+/FoxP2+) that also express c-Fos (FG+/FoxP2+/c-Fos+) relative to sodium replete (gray bars) rats. G, Approximate injection sites of FG in sodium replete (gray circles) and sodium deplete (black circles) rats. Injection sites are depicted as circles on coronal sections modified from Paxinos and Watson (2007). Numbers to the left indicate approximate distance from bregma. B–F, Data are expressed as averages (mean ± SEM) and data points from individual animals are represented by open circles. mtV, Tract of the mesencephalic trigeminal nucleus; scp, superior cerebellar peduncle. *p < 0.05, ***p < 0.001.
Results
Phasic dopamine responses to intraoral fluid stimuli are state-dependent
Figure 1 represents average dopamine responses in the NAc shell to intraoral infusion of 0.45 m NaCl in sodium deplete and sodium replete rats. Average color plots [depicting current (color) as a function of applied electrode potential (Eapp; y-axis) and time (s; x-axis)] were generated to visualize the average dopamine response across all 10 infusion trials of sodium replete (n = 5) and sodium deplete (n = 5) rats. In sodium replete rats, current at the known oxidation potential for dopamine (∼0.65 V) decreases in response to intraoral infusion of 0.45 m NaCl. In contrast, intraoral infusion of 0.45 m NaCl in sodium deplete rats causes an increase in current at ∼0.65 V and a decrease in current at ∼−0.2 V; the peak oxidation and reduction potentials for dopamine. To reinforce this point, the average background subtracted CV (current by voltage plot) taken at the offset of the intraoral infusion compares favorably to that obtained in in vitro studies with known concentrations of dopamine (Heien et al., 2004) for sodium deplete (Fig. 1B, black trace) but not sodium replete (Fig. 1B, gray trace) rats.
Figure 1.

Phasic dopamine signaling evoked by hypertonic NaCl is state-dependent. A, Average color plot from all 10 trials of intraoral infusion of 0.45 m NaCl in sodium replete (n = 5; left) and sodium deplete (n = 5; right) rats. Color plots depict changes in current (color) as a function of applied potential (Eapp; y-axis) and time (s; x-axis). Dopamine can be observed in response to intraoral infusion (On) in sodium deplete rats based on its oxidation (green feature at ∼0.65 V) and reduction (yellow feature at −0.2 V). B, CVs averaged across each of the intraoral infusion trials conducted in sodium replete (gray trace) or sodium deplete (black trace) rats. In this and all panels to follow, shading about the trace represents ±1 SEM. CVs were taken at infusion offset (Off; 4 s) and averaged. CVs were compared with the known CV for dopamine obtained using in vitro calibrations to confirm the presence (sodium deplete) or absence (sodium replete) of dopamine. C, Average dopamine concentration response in sodium replete (gray trace) and sodium deplete (black trace) rats during the 15 s (x-axis) surrounding the onset (On) and offset (Off) a 4 s intraoral infusion of 0.45 m NaCl. D, Average dopamine concentration during the 5 s baseline period (striped bars) vs the 4 s infusion period (solid bars) of 0.45 m NaCl in sodium replete (gray bars) and sodium deplete (black bars) rats. C, D, Average dopamine concentration (mean ± SEM) is representative of 10 intraoral infusion trials. D, Dopamine concentration of individual animals during the baseline and infusion periods is represented by connected circles. E, Summary of FSCV recording locations within the NAc shell of sodium replete (gray circles; n = 5) and sodium deplete (black circles; n = 5) rats infused with 0.45 m NaCl. Recording locations are depicted as circles on coronal sections modified from Paxinos and Watson (2007). Numbers to the left indicate approximate distance from bregma. **p < 0.01.
Statistical analyses of dopamine responses to intraoral infusions included comparisons of epoch [baseline (−5 to On) and infusion (On to Off; 4 s)] and group [e.g., replete and deplete]. Here, statistical analyses revealed a main effect of epoch (F(1,8) = 5.86; p = 0.04), no main effect of group (F(1,8) = 3.48; p = 0.1), and a significant interaction of epoch and group (F(1,8) = 24.44; p = 0.001). Although intraoral infusion of 0.45 m NaCl in sodium replete rats (n = 5) caused a modest decrease in dopamine concentration relative to baseline (Fig. 1C), the average dopamine concentration during the infusion period was not significantly different from the average baseline dopamine concentration (6.7 ± 3.4 vs 15.9 ± 6.9 nm for infusion and baseline periods, respectively; p = 0.35; Fig. 1D). However, in sodium deplete rats (n = 5), intraoral infusion of the same hypertonic sodium solution (0.45 m NaCl) caused a markedly different dopamine response: a sharp and sustained increase in dopamine concentration relative to baseline (Fig. 1C). The dopamine concentration during the infusion period observed in these animals was significantly different relative to baseline dopamine concentration (37.7 ± 7.5 vs 10.8 ± 2.4 nm for infusion and baseline periods, respectively; p = 0.004; Fig. 1D). There were no baseline differences in dopamine concentration between sodium replete and sodium deplete rats (p = 0.91). Histology confirmed that all recordings from sodium replete and sodium deplete rats were made in the NAc shell (Fig. 1E).
Similarly to the state-dependent dopamine response to hypertonic NaCl, intraoral infusion of distilled water in ad libitum and water-restricted rats revealed a main effect of epoch (F(1,8) = 8.17; p = 0.02) but not group (F(1,8) = 1.45; p = 0.26) and a significant interaction of epoch and group (F(1,8) = 22.12; p = 0.002). Whereas water infusion in ad libitum-watered rats (n = 5) caused a modest decrease in dopamine concentration relative to baseline (Fig. 2A), the average dopamine concentration during the infusion period was not significantly different from the average baseline dopamine concentration (10.9 ± 3.6 vs 15.8 ± 3.4 nm for infusion and baseline periods, respectively; p = 0.58; Fig. 2B). However, in water-restricted rats (n = 5), intraoral infusion of distilled water caused a markedly different response: a sharp and sustained increase in dopamine concentration relative to baseline (Fig. 2A). The dopamine concentration during the infusion period observed in these animals was significantly different relative to baseline dopamine concentration (28.5 ± 4.3 vs 8.2 ± 2.4 nm; p = 0.003; Fig. 2B). There were no baseline differences in dopamine concentration between ad libitum and water-restricted rats (p = 0.43). Histology confirmed that all recordings from ad libitum and water-restricted rats were made in the NAc shell (Fig. 2C).
Figure 2.

Phasic dopamine signaling evoked by water is state-dependent. A, Average dopamine concentration response in ad libitum-watered (light blue trace; n = 5) and water-restricted (royal blue trace; n = 5) rats during the 15 s (x-axis) surrounding the onset (On) and offset (Off) a 4 s intraoral infusion of distilled water. B, Average dopamine concentration during the 5 s baseline period (striped bars) vs the 4 s infusion period (solid bars) of distilled water in ad libitum-watered (light blue bars) and water-restricted (royal blue bars) rats. A, B, Average dopamine concentration (mean ± SEM) is representative of 10 intraoral infusion trials. Dopamine concentration of individual animals during the baseline and infusion periods is represented by connected circles. C, Summary of FSCV recording locations within the NAc shell of ad libitum-watered (light blue circles; n = 5) or water-restricted (royal blue circles; n = 5) rats infused with distilled water. Recording locations are depicted as circles on coronal sections modified from Paxinos and Watson (2007). Numbers to the left indicate approximate distance from bregma. **p < 0.01.
Furosemide-treated rats discriminate NaCl and KCl but not NaCl and LiCl
A two-bottle preference test in sodium deplete rats revealed no group differences in cumulative intake when comparing rats that received KCl and NaCl (n = 14) to those that received LiCl and NaCl (n = 15; 10.4 ± 1.8 vs 10.5 ± 1.5 ml, respectively; p = 0.96). Rats presented with KCl and NaCl had a strong preference for NaCl (preference score for non-sodium = 0.1 ± 0.04). However, rats presented with LiCl and NaCl had no preference for LiCl over NaCl (preference score for non-sodium salt = 0.6 ± 0.09). The preference scores for the two groups of rats tested were significantly different from each other (p = 0.00002). Together, these results suggest that furosemide-treated rats fail to discriminate NaCl from LiCl but do discriminate between NaCl and KCL. From the two-bottle intake test, clear predictions can be made regarding the dopamine responses to intraoral salt solutions in sodium deplete rats, with only NaCl and LiCl evoking phasic dopamine increases.
State-dependent dopamine responses are taste-specific
Two-way ANOVAs revealed no epoch or group effects for rats infused with either 0.15 m KCl (F(1,9) = 1.89, p = 0.2 for epoch and F(1,9) = 0.59, p = 0.46 for group) or H2O (F(1,9) = 1.13, p = 0.31 for epoch and F(1,9) = 0.06, p = 0.81 for group). Therefore, there were no differences between the average dopamine concentration during the infusion period and the baseline period for either sodium replete (n = 6; 11.5 ± 1.7 vs 14.6 ± 2.7 nm) or sodium deplete (n = 5; 15.4 ± 2.9 vs 17.3 ± 5.4 nm) rats infused with KCl (Fig. 3A,B). The same was true of H2O infused rats (sodium replete: n = 5 13.6 ± 2.2 vs 18.6 ± 3.3 nm; sodium deplete: n = 6, 15.6 ± 3.1 vs 14.6 ± 3.3 nm; Fig. 3A,B).
Figure 3.

Phasic dopamine signaling evoked by salt solutions is taste-dependent. A, Average dopamine concentration response in sodium replete (n = 23; top) and sodium deplete (n = 22; bottom) rats during the 15 s (x-axis) surrounding the onset (On) and offset (Off) a 4 s intraoral infusion of a 0.15 m solution of NaCl (red trace), KCl (brown trace), LiCl (orange trace), or distilled H2O (green trace). B, Average dopamine concentration during the 5 s baseline period (striped bars) vs the 4 s infusion period (solid bars) of a 0.15 m salt solution or distilled H2O in sodium replete or sodium deplete rats (colors follow those used in A; NaCl: n = 6 replete/6 deplete; KCl: n = 6/5; LiCl: n = 6/5; H2O: n = 5/6). A, B, Average dopamine concentration (mean ± SEM) is representative of 10 intraoral infusion trials. Dopamine concentration of individual animals during the baseline and infusion periods is represented by connected circles. C, Summary of FSCV recording sites within the NAc shell of sodium replete rats infused with 0.15 m NaCl (red circles), KCl (brown circles), LiCl (orange circles), or distilled H2O (green circles). Recording sites are depicted as circles on coronal sections modified from Paxinos and Watson (2007). Numbers to the left indicate approximate distance from bregma. *p < 0.05, **p < 0.01.
In contrast, there were main effects of epoch (F(1,10) = 8.87, p = 0.01) and group (F(1,10) = 9.39; p = 0.01) and an interaction of epoch and group (F(1,10) = 5.73; p = 0.04) for rats receiving 0.15 m NaCl. The interaction was mediated by a significant increase in dopamine concentration during the infusion period relative to baseline in sodium deplete rats (n = 6; 40.4 ± 8.2 vs 13.6 ± 2.0 nm; p = 0.02). Dopamine concentration during the infusion period relative to baseline in sodium replete rats receiving 0.15 m NaCl was unchanged (n = 6; 16.0 ± 2.8 vs 13. 1 ± 1.9 nm; p = 0.97; Fig. 3A,B). The sharp and sustained increase in dopamine concentration relative to baseline observed in sodium deplete rats replicates findings presented in Figure 1, albeit with a lower concentration of ingested NaCl to match the concentrations of other salts used in this experiment. Critically, there was also a main effect of epoch (F(1,9) = 16.22; p = 0.003) and an interaction between epoch and group (F(1,9) = 16.12; p = 0.003) for rats receiving 0.15 m LiCl. The interaction was mediated by a significant increase in dopamine concentration during the infusion period relative to baseline in sodium deplete rats (n = 5; 34.0 ± 6.6 vs 16.7 ± 3.9 nm; p = 0.002). Similar to NaCl, dopamine concentration during the infusion period relative to baseline in sodium replete rats receiving 0.15 m LiCl was unchanged (n = 6; 13.4 ± 3.5 vs 13.4 ± 2.2; p = 1.0; Fig. 3A,B). There were no differences in baseline dopamine concentration between sodium replete and sodium deplete rats that were infused with NaCl (p = 0.99) or LiCl (p = 0.94). Histology confirmed that all recordings from sodium replete and sodium deplete rats were made in the NAc shell (Fig. 3C).
To further explore state-taste interactions, Water-restricted rats were infused with 0.45 m NaCl (n = 5). Although this led to a modest increase in dopamine concentration relative to baseline, a Student's t test revealed that the difference was not significant (16. 9 ± 2.9 vs 6.8 ± 1.5 nm; p = 0.07). Histology confirmed that all recordings made from water-restricted rats infused with 0.45 m NaCl were made in the NAc shell.
Furosemide-induced sodium depletion increases c-fos expression within FoxP2 neurons of the pre-LC and PBel-inner
A subset of cells within the pre-LC and PBel-inner express the transcription factor FoxP2 and respond to chronic sodium deprivation with increases in c-Fos expression (Geerling et al., 2011). To investigate communication of these sodium-appetite sensing cells with mesolimbic circuitry, we first confirmed that acute, furosemide-induced, sodium depletion similarly increases neuronal activity of pre-LC and PBel-inner Foxp2 neurons. Expression of FoxP2 and c-Fos (“marker”) was observed in the pre-LC and PBel-inner of both sodium replete and sodium deplete rats (Table 1; Fig. 4A–C). Within the pre-LC, there were main effects of marker (F(1,6) = 205.75; p < 0.0001) and group (F(1,6) = 18.45; p = 0.005) and an interaction between marker and group (F(1,6) = 28.15; p = 0.002). Post hoc tests revealed no significant differences in the number of FoxP2 neurons in the pre-LC in sodium replete and sodium deplete rats (134.0 ± 6.5 vs 156.5 ± 17.2 neurons for sodium replete vs deplete rats, respectively; p = 0.44; Table 1; Fig. 4B). Sodium depletion did, however, cause an increase in c-Fos expression within the pre-LC [100.5 ± 7.7 vs 12.3 ± 3.5 neurons for sodium deplete vs replete rats, respectively; p = 0.0009; Table 1, c-Fos+ (total); Fig. 4B].
Within the PBel-inner, there were main effects of marker (F(1,6) = 202.57; p < 0.0001) and group (F(1,6) = 26.17, p = 0.002) but no interaction between marker and group (F(1,6) = 2.15; p = 0.19). Sodium deplete and sodium replete rats had comparable numbers of Foxp2 neurons in the PBel-inner (138.5 ± 13.7 vs 168.3 ± 7.8 neurons for sodium replete vs deplete rats, respectively; p = 0.10; Table 1; Fig. 4B), but sodium depletion caused an increase in c-Fos expression within the PBel-inner [61.5 ± 4.4 vs 7.3 ± 2.3 neurons for sodium deplete vs replete rats, respectively; p = 0.003; Table 1, c-Fos+ (total); Fig. 4B].
To determine whether sodium depletion changed the percentage of FoxP2 neurons (FoxP2+) that coexpressed c-Fos (FoxP2+/c-Fos+) in the pre-LC or PBel-inner, a two-way ANOVA was conducted. Main effects were found for region (F(1,6) = 114.63; p < 0.0001), group (F(1,6) = 162.04; p < 0.0001) and an interaction between region and group (F(1,6) = 78.74; p = 0.0001). Importantly, sodium depletion caused a significant increase in c-Fos within Foxp2 neurons of both the pre-LC (63.0 ± 3.1 vs 5.7 ± 2.1% for sodium deplete vs replete rats, respectively; p < 0.0001) and PBel-inner (35.4 ± 3.7 vs 3.1 ± 1.02% for sodium deplete vs replete rats, respectively; p = 0.0001; Fig. 4C). Consistent with previous reports (Geerling et al., 2011), almost all c-Fos-expressing neurons in the pre-LC (96.8 ± 0.9%) and PBel-inner (95.9 ± 1.5%) of sodium deplete animals were FoxP2+.
Furosemide-induced sodium depletion increases c-fos expression in FoxP2 neurons of the pre-LC and PBel-inner that project to the VTA
Excitability of the VTA represents one way to modulate NAc dopamine release (Sombers et al., 2009; Owesson-White et al., 2012). As pre-LC and PBel-inner Foxp2 neurons project directly to the VTA, we aimed to investigate sodium-appetite induced activation of these projections (Shin et al., 2011). The retrograde tracer FG was delivered iontophoretically to the VTA (Fig. 5G). Labeled cell bodies were observed in the pre-LC and PBel-inner of rats that were sacrificed in a sodium replete (n = 4) or sodium deplete (n = 3) state (Table 2; Fig. 5A–C). This finding is consistent with previous work identifying direct projections from these structures to the VTA (Shin et al., 2011). Expression of FoxP2 and c-Fos was also observed in the pre-LC and PBel-inner of both sodium replete and sodium deplete rats (Table 2; Fig. 5A–C). To compare the expression of FoxP2, c-Fos and FG (marker) between sodium deplete and sodium replete rats, two-way ANOVAs were conducted for each region of interest. Within the pre-LC, there were main effects of marker (F(1,5) = 84,37; p = 0.0002), group (F(1,5) = 18.88; p = 0.007), and an interaction between marker and group (F(1,5) = 25.97;p = 0.004). Main effects were mediated by a significant increase in the number of c-Fos cells within the pre-LC (142.0 ± 11.2 vs 8.3 ± 3.4 neurons for sodium deplete vs replete rats, respectively; p = 0.0001; Table 2; Fig. 5B). In contrast, the number of FoxP2 (153.8 ± 12.4 vs 192.0 ± 27.0 FoxP2 neurons for sodium replete vs deplete rats, respectively; p = 0.16; Table 2; Fig. 5B) and FG-labeled cells (68.0 ± 4.3 vs 85.0 ± 10.3 neurons for sodium replete vs deplete, respectively; p = 0.73; Table 2; Fig. 5B) within the pre-LC were not significantly different between sodium deplete and sodium replete rats. Comparing PBel-inner expression profiles of FoxP2, c-Fos and FG between sodium deplete and sodium replete rats, we found a main effect of marker (F(1,5) = 32.12; p = 0.001). The main effect was mediated by a significant increase in the number of c-Fos cells within the PBel-inner (69.7 ± 5.9 vs 10.8 ± 3.1 neurons for sodium deplete vs replete rats, respectively, p = 0.02; Table 2; Fig. 5C). In contrast, the number of FoxP2 (132.5 ± 22.0 vs 142.0 ± 19.5 neurons for sodium replete and deplete rats, respectively; p = 0.95; Table 2; Fig. 5C) and FG-labeled cells (48.8 ± 7.4 vs 45.0 ± 3.8 neurons for sodium replete vs deplete, respectively; p = 0.99; Table 2; Fig. 5C) within the PBel-inner did not significantly differ between sodium deplete and sodium replete rats.
A two-way ANOVA was conducted to analyze sodium depletion-induced differences in the percentage of FG-expressing neurons (FG+) that coexpress FoxP2 (FG+/FoxP2+) in either the pre-LC or PBel-inner. There were no main effects of region or group (p values > 0.05) and the percentages of FG and FoxP2 coexpressing cells in the pre-LC (67.2 ± 7.4 vs 86.4 ± 1.8% for sodium replete vs deplete rats, respectively; p = 0.63; Fig. 5D) and PBel-inner (50.0 ± 16.7 vs 61.7 ± 25.9% for sodium replete vs deplete rats, respectively; p = 0.84; Fig. 5D) were comparable.
A two-way ANOVA was conducted to determine whether sodium depletion changed the percentage of FoxP2 neurons (FoxP2+) that coexpressed c-Fos (FoxP2+/c-Fos+) in the pre-LC or PBel-inner. We found main effects for region (F(1,5) = 8.47; p = 0.03), group (F(1,5) = 281.81; p < 0.0001), and an interaction between region and group (F(1,5) = 12.02; p = 0.02). Importantly, sodium depletion caused a significant increase in c-Fos within Foxp2 neurons of both the pre-LC (71.7 ± 3.2 vs 3.61 ± 1.6% for sodium deplete vs replete rats, respectively; p < 0.0001) and PBel-inner (49.1 ± 7.1 vs 5.6 ± 0.9% for sodium deplete vs replete rats, respectively; p < 0.0001; Fig. 5E). These findings replicate what we observed above (Fig. 4) and, consistent with previous reports (Geerling et al., 2011), almost all c-Fos-expressing neurons of the pre-LC (95.4 ± 2.4%) and PBel-inner (97.3 ± 2.1%) of sodium deplete animals were FoxP2+. We extended these findings by analyzing the percentage of FG and FoxP2 colocalized neurons (FG+/FoxP2+) that express c-Fos (FG+/FoxP2+/c-Fos+) within both the pre-LC and PBel-inner. A two-way ANOVA revealed a main effect of group (F(1,5) = 412.25; p < 0.0001) but no effects of region (F(1,5) = 0.07; p = 0.8) nor an interaction between region and group (F(1,5) = 5.79; p = 0.06). Post hoc tests revealed that sodium depletion increases the percentage of FG and FoxP2 colocalized neurons that express c-Fos within both the pre-LC (88.6 ± 1.3 vs 6.8 ± 4.1% for sodium deplete vs replete rats, respectively; p < 0.0001) and PBel-inner (75.2 ± 0.2 vs 25.6 ± 5.9% for sodium deplete vs replete rats, respectively; p = 0.0006; Fig. 5F). Thus, VTA-projecting FoxP2+ neurons in the pre-LC and PBel-inner are activated following sodium deprivation.
Discussion
Motivated behaviors are aroused by homeostatic perturbation and are directed at physiologically required stimuli (Stellar and Stellar, 1985). Challenges to body fluid homeostasis are ideal for understanding the neural basis of motivation as sodium appetite and thirst prompt ingestion that is specifically directed at sodium or water, respectively. Although the neurotransmitter dopamine has long been studied in the context of motivation, it remains unclear how dopamine neurons are recruited by deprivation states and whether dopamine responses are stimulus selective. By generating the drive states of sodium appetite and thirst, we show that phasic dopamine responses to body fluid homeostasis-restoring stimuli are both state-dependent and taste-specific. We also provide support for a potential circuit by which body fluid homeostasis is relayed to mesolimbic circuitry. The mesolimbic system participates in: valence and value encoding and responses (Peciña et al., 2006; Hamid et al., 2016), conditioning and reinforcement (Tsai et al., 2009; Steinberg et al., 2013), reward seeking (Wassum et al., 2013; Fischbach-Weiss et al., 2018), and goal-directed behavior (Phillips et al., 2003; Roitman et al., 2004; du Hoffmann and Nicola, 2014). Collectively, these processes are thought to promote approach and consumption of nutrients based on “hedonics” whereas intake based on physiological need is thought to be driven by “homeostatic” (e.g., hypothalamic) circuitry (Tulloch et al., 2015). However, such dissociation of hedonic and homeostatic processes is challenged by the apparent integration of homeostatic perturbations by dopamine neurons. For example, food restriction enhances burst firing of dopamine neurons via postsynaptic mechanisms (Branch et al., 2013). Hunger and its hormonal proxies augment dopamine release in the NAc during feeding (Wilson et al., 1995) and in response to discrete food delivery (Cone et al., 2014). By directly (via hormone receptors on dopamine neurons; Liu and Borgland, 2015) or indirectly (via projections to the VTA from energy balance-relevant nuclei; Rossi and Stuber, 2018) monitoring changes in energy balance, the dopamine system is well positioned to reinforce approach and consumption in the service of homeostasis.
Similarly to hunger (Branch et al., 2013; Cone et al., 2014), evidence supports increased dopamine signaling by challenges to body fluid homeostasis. Sodium deprivation and related hormones decrease dopamine reuptake (Figlewicz et al., 1999; Roitman et al., 1999; Lucas et al., 2000), resulting in prolonged extracellular dopamine (Cragg and Rice, 2004; Sulzer et al., 2016). Additionally, dopamine production and release may be increased by sodium depletion-associated hormonal manipulations (Grafe and Flanagan-Cato, 2016). However, studies which directly measure the effects of sodium depletion on dopamine signaling dynamics are limited (Cone et al., 2016). Moreover, the role of phasic dopamine signaling in thirst is unknown. By pairing FSCV with intraoral taste infusions, we directly compared the state-dependency of dopamine release patterns in the NAc shell during the sensory experience of salt or water ingestion in states of fluid balance, thirst and sodium appetite. Only under the conditions of sodium depletion and water restriction do NaCl and water stimuli, respectively, evoke increases in dopamine concentration (Figs. 1, 2), highlighting the influence of physiological state over the processing of sensory stimuli by the dopamine system.
In addition to being prompted by homeostatic challenge, motivated behaviors are directed specifically at stimuli which satisfy physiological need. The taste system has evolved to permit sensory identification and discrimination. We hypothesized that the taste of NaCl or water is selectively reinforced during sodium appetite and thirst and expected phasic dopamine responses to be tuned to taste qualities of the presented ingesta. Gustatory processing occurs first in the oral cavity (Spector et al., 1996; Chandrashekar et al., 2006), and, as demonstrated here, discrimination of taste stimuli is maintained by mesolimbic circuitry. Under sodium deplete conditions, intraoral NaCl, but not KCl or water, elicits an increase in dopamine concentration from baseline within the NAc shell (Fig. 3). The taste transduction mechanism for the detection of NaCl involves amiloride-sensitive epithelial sodium ion channels, which are also permeable to LiCl (Spector et al., 1996; Kellenberger et al., 1999). As a result, rats that are chronically (Nachman, 1962) or acutely (demonstrated here) sodium deplete fail to discriminate between LiCl and NaCl. Furthermore, intraoral LiCl infusion evokes phasic dopamine responses similar to those evoked by NaCl (Fig. 3). Under conditions of thirst, only water significantly augments phasic dopamine signaling. The mechanism for stimulus-specificity of dopamine responses to water following thirst is less clear than the sodium specificity following sodium appetite. However, there is evidence to suggest that water is a gustatory stimulus that drives water-specific drinking responses (Rosen et al., 2010; Zocchi et al., 2017). Future work is required to determine how lingual identification of water accesses the mesolimbic system.
Peripheral mechanisms exist to sense and respond to changes in sodium and water balance. Homeostatic imbalances trigger hormonal cascades to mediate the conservation, excretion and intake of sodium or water (Fitzsimons, 1972; Schulkin, 1992; Leib et al., 2016). However, the central circuits by which body fluid regulatory hormones influence the mesolimbic system to gate dopamine responses are unknown. Our studies support a circuit by which NAc dopamine release is modulated by aldosterone signaling. During sodium deprivation, hindbrain 11β-hydroxysteroid dehydrogenase 2-expressing (HSD2) neurons are activated by increases in circulating aldosterone (Geerling et al., 2006). Activation of these neurons is necessary for the induction of a sodium appetite (Jarvie and Palmiter, 2017; Resch et al., 2017). HSD2 neurons project to FoxP2-expressing neurons of the pre-LC and PBel-inner (Geerling et al., 2011), which in turn, project to the VTA (Shin et al., 2011). It remains possible, however, that aldosterone modulates dopamine release through alternative circuits (Geerling and Loewy, 2006; Shekhtman et al., 2007; Shin et al., 2011) or through direct action on dopamine neurons (Roitman et al., 1999). Additionally, aldosterone signaling is one of many hormonal contributors to the expression of a sodium appetite. It is likely that angiotensin-II, atrial natriuretic peptide, vasopressin and oxytocin also influence dopamine release through direct and/or circuit-level mechanisms (Stellar, 1993, Xiao et al., 2017).
Dietary (Geerling et al., 2011) and acute pharmacological induction of sodium deprivation (Figs. 4, 5) increases activity of FoxP2-expressing pre-LC and PBel-inner neurons. Here, we show that the activity of VTA-projecting FoxP2 neurons of both the pre-LC and PBel-inner is modulated by sodium depletion (Fig. 5). Thus, demonstrated projections from these pontine nuclei to the VTA may contribute to the state-dependency of dopamine signaling during sodium appetite by increasing the excitability of the VTA and thereby facilitating dopamine release evoked by the taste of sodium. It is also possible that sodium deprivation-responsive neurons of the pre-LC and PBel-inner modulate dopamine release through a multisynaptic projection that targets NAc dopamine terminals (Shekhtman et al., 2007), although a direct projection from pre-LC or PBel-inner FoxP2 neurons is not likely (Shin et al., 2011). Projections to the VTA or NAc from other nuclei that respond to sodium deficit (i.e., BNST; Resch et al., 2017) remain unexplored, as are the potential sites that modulate dopamine responses to water during thirst (i.e., SFO; Matsuda et al., 2017). The ability of HSD2 projections, directly or through pontine relay nuclei, to alter dopamine neuron excitability, dopamine release, and arouse motivated behavior remains to be tested. While causal studies combining FSCV with optogenetic and chemogenetic approaches are necessary, our work highlights the pre-LC and PBel-inner as candidate nuclei for relaying physiological state to mesolimbic circuitry. The sites which relay taste information to the VTA should also be investigated. Nuclei of the ventral taste pathway have been implicated in the gustatory processing of sodium (Wolf and Quartermain, 1967; Cox et al., 1978; Grill et al., 1986) but the mechanism by which taste stimuli, and specifically sodium, evokes phasic dopamine responses is unknown.
Recent studies have suggested that synchronous activation of VTA dopamine neurons, rather than promoting intake of nutritive stimuli, actually disrupt it. Indeed, prolonged, tonic-like (5 Hz) stimulation of VTA dopamine neurons selectively suppresses sucrose consumption (Mikhailova et al., 2016). Chemogenetic activation of VTA dopamine neurons reduced feeding and increased locomotion (Boekhoudt et al., 2017). Finally, phasic, optogenetic activation of VTA dopamine neurons reduced both sodium appetite and sucrose consumption (Sandhu et al., 2018). These findings challenge the current dataset. However, it is possible that less discriminate, synchronous recruitment of dopamine neurons might cloud a more selective signal that arises from the interaction between a deprivation state and the taste of the needed stimulus.
Survival requires tight control of many physiological processes, which give rise to diverse and distinct adaptive behaviors. Furthermore, the environment includes a wide variety of biologically-required stimuli. Competing drive states must be prioritized to support the approach and consumption of a highly selective subset of stimuli, given the current physiological state (Conover and Shizgal, 1994; Conover et al., 1994; Madsen and Ahmed, 2015). It is therefore imperative that the neural substrates of reinforcement are sensitive to both biological need and identifying properties of environmental stimuli. As phasic dopamine signaling in the NAc is sufficient for positive reinforcement (Steinberg et al., 2013), the state and taste specific phasic dopamine signals observed here likely participate in promoting the continued consumption of homeostasis-restoring stimuli.
Footnotes
This work was supported by the National Institutes of Health Grant R01-DA025634 (M.F.R.) and the University of Illinois at Chicago Dean's Scholar Fellowship (S.M.F.). We thank Dr. Jackson Cone, Dr. James Maniscalco, Vaibhav Konanur, and Clinton Liang for assistance with these experiments.
The authors declare no competing financial interests.
References
- Berridge KC, Flynn FW, Schulkin J, Grill HJ (1984) Sodium depletion enhances salt palatability in rats. Behav Neurosci 98:652–660. 10.1037/0735-7044.98.4.652 [DOI] [PubMed] [Google Scholar]
- Boekhoudt L, Roelofs TJM, de Jong JW, de Leeuw AE, Luijendijk MCM, Wolterink-Donselaar IG, van der Plasse G, Adan RAH (2017) Does activation of midbrain dopamine neurons promote or reduce feeding? Int J Obes (Lond) 41:1131–1140. 10.1038/ijo.2017.74 [DOI] [PubMed] [Google Scholar]
- Branch SY, Goertz RB, Sharpe AL, Pierce J, Roy S, Ko D, Paladini CA, Beckstead MJ (2013) Food restriction increases glutamate receptor-mediated burst firing of dopamine neurons. J Neurosci 33:13861–13872. 10.1523/JNEUROSCI.5099-12.2013 [DOI] [PMC free article] [PubMed] [Google Scholar]
- Breslin PA, Spector AC, Grill HJ (1993) Chorda tympani section decreases the cation specificity of depletion-induced sodium appetite in rats. Am J Physiol 264:R319–R323. 10.1152/ajpregu.1993.264.2.R319 [DOI] [PubMed] [Google Scholar]
- Carelli RM. (2004) Nucleus accumbens cell firing and rapid dopamine signaling during goal-directed behaviors in rats. Neuropharmacology 47:180–189. 10.1016/j.neuropharm.2004.07.017 [DOI] [PubMed] [Google Scholar]
- Chandrashekar J, Hoon MA, Ryba NJ, Zuker CS (2006) The receptors and cells for mammalian taste. Nature 444:288–294. 10.1038/nature05401 [DOI] [PubMed] [Google Scholar]
- Chang SE, Smedley EB, Stansfield KJ, Stott JJ, Smith KS (2017) Optogenetic inhibition of ventral pallidum neurons impairs context-driven salt seeking. J Neurosci 37:5670–5680. 10.1523/JNEUROSCI.2968-16.2017 [DOI] [PMC free article] [PubMed] [Google Scholar]
- Clark JJ, Bernstein IL (2006) Sensitization of salt appetite is associated with increased “wanting” but not “liking” of a salt reward in the sodium-deplete rat. Behav Neurosci 120:206–210. 10.1037/0735-7044.120.1.206 [DOI] [PubMed] [Google Scholar]
- Cone JJ, McCutcheon JE, Roitman MF (2014) Ghrelin acts as an interface between physiological state and phasic dopamine signaling. J Neurosci 34:4905–4913. 10.1523/JNEUROSCI.4404-13.2014 [DOI] [PMC free article] [PubMed] [Google Scholar]
- Cone JJ, Fortin SM, McHenry JA, Stuber GD, McCutcheon JE, Roitman MF (2016) Physiological state gates acquisition and expression of mesolimbic reward prediction signals. Proc Natl Acad Sci U S A 113:1943–1948. 10.1073/pnas.1519643113 [DOI] [PMC free article] [PubMed] [Google Scholar]
- Conover KL, Shizgal P (1994) Competition and summation between rewarding effects of sucrose and lateral hypothalamic stimulation in the rat. Behav Neurosci 108:537–548. 10.1037/0735-7044.108.3.537 [DOI] [PubMed] [Google Scholar]
- Conover KL, Woodside B, Shizgal P (1994) Effects of sodium depletion on competition and summation between rewarding effects of salt and lateral hypothalamic stimulation in the rat. Behav Neurosci 108:549–558. 10.1037/0735-7044.108.3.549 [DOI] [PubMed] [Google Scholar]
- Cox JR, Cruz CE, Ruger J (1978) Effect of total amygdalectomy upon regulation of salt intake in rats. Brain Res Bull 3:431–435. 10.1016/0361-9230(78)90071-0 [DOI] [PubMed] [Google Scholar]
- Cragg SJ, Rice ME (2004) DAncing past the DAT at a DA synapse. Trends Neurosci 27:270–277. 10.1016/j.tins.2004.03.011 [DOI] [PubMed] [Google Scholar]
- du Hoffmann J, Nicola SM (2014) Dopamine invigorates reward seeking by promoting cue-evoked excitation in the nucleus accumbens. J Neurosci 34:14349–14364. 10.1523/JNEUROSCI.3492-14.2014 [DOI] [PMC free article] [PubMed] [Google Scholar]
- Epstein AN, Stellar E (1955) The control of salt preference in the adrenalectomized rat. J Comp Physiol Psychol 48:167–172. 10.1037/h0045626 [DOI] [PubMed] [Google Scholar]
- Figlewicz DP, Patterson TA, Zavosh A, Brot MD, Roitman M, Szot P (1999) Neurotransmitter transporters: target for endocrine regulation. Horm Metab Res 31:335–339. 10.1055/s-2007-978749 [DOI] [PubMed] [Google Scholar]
- Fischbach-Weiss S, Reese RM, Janak PH (2018) Inhibiting mesolimbic dopamine neurons reduces the initiation and maintenance of instrumental responding. Neuroscience 372:306–315. 10.1016/j.neuroscience.2017.12.003 [DOI] [PMC free article] [PubMed] [Google Scholar]
- Fitzsimons JT. (1972) Thirst. Physiol Rev 52:468–561. 10.1152/physrev.1972.52.2.468 [DOI] [PubMed] [Google Scholar]
- Fitzsimons JT. (1998) Angiotensin, thirst, and sodium appetite. Physiol Rev 78:583–686. 10.1152/physrev.1998.78.3.583 [DOI] [PubMed] [Google Scholar]
- Fortin SM, Cone JJ, Ng-Evans S, McCutcheon JE, Roitman MF (2015) Sampling phasic dopamine signaling with fast-scan cyclic voltammetry in awake, behaving rats. Curr Protoc Neurosci 70:7.25.1–7.25.20. 10.1002/0471142301.ns0725s70 [DOI] [PMC free article] [PubMed] [Google Scholar]
- Geerling JC, Loewy AD (2006) Aldosterone-sensitive neurons in the nucleus of the solitary: efferent projections. J Comp Neurol 498:223–250. [PubMed] [Google Scholar]
- Geerling JC, Kawata M, Loewy AD (2006) Aldosterone-sensitive neurons in the rat central nervous system. J Comp Neurol 494:515–527. 10.1002/cne.20808 [DOI] [PubMed] [Google Scholar]
- Geerling JC, Stein MK, Miller RL, Shin JW, Gray PA, Loewy AD (2011) FoxP2 expression defines dorsolateral pontine neurons activated by sodium deprivation. Brain Res 1375:19–27. 10.1016/j.brainres.2010.11.028 [DOI] [PMC free article] [PubMed] [Google Scholar]
- Grafe LA, Flanagan-Cato LM (2016) Differential effects of mineralocorticoid and angiotensin II on incentive and mesolimbic activity. Horm Behav 79:28–36. 10.1016/j.yhbeh.2015.12.002 [DOI] [PMC free article] [PubMed] [Google Scholar]
- Grill HJ, Norgren R (1978) The taste reactivity test: I. mimetic responses to gustatory stimuli in neurologically normal rats. Brain Res 143:263–279. 10.1016/0006-8993(78)90568-1 [DOI] [PubMed] [Google Scholar]
- Grill HJ, Schulkin J, Flynn FW (1986) Sodium homeostasis in chronic decerebrate rats. Behav Neurosci 100:536–543. 10.1037/0735-7044.100.4.536 [DOI] [PubMed] [Google Scholar]
- Groenewegen HJ, Wright CI, Beijer AV, Voorn P (1999) Convergence and segregation of ventral striatal inputs and outputs. Ann N Y Acad Sci 877:49–63. 10.1111/j.1749-6632.1999.tb09260.x [DOI] [PubMed] [Google Scholar]
- Hamid AA, Pettibone JR, Mabrouk OS, Hetrick VL, Schmidt R, Vander Weele CM, Kennedy RT, Aragona BJ, Berke JD (2016) Mesolimbic dopamine signals the value of work. Nat Neurosci 19:117–126. 10.1038/nn.4173 [DOI] [PMC free article] [PubMed] [Google Scholar]
- Handal PJ. (1965) Immediate acceptance of sodium salts by sodium deficient rats. Psychon Sci 3:315–316. 10.3758/BF03343156 [DOI] [Google Scholar]
- Heien ML, Johnson MA, Wightman RM (2004) Resolving neurotransmitters detected by fast-scan cyclic voltammetry. Anal Chem 76:5697–5704. 10.1021/ac0491509 [DOI] [PubMed] [Google Scholar]
- Jarvie BC, Palmiter RD (2017) HSD2 neurons in the hindbrain drive sodium appetite. Nat Neurosci 20:167–169. 10.1038/nn.4451 [DOI] [PubMed] [Google Scholar]
- Kellenberger S, Gautschi I, Schild L (1999) A single point mutation in the pore region of the epithelial Na+ channel changes ion selectivity by modifying molecular sieving. Proc Natl Acad Sci U S A 96:4170–4175. 10.1073/pnas.96.7.4170 [DOI] [PMC free article] [PubMed] [Google Scholar]
- Kelley AE. (2004) Ventral striatal control of appetitive motivation: role in ingestive behavior and reward-related learning. Neurosci Biobehav Rev 27:765–776. 10.1016/j.neubiorev.2003.11.015 [DOI] [PubMed] [Google Scholar]
- Leib DE, Zimmerman CA, Knight ZA (2016) Thirst. Curr Biol 26:R1260–R1265. 10.1016/j.cub.2016.11.019 [DOI] [PMC free article] [PubMed] [Google Scholar]
- Liu S, Borgland SL (2015) Regulation of the mesolimbic dopamine circuit by feeding peptides. Neuroscience 289:19–42. 10.1016/j.neuroscience.2014.12.046 [DOI] [PubMed] [Google Scholar]
- Loriaux AL, Roitman JD, Roitman MF (2011) Nucleus accumbens shell, but not core, tracks motivational value of salt. J Neurophysiol 106:1537–1544. 10.1152/jn.00153.2011 [DOI] [PMC free article] [PubMed] [Google Scholar]
- Lucas LR, Pompei P, McEwen BS (2000) Salt appetite in salt-replete rats: involvement of mesolimbic structures in deoxycorticosterone-induced salt craving behavior. Neuroendocrinology 71:386–395. 10.1159/000054559 [DOI] [PubMed] [Google Scholar]
- Madsen HB, Ahmed SH (2015) Drug versus sweet reward: greater attraction to and preference for sweet versus drug cues. Addict Biol 20:433–444. 10.1111/adb.12134 [DOI] [PubMed] [Google Scholar]
- Mahler SV, Smith KS, Berridge KC (2007) Endocannabinoid hedonic hotspot for sensory pleasure: anandamide in nucleus accumbens shell enhances “liking” of a sweet reward. Neuropsychopharmacology 32:2267–2278. 10.1038/sj.npp.1301376 [DOI] [PubMed] [Google Scholar]
- Matsuda T, Hiyama TY, Niimura F, Matsusaka T, Fukamizu A, Kobayashi K, Kobayashi K, Noda M (2017) Distinct neural mechanisms for the control of thirst and salt appetite in the subfornical organ. Nat Neurosci 20:230–241. 10.1038/nn.4463 [DOI] [PubMed] [Google Scholar]
- Meredith GE, Baldo BA, Andrezjewski ME, Kelley AE (2008) The structural basis for mapping behavior onto the ventral striatum and its subdivisions. Brain Struct Funct 213:17–27. 10.1007/s00429-008-0175-3 [DOI] [PMC free article] [PubMed] [Google Scholar]
- Mikhailova MA, Bass CE, Grinevich VP, Chappell AM, Deal AL, Bonin KD, Weiner JL, Gainetdinov RR, Budygin EA (2016) Optogenetically-induced tonic dopamine release from VTA-nucleus accumbens projections inhibits reward consummatory behaviors. Neuroscience 333:54–64. 10.1016/j.neuroscience.2016.07.006 [DOI] [PMC free article] [PubMed] [Google Scholar]
- Mogenson GJ, Jones DL, Yim CY (1980) From motivation to action: functional interface between the limbic system and the motor system. Prog Neurobiol 14:69–97. 10.1016/0301-0082(80)90018-0 [DOI] [PubMed] [Google Scholar]
- Nachman M. (1962) Taste preferences for sodium salts by adrenalectomized rats. J Comp Physiol Psychol 55:1124–1129. 10.1037/h0041348 [DOI] [PubMed] [Google Scholar]
- Nicola SM, Surmeier J, Malenka RC (2000) Dopaminergic modulation of neuronal excitability in the striatum and nucleus accumbens. Annu Rev Neurosci 23:185–215. 10.1146/annurev.neuro.23.1.185 [DOI] [PubMed] [Google Scholar]
- Owesson-White CA, Roitman MF, Sombers LA, Belle AM, Keithley RB, Peele JL, Carelli RM, Wightman RM (2012) Sources contributing to the average extracellular concentration of dopamine in the nucleus accumbens. J Neurochem 121:252–262. 10.1111/j.1471-4159.2012.07677.x [DOI] [PMC free article] [PubMed] [Google Scholar]
- Paxinos G, Watson C (2007) The rat brain in stereotaxic coordinates. London, UK: Elsevier Academic. [DOI] [PubMed] [Google Scholar]
- Peciña S, Berridge KC (2000) Opioid site in nucleus accumbens shell mediates eating and hedonic “liking” for food: map based on microinjection fos plumes. Brain Res 863:71–86. 10.1016/S0006-8993(00)02102-8 [DOI] [PubMed] [Google Scholar]
- Peciña S, Smith KS, Berridge KC (2006) Hedonic hot spots in the brain. Neuroscientist 12:500–511. 10.1177/1073858406293154 [DOI] [PubMed] [Google Scholar]
- Phillips PE, Stuber GD, Heien ML, Wightman RM, Carelli RM (2003) Subsecond dopamine release promotes cocaine seeking. Nature 422:614–618. 10.1038/nature01476 [DOI] [PubMed] [Google Scholar]
- Quartermain D, Miller NE, Wolf G (1967) Role of experience in relationship between sodium deficiency and rate of bar pressing for salt. J Comp Physiol Psychol 63:417–420. 10.1037/h0024611 [DOI] [PubMed] [Google Scholar]
- Resch JM, Fenselau H, Madara JC, Wu C, Campbell JN, Lyubetskaya A, Dawes BA, Tsai LT, Li MM, Livneh Y, Ke Q, Kang PM, Fejes-Tóth G, Náray-Fejes-Tóth A, Geerling JC, Lowell BB (2017) Aldosterone-sensing neurons in the NTS exhibit state-dependent pacemaker activity and drive sodium appetite via synergy with angiotensin II signaling. Neuron 96:190–206.e7. 10.1016/j.neuron.2017.09.014 [DOI] [PMC free article] [PubMed] [Google Scholar]
- Richter CP. (1936) Increased salt appetite in adrenalectomized rats. Am J Physiol 115:155–161. 10.1152/ajplegacy.1936.115.1.155 [DOI] [Google Scholar]
- Robinson MJ, Berridge KC (2013) Instant transformation of learned repulsion into motivational “wanting”. Curr Biol 23:282–289. 10.1016/j.cub.2013.01.016 [DOI] [PMC free article] [PubMed] [Google Scholar]
- Roitman MF, Patterson TA, Sakai RR, Bernstein IL, Figlewicz DP (1999) Sodium depletion and aldosterone decrease dopamine transporter activity in nucleus accumbens but not striatum. Am J Physiol 276:R1339–R1345. [DOI] [PubMed] [Google Scholar]
- Roitman MF, Stuber GD, Phillips PE, Wightman RM, Carelli RM (2004) Dopamine operates as a subsecond modulator of food seeking. J Neurosci 24:1265–1271. 10.1523/JNEUROSCI.3823-03.2004 [DOI] [PMC free article] [PubMed] [Google Scholar]
- Roitman MF, Wheeler RA, Carelli RM (2005) Nucleus accumbens neurons are innately tuned for rewarding and aversive taste stimuli, encode their predictors, and are linked to motor output. Neuron 45:587–597. 10.1016/j.neuron.2004.12.055 [DOI] [PubMed] [Google Scholar]
- Roitman MF, Wheeler RA, Wightman RM, Carelli RM (2008) Real-time chemical responses in the nucleus accumbens differentiate rewarding and aversive stimuli. Nat Neurosci 11:1376–1377. 10.1038/nn.2219 [DOI] [PMC free article] [PubMed] [Google Scholar]
- Rosen AM, Roussin AT, Di Lorenzo PM (2010) Water as an independent taste modality. Front Neurosci 4:175. 10.3389/fnins.2010.00175 [DOI] [PMC free article] [PubMed] [Google Scholar]
- Rossi MA, Stuber GD (2018) Overlapping brain circuits for homeostatic and hedonic feeding. Cell Metab 27:42–56. 10.1016/j.cmet.2017.09.021 [DOI] [PMC free article] [PubMed] [Google Scholar]
- Sandhu EC, Fernando ABP, Irvine EE, Tossell K, Kokkinou M, Glegola J, Smith MA, Howes OD, Withers DJ, Ungless MA (2018) Phasic stimulation of midbrain dopamine neuron activity reduces salt consumption. eNeuro 5:ENEURO.0064–18.2018. 10.1523/ENEURO.0064-18.2018 [DOI] [PMC free article] [PubMed] [Google Scholar]
- Schulkin J. (1992) Sodium hunger: the search for a salty taste, Ed 1 New York, NY: Cambridge UP. [Google Scholar]
- Schultz W, Dayan P, Montague PR (1997) A neural substrate of prediction and reward. Science 275:1593–1599. 10.1126/science.275.5306.1593 [DOI] [PubMed] [Google Scholar]
- Shekhtman E, Geerling JC, Loewy AD (2007) Aldosterone-sensitive neurons of the nucleus of the solitary tract: multisynaptic pathway to the nucleus accumbens. J Comp Neurol 501:274–289. 10.1002/cne.21245 [DOI] [PubMed] [Google Scholar]
- Shin JW, Geerling JC, Stein MK, Miller RL, Loewy AD (2011) FoxP2 brainstem neurons project to sodium appetite regulatory sites. J Chem Neuroanat 42:1–23. 10.1016/j.jchemneu.2011.05.003 [DOI] [PMC free article] [PubMed] [Google Scholar]
- Sinkala E, McCutcheon JE, Schuck MJ, Schmidt E, Roitman MF, Eddington DT (2012) Electrode calibration with a microfluidic flow cell for fast-scan cyclic voltammetry. Lab Chip 12:2403–2408. 10.1039/c2lc40168a [DOI] [PMC free article] [PubMed] [Google Scholar]
- Smith KS, Berridge KC (2007) Opioid limbic circuit for reward: interaction between hedonic hotspots of nucleus accumbens and ventral pallidum. J Neurosci 27:1594–1605. 10.1523/JNEUROSCI.4205-06.2007 [DOI] [PMC free article] [PubMed] [Google Scholar]
- Sombers LA, Beyene M, Carelli RM, Wightman RM (2009) Synaptic overflow of dopamine in the nucleus accumbens arises from neuronal activity in the ventral tegmental area. J Neurosci 29:1735–1742. 10.1523/JNEUROSCI.5562-08.2009 [DOI] [PMC free article] [PubMed] [Google Scholar]
- Spector AC, Guagliardo NA, St John SJ (1996) Amiloride disrupts NaCl versus KCl discrimination performance: implications for salt taste coding in rats. J Neurosci 16:8115–8122. 10.1523/JNEUROSCI.16-24-08115.1996 [DOI] [PMC free article] [PubMed] [Google Scholar]
- Steinberg EE, Keiflin R, Boivin JR, Witten IB, Deisseroth K, Janak PH (2013) A causal link between prediction errors, dopamine neurons and learning. Nat Neurosci 16:966–973. 10.1038/nn.3413 [DOI] [PMC free article] [PubMed] [Google Scholar]
- Steinberg EE, Boivin JR, Saunders BT, Witten IB, Deisseroth K, Janak PH (2014) Positive reinforcement mediated by midbrain dopamine neurons requires D1 and D2 receptor activation in the nucleus accumbens. PLoS One 9:e94771. 10.1371/journal.pone.0094771 [DOI] [PMC free article] [PubMed] [Google Scholar]
- Stellar E. (1993) Salt appetite: its neuroendocrine basis. Acta Neurobiol Exp (Wars) 53:475–484. [PubMed] [Google Scholar]
- Stellar JR, Stellar E (1985) The neurobiology of motivation and reward. New York, NY: Springer. [Google Scholar]
- Sulzer D, Cragg SJ, Rice ME (2016) Striatal dopamine neurotransmission: regulation of release and uptake. Basal Ganglia 6:123–148. 10.1016/j.baga.2016.02.001 [DOI] [PMC free article] [PubMed] [Google Scholar]
- Surmeier DJ, Carrillo-Reid L, Bargas J (2011) Dopaminergic modulation of striatal neurons, circuits, and assemblies. Neuroscience 198:3–18. 10.1016/j.neuroscience.2011.08.051 [DOI] [PMC free article] [PubMed] [Google Scholar]
- Thornton SN, Norgren R (2016) The neurobiology of thirst and sodium appetite. In: Neuroscience in the 21st Century, pp 1–22. New York, NY: Springer. [Google Scholar]
- Tsai HC, Zhang F, Adamantidis A, Stuber GD, Bonci A, de Lecea L, Deisseroth K (2009) Phasic firing in dopaminergic neurons is sufficient for behavioral conditioning. Science 324:1080–1084. 10.1126/science.1168878 [DOI] [PMC free article] [PubMed] [Google Scholar]
- Tulloch AJ, Murray S, Vaicekonyte R, Avena NM (2015) Neural responses to macronutrients: hedonic and homeostatic mechanisms. Gastroenterology 148:1205–1218. 10.1053/j.gastro.2014.12.058 [DOI] [PubMed] [Google Scholar]
- Wagman W. (1963) Sodium chloride deprivation: development of sodium chloride as a reinforcement. Science 140:1403–1404. 10.1126/science.140.3574.1403 [DOI] [PubMed] [Google Scholar]
- Wassum KM, Ostlund SB, Loewinger GC, Maidment NT (2013) Phasic mesolimbic dopamine release tracks reward seeking during expression of Pavlovian-to-instrumental transfer. Biol Psychiatry 73:747–755. 10.1016/j.biopsych.2012.12.005 [DOI] [PMC free article] [PubMed] [Google Scholar]
- Wilson C, Nomikos GG, Collu M, Fibiger HC (1995) Dopaminergic correlates of motivated behavior: importance of drive. J Neurosci 15:5169–5178. 10.1523/JNEUROSCI.15-07-05169.1995 [DOI] [PMC free article] [PubMed] [Google Scholar]
- Wolf G, Quartermain D (1967) Sodium chloride intake of adrenalectomized rats with lateral hypothalamic lesions. Am J Physiol 212:113–118. 10.1152/ajplegacy.1967.212.1.113 [DOI] [PubMed] [Google Scholar]
- Xiao L, Priest MF, Nasenbeny J, Lu T, Kozorovitskiy Y (2017) Biased oxytocinergic modulation of midbrain dopamine systems. Neuron 95:368–384.e5. 10.1016/j.neuron.2017.06.003 [DOI] [PMC free article] [PubMed] [Google Scholar]
- Zhang DM, Stellar E, Epstein AN (1984) Together intracranial angiotensin and systemic mineralocorticoid produce avidity for salt in the rat. Physiol Behav 32:677–681. 10.1016/0031-9384(84)90325-1 [DOI] [PubMed] [Google Scholar]
- Zocchi D, Wennemuth G, Oka Y (2017) The cellular mechanism for water detection in the mammalian taste system. Nat Neurosci 20:927–933. 10.1038/nn.4575 [DOI] [PubMed] [Google Scholar]