Abstract
Actinosynnema pretiosum ATCC 31280 is the producer of antitumor agent ansamitocin P-3 (AP-3). Understanding of the AP-3 biosynthetic pathway and the whole metabolic network in A. pretiosum is important for the improvement of AP-3 titer. In this study, we reconstructed the first complete Genome-Scale Metabolic Model (GSMM) Aspm1282 for A. pretiosum ATCC 31280 based on the newly sequenced genome, with 87% reactions having definite functional annotation. The model has been validated by effectively predicting growth and the key genes for AP-3 biosynthesis. Then we built condition-specific models for an AP-3 high-yield mutant NXJ-24 by integrating Aspm1282 model with time-course transcriptome data. The changes of flux distribution reflect the metabolic shift from growth-related pathway to secondary metabolism pathway since the second day of cultivation. The AP-3 and methionine metabolisms were both enriched in active flux for the last two days, which uncovered the relationships among cell growth, activation of methionine metabolism, and the biosynthesis of AP-3. Furthermore, we identified four combinatorial gene modifications for overproducing AP-3 by in silico strain design, which improved the theoretical flux of AP-3 biosynthesis from 0.201 to 0.372 mmol/gDW/h. Upregulation of methionine metabolic pathway is a potential strategy to improve the production of AP-3.
Keywords: Actinosynnema pretiosum ATCC 31280, genome-scale metabolic model, ansamitocin P-3, methionine metabolism, metabolic shift
1. Introduction
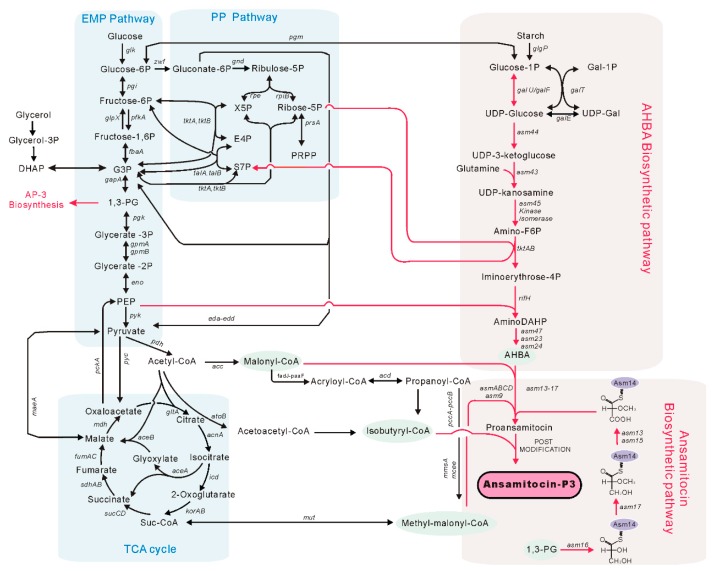
Actinosynnema pretiosum ATCC 31280 was isolated in 1977 [1] and is known as the producer of ansamitocins [2]. Ansamitocins are a series of complex polyketide compounds [3], among which ansamitocin P-3 (AP-3) was confirmed to be the most potent antitumor agent [4,5]. Recently, AP-3 has been used as the payload in many antibody-drug conjugants, such as trastuzumab emtansine, which was approved by the FDA for breast cancer treatment [6]. Although the antitumor activity of AP-3 is highly effective, the commercial application of AP-3 is substantially limited by its low production titer [7]. Therefore, in the past decades, many efforts have been made to improve the production of AP-3 [8,9,10]. These strategies includes mutant screening, medium optimization, and genetic engineering. However, the titer of AP-3 is still far from ideal. The reason for limited success in the improvement of AP-3 titer is probably due to a less understanding of the AP-3 biosynthetic pathway, which involves multiple metabolic pathways (Figure 1) and the whole metabolic network in A. pretiosum [11].
Figure 1.
Biosynthetic pathway of ansamitocin P-3 in Actinosynnema pretiosum. AP-3: ansamitocin P-3; EMP pathway: Embden Meyerhof Parnas pathway; PP pathway: pentose phosphate pathway; G3P: glyceraldehyde 3-phosphate; PEP: phosphoenolpyruvate; DHAP: dihydroxyacetone phosphate; X5P: D-xylulose 5-phosphate; UDP: uridine diphosphate; Gal: alpha-d-Galactose; E4P: erythrose 4-phosphate; S7P: sedoheptulose 7-phosphate; PRPP: 5-phosphoribosyl 1-pyrophosphate; AHBA: 3-amino-5-hydroxybenzoic acid; F6P: fructose-6-phosphate; TCA cycle: tricarboxylic acid cycle.
Genome-Scale Metabolic Models (GSMMs) play important roles in systems biology [12,13], which aim at understanding complex interactions between genes, proteins, and metabolites by integrating and modeling multiple data sources [14]. GSMMs can predict the theoretical maximum production of a particular compound and simulate the effects of genetic modification on growth and target compound production, which provides links between genotype and phenotype of an organism [15,16]. GSMMs have been widely used in studies of overproducing target products. For example, using Esterichia coli GSMM iJR904 [17], Choi et al. found that microaerobic condition was more efficient than aerobic condition in achieving higher titer of 4-hybroxybutyric acid in E. coli. The yield of 4-hybroxybutyric acid was increased from 35.2 g/L to 103.4 g/L [18]. Kuhn Ip et al. used GSMM iJO1366 [19] to explore the genetic manipulation strategies for overproducing fatty acids in E. coli, resulting in a 5.4-fold increase by the knockout of gene fadE [20]. Brochado A.R. et al. achieved a five-fold increase in vanillin production in baker’s yeast by the overexpression of O-methyltransferase based on genome-scale modeling approach [21]. Wu et al. increased acarbose production by 78% in Actinoplanes ssp. SE50/110 based on the predicted genetic modification strategies [22].
In this study, we reconstructed and validated the first GSMM of A. pretiosum ATCC 31280 based on the newly sequenced genome (Genebank accession number: CP029607). Then we integrated the model with time-course transcriptome data of a high-yield mutant strain NXJ-24 [23] to investigate the change of metabolic flux distribution during the fermentation process. Furthermore, potential strategies for improving AP-3 production were predicted by in silico strain design based on the established model.
2. Materials and Methods
2.1. Reconstruction of the Genome-Scale Model of Actinosynnema pretiosum ATCC 31280
The genome-scale metabolic model of A. pretiosum ATCC 31280 was reconstructed based on the newly sequenced genome, by a complicated process of annotation, transformation, gap filling, and refinement. Genome annotation was performed through RAST server [24], and then the draft model was reconstructed by ModelSEED [25] with the annotation. Public databases, such as KEGG, were used to manually refine the draft model, including addition of specific reactions, such as biosynthetic reactions for the biomass and AP-3, modification of the reversibility of core metabolic reactions, deletion of incorrect reactions, and filling of metabolic gaps. Some reactions obtained from published literatures were also incorporated into the model. The final reconstructed GSMM of A. pretiosum ATCC 31280 has 1282 genes, we called the model Aspm1282.
2.2. Biomass Composition in Aspm1282 Model
Knowledge of the cellular biomass composition is an important prerequisite for the in silico flux analysis, especially during the exponential growth phase, where the primary cellular objective is to maximize growth [26]. There is no detailed information about the biomass composition for A. pretiosum, we obtained each component and corresponding proportion through measurement and literature mining. The cellular compositions of A. pretiosum, consisting of lipids, proteins, carbohydrates and so on, were mostly obtained from text books [27]. The dry cell weight (DCW), consumption rate of sugar, and the yield of AP-3 were determined by our experiment. The DNA composition was calculated by using the G+C content. The RNA composition was calculated based on the presumptive percentage of messenger RNA (mRNA), ribosomal RNA (rRNA), and transfer RNA (tRNA) was 5%, 75%, and 20%, respectively. The compositions of biomass for A. pretiosum ATCC 31280 are listed in Table S2 (Supplementary files).
2.3. Flux Balance Analysis
To perform in silico simulations and predict the metabolic characteristics of A. pretiosum, constraint-based flux analysis was carried out under the assumption of a pseudo-steady state [28]. For growth simulation, we set the biomass equation as the objective function to predict the growth rate and flux distribution, the optimization problem is formulated as following:
| (1) |
v is a flux vector representing a particular flux configuration, S is the stoichiometric matrix, aj and bj are the minimum and maximum fluxes through reaction j. We also investigated the metabolic capacity of A. pretiosum in AP-3 production by setting AP-3 flux as the objective function. The flux balance analysis (FBA) simulation was performed using COBRA Toolbox [29] with Gurobi [30] as the linear programming solver.
2.4. Actinosynnema pretiosum NXJ-24 Mutant and the RNA-Seq Data across Fermentation Process
In our previous study, the NXJ-24 mutant was generated by knockout ansa30 gene, and overexpressing asm10 gene [10]. In the disruption of ansa30 gene, two 1.5-kb homologous arms for ansa30 disruption were respectively amplified with primers Del30-L-F/R and Del30-R-F/R, sequenced, and together cloned to SpeI/EcoRI-digested plasmid pJTU1278 to give the ansa30-inactivation plasmid pLQ578. In the overexpression of asm10, the kasOp promoter was cloned into BamHI/SpeI-digested plasmid pDR3 [31] to generate plasmid pDR3-K. Genes of asm10 were amplified with primers asm10-F/R. Subsequently, the sequenced genes were individually inserted into SpeI/EcoRI-digested plasmid pDR3-K under the control of kasOp promoter, generating plasmids pLQ586 and pLQ589. The recombinant plasmids were introduced into NXJ-24 from E. coli ET12567 (pUZ8002) through intergeneric conjugation. The transcriptome data of NXJ-24 during fermentation process of day 1, day 2, day 3, and day 5 were sequenced by Shanghai Biotechnology Corporation, Shanghai, China. We also sequenced the transcriptome of the wild-type strain in day 5, which was used to construct decline-phase specific model of the wild-type for strain optimization.
2.5. Pathway Enrichment Analysis for Essential Genes and Active Reactions in Aspm1282 Model
We used enrichment analysis to identify pathways enriched in essential genes for AP-3 biosynthesis and active reactions during fermentation process significantly. The hypergeometric test was used to calculate the p-value of each pathway (Equation (2)).
| (2) |
pj is the p-value of subsystem j, N is the total number of reactions/genes in Aspm1282 model, Mj is the number of reactions/genes in subsystem j, n is the number of essential genes or active reactions in the whole model, m is the number of essential genes or active reactions in subsystem j.
2.6. E-FLUX Method for Condition-Specific Model Construction by Integrating Gene Expression Data
E-FLUX is a method for modeling metabolic states under specific conditions by integrating gene or protein expression data, which extends the technique of FBA by modeling maximum flux constraint as a function of measured gene expression [32]. Here we set the upper bound bj of each reaction as the expression value of the genes encoding enzymes catalyzing reaction j.
| (3) |
| (4) |
FPKMi is the FPKM (fragments per kilobaseof exon per million fragments mapped) of gene i measured by experiment, expi represents the expression level of gene i, bj represents the upper bound of reaction j, rxnj represents the reaction j.
By this conversion, we set constraints on both lowly and highly expressed reactions, then FBA will be run by fulfilling the same objective function.
2.7. In Silico Strain Design Approach OptRAM
OptRAM (optimization of regulatory and metabolic network) is a meta-heuristic strain optimization method based on GSMM, which can be divided into three parts: prediction, random modification, simulation, and evaluation. Firstly, we use parsimonious enzyme usage FBA (pFBA) [33] to predict the flux value of each reaction. To identify the global optimal genetic modification strategy, we used simulated annealing [34,35], which is able to accept a worse solution in the early stage (avoiding getting stuck in local maximal). In each iteration of simulated annealing:
Randomly pick up one gene and assign a random mutation code to it. As shown in Table 1, code represents the manipulation of the mutation on selected gene, and FC is the corresponding fold change of the mutated gene expression, which reasonably simulates the up-regulation, down-regulation, or knockout of particular gene.
The expression of genes will be transformed to corresponding reactions in the metabolic model through changing the upper bound or lower bound of it. The range of changes is based on the reference flux values from pFBA.
- The phenotype of modified strain was simulated using FBA, and the objective value was used to evaluate the mutant. OptRAM will choose to go back to last round of iteration or accept this solution according to the Metropolis criterion [35]:
(5)
where is the difference between objective score of new solution and the previous one, T is the control parameter, α is the attenuation factor (α < 1). When > 0 or P > R, new objective score is accepted as the new solution, otherwise OptRAM will go back to the original solution. When OptRAM gets a new solution, T (k + 1) = T (k) × α will be carried out. When a certain number of iterations is reached, the solution at that moment will be the final strain genetic modification solution.T (k + 1) = T (k) × α (6)
Table 1.
Perturbation code and the corresponding fold change (FC) of mutated gene expression.
| Code | 1 | 2 | 3 | 4 | 5 | |
|---|---|---|---|---|---|---|
| FC | 2 | 4 | 8 | 16 | 32 | |
| Code | 0 | −1 | −2 | −3 | −4 | −5 |
| FC | 0.001 | 1/2 | 1/4 | 1/8 | 1/16 | 1/32 |
3. Results
3.1. Reconstructed Genome-Scale Metabolic Model of A. pretiosum
The composition of model Aspm1282 is shown in Table 2, including 1282 genes, 1614 metabolites, and 1669 reactions (1520 intracellular metabolic reactions, 148 transport and exchange reactions, and 1 biomass reaction. Tables S1 and S2 in Supplementary Materials). 17.61% of the total open reading frames (ORFs), corresponding to 1282 genes of 7279 ORFs, were incorporated into the model. The SBML representation of the model can be downloaded from the supplemental files (File S1 in Supplementary Materials).
Table 2.
Composition of Genome-Scale Metabolic Models (GSMM) Aspm1282 for Actinosynnema pretiosum ATCC 31280.
| Categories | Numbers |
|---|---|
| Genes | 1282 |
| Reactions | 1669 |
| Metabolites | 1614 |
| Open reading frames (ORFs) | 7279 |
| Exchange reactions | 118 |
| Transport reactions | 30 |
| Compartments | 2 |
| Subsystems | 12 |
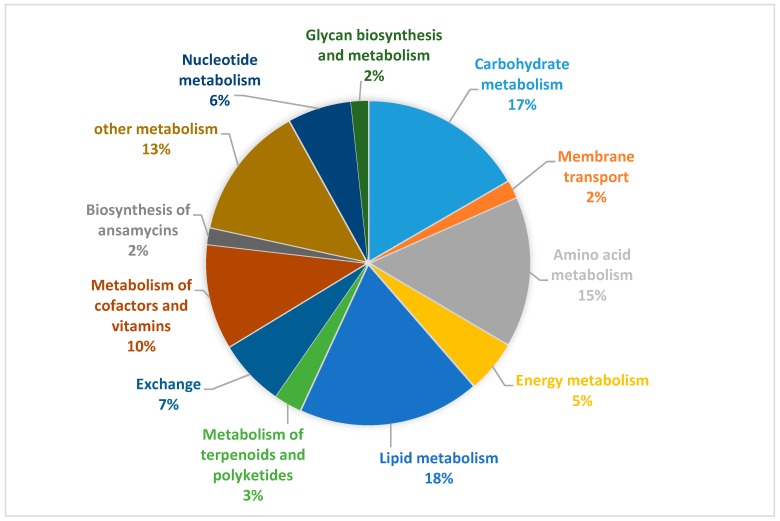
According to KEGG [36] and RAST [37] database, the 1399 reactions with functional annotation in Aspm1282 are classified into eight subsystems, including carbohydrate metabolism, amino acid metabolism, energy metabolism, lipid metabolism, metabolism of terpenoids and polyketides, metabolism of cofactors and vitamins, biosynthesis of ansamycins, and other metabolism (Figure 2). 87% reactions have definite functional annotations, indicating a highly completed model among actinobacteria. The lipid metabolism is the largest subsystem with 18% reactions, followed by carbohydrate metabolism (17%), and amino acid metabolism (15%), totally accounting for half of the entire biological processes.
Figure 2.
Percentage of reactions in each subsystem in Aspm1282 model.
3.2. Aspm1282 Model Validation by the Prediction of Growth and Key Genes for Ansamitocin P-3 Biosynthesis
Aspm1282 is so far the first reconstructed genome-scale model for A. pretiosum, there are no enough standard information can be used to validate the accuracy of the model, such as essential genes for E. coli and yeast model evaluation [38,39]. We compared simulated growth phenotypes of Aspm1282 by FBA with the experimental data. The glucose uptake rate was set as 0.0912 mmol/gDW/h, which was the maximum measured uptake rate. We predicted the maximal biomass flux was 0.2019/h, similar with the experimental data, 0.1792/h, which showed that the model can simulate the growth of ATCC 31280 to some extent.
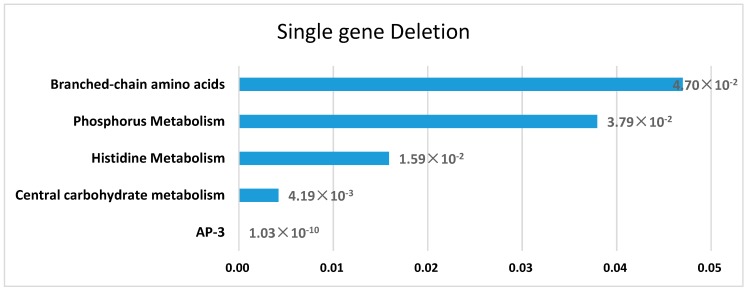
To validate the effectiveness of Aspm1282 in predicting AP-3 biosynthesis, essential gene analysis was performed by single-gene deletion, with the flux of AP-3 production as the objective function. There were 37 genes in the model predicted as influential genes, and 21 of them were found to be essential, whose deletions causing a decrease of AP-3 production more than 90% (Table S3 in Supplementary Materials). The enriched pathways [40] for influential genes is shown in Figure 3, and the genes in AP-3 biosynthesis pathway has the most significant effect on AP-3 production, which is consistent with previous finding [23]. In addition, central carbohydrate metabolism, histidine metabolism, and branched-chain amino acid pathway are also enriched with the influential genes, providing precursors for AP-3 biosynthesis, such as malonyl-CoA (coenzyme A), methylmalonyl-CoA, methoxymalonyl-ACP (acyl carrier protein), glutamate, and valine. Phosphorus metabolism involves the biosynthesis of ATP, which provides the necessary energy for the AP-3 product. The Aspm1282 model efficiently reflects the metabolic characteristics of AP-3 biosynthesis.
Figure 3.
Enriched pathways of the genes essential for ansamitocin P-3 (AP-3) biosynthesis. The vertical axis represents enriched pathways, and the horizontal axis represents the p-value of each pathway.
To further validate the accuracy of the model, we compared the experimental data collected from published literatures (Table 3) with the phenotype predicted by Aspm1282. Previous experiments confirmed that the expression level of specific regulatory genes including Asm8 and Asm18, and the concentrations of metabolites including Mg2+, glycerol, and ammonium have a dominant impact on the production of AP-3 [8,41,42,43,44,45,46]. The affected genes or enzymes by these regulatory genes and metabolites are summarized as in Table 2. Then, we carried out the robustness analysis for each key gene/enzyme and found that all genes/enzymes are positively correlated with the production of AP-3 (Text S1 in Supplementary Materials), which proved that the Aspm1282 model can accurately reflect the effects of the key regulatory genes and metabolites on AP-3 biosynthesis.
Table 3.
The reported key regulators and metabolites for AP-3 production and the robustness simulation of corresponding enzymes in the model.
| Regulator/Metabolite | Corresponding Enzymes in Model | Simulation Positively Correlated with AP-3 |
|---|---|---|
| Asm8 | Asm23, Asm24, Asm43, Asm44, Asm45 | √ |
| Asm18 | Asm21, AsmA, Asm43 | √ |
| Mg2+ | Methylmalonyl-CoA mutase, methylmalonyl-CoA carboxyltransferase | √ |
| Glycerol | Phosphoglucomutase, Asm14, Asm24 | √ |
| Ammonium | Asm14, Asm24, Asm43, Asm19 | √ |
3.3. Metabolic Shift of Ansamitocin P-3 High-Yield Mutant NXJ-24 During Fermentation Process by Condition-Specific Models
Since environment conditions have impact on the metabolic capability of strain [32], condition-specific models are required to reflect the particular metabolic phenotype by integration with omics data. NXJ-24 is a mutant of A. pretiosum ATCC 31280 with high production of AP-3 [23], and the transcriptome data of NXJ-24 mutant were obtained with samples collected at the first, second, third, and fifth days during fermentation process; to better understand the character of NXJ-24 in decline phase, we chose to sequence the transcriptome at the fifth day, instead of the fourth day. Here, we constructed condition-specific metabolic models during the fermentation process by integrating the transcriptome data using E-FLUX method to make comparisons of the specific metabolic capabilities and explore the potential factors that affect the production of AP-3. We generated the model for NXJ-24 mutant by knocking out of asm30 in Aspm1282 model, and the overexpression of asm10 gene was automatically converted to higher flux bound by the mapping to transcriptome data with E-FLUX.
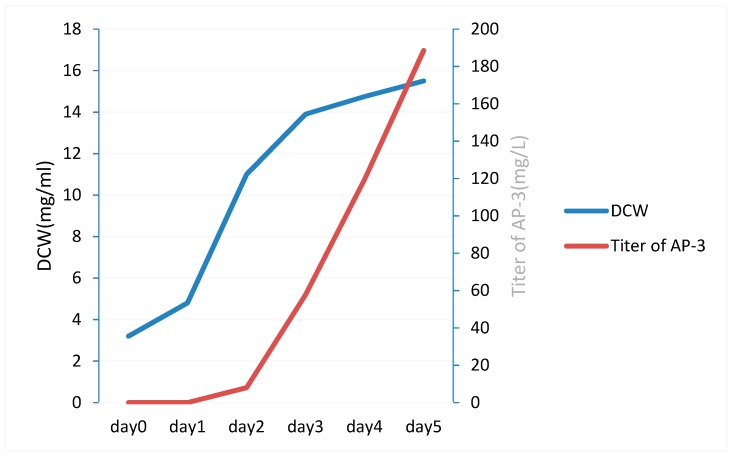
The growth rate, glucose uptake rate, and titer of AP-3 in each day of cultivation were experimentally measured (Figure 4). Glucose is considered to be the main carbon source for A. pretiosum [47], and the uptake rate of glucose has great impact on the energy and carbohydrate metabolism. The flux of glucose uptake in each day was set as a particular value, which was calculated from the measured residue glucose concentrations and DCW (dry cell weight) by experiment.
| Rglucose = consumptionglucose/(DCW·molecular weightglucose·time) | (7) |
Figure 4.
The dry cell weight (DCW) and titer of AP-3 in NXJ-24 mutant during fermentation process.
Because simple FBA simulation with the biomass equation in the generic Aspm1282 model as an objective function will result in no flux through AP-3 biosynthesis pathway, we added AP-3 in the biomass function to make a new objective in NXJ-24 specific models (Equation (8)). Then we can observe the transformation of flux distribution over time in ansamycin biosynthetic pathway in the high-yield mutant. The coefficients c of AP-3 component in the objective function were determined by the relative ratio between AP-3 titer and biomass measured by experiment in Figure 4.
| Objective = Biomass + c × AP-3 | (8) |
In the conditional specific models of day 1, day 2, day 3, and day 5, c is equal to 0, 0.0013, 0.0068, 0.0084 respectively.
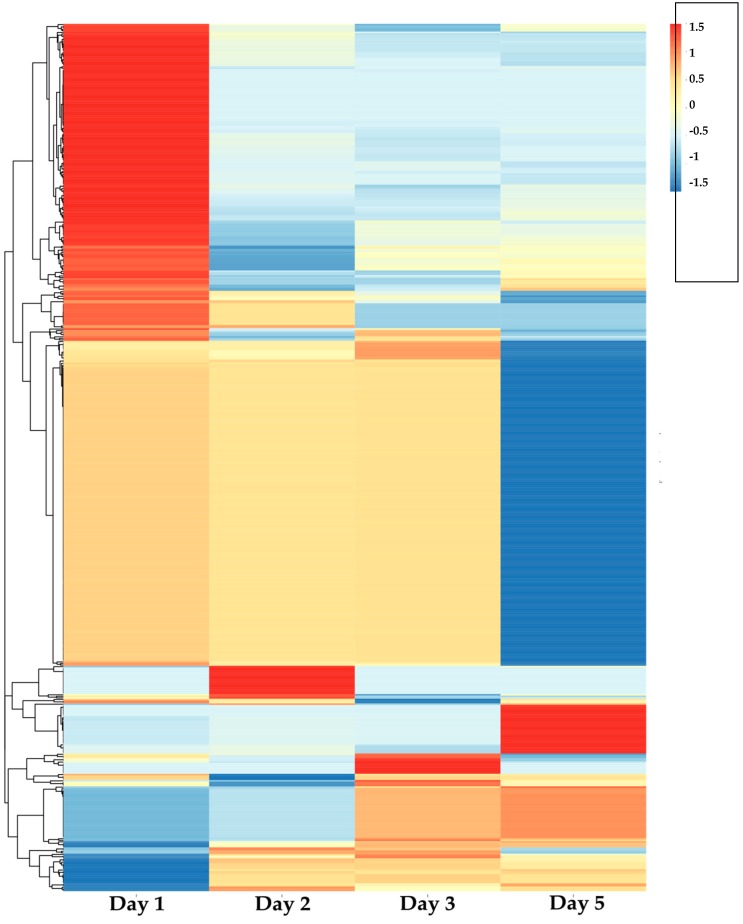
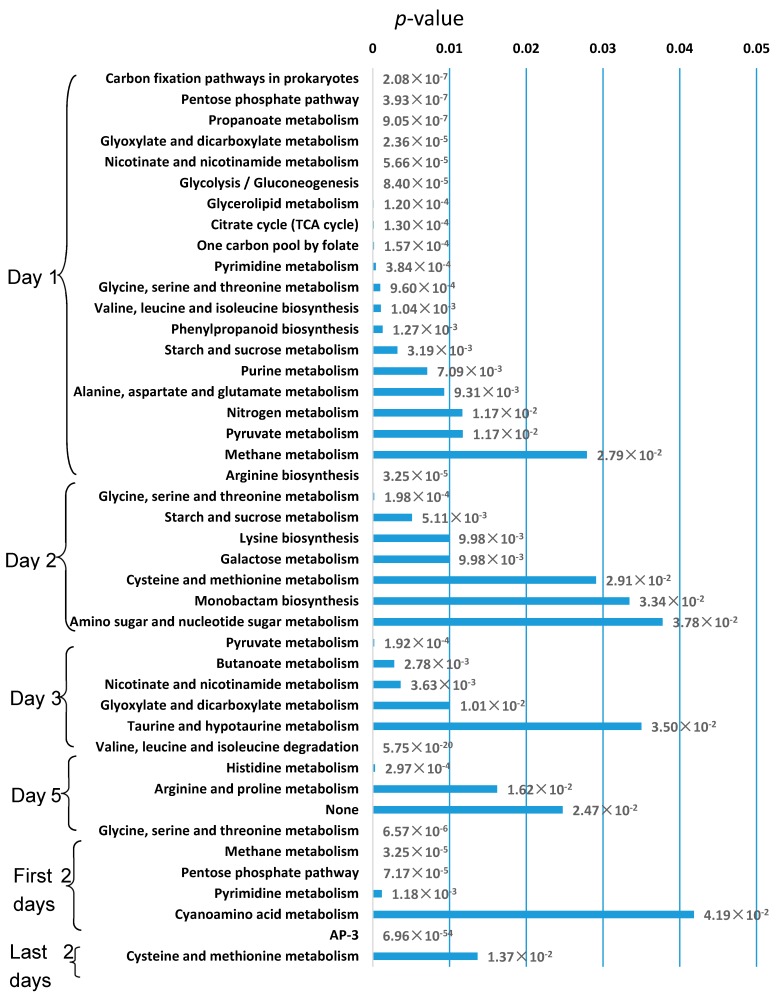
We used FBA to calculate the flux distribution of each specific model during cultivation process, as shown in Figure 5. We selected specific active reactions in each day, whose normalized flux was greater than 0.5 and lower than 0 in other days. Then we found the pathways enriched with active reactions, as shown in Figure 6. The number of active reactions and pathways on the first day is significantly more than other days, and most of them belong to the central carbon metabolism, nucleotide metabolism and energy metabolism, such as citrate cycle pathway, glycolysis/gluconeogenesis pathway, purine metabolism pathway, and carbon fixation pathways in prokaryotes. Since the central carbon metabolism, nucleotide metabolism, and energy metabolism are mainly related with growth and replication of cells, we call them growth related pathways thereafter. During the fermentation process, the percentage of growth related pathways in the enriched active pathways is decreased. For the first two days with higher growth rate, most of the active reactions belong to the growth related pathways. While for the last two days, very few growth related pathways were active, but the AP-3 biosynthesis pathway and cysteine and methionine metabolism were significantly active. This result showed that the replication, energy generation, and uptake of carbon source are the main objective in the first two days, and the capacity of growth is seriously declined in the last two days, while the AP-3 biosynthesis starts to increase.
Figure 5.
The flux distribution of NXJ-24 mutant during different fermentation process. The rows represent the reactions in the Asmp1282.
Figure 6.
Enriched pathways of specifically active reactions in each day. The vertical axis represents enriched pathways, and the horizontal axis represents the p-value of enrich analysis of each pathway.
We found the metabolic shift from growth associated pathways to other metabolism started from the second day of cultivation. Although the growth rate was highest on the second day, the active pathway started to transform from growth related pathways to other pathways, such as cysteine and methionine metabolism and secondary metabolism pathway. It indicated that the growth rate might reach maximum at the moment between the two measurements, but the metabolic mode has changed at the second measurement. We hope to get more precise metabolic shift pattern with highly frequent time-course measurements during cultivation in the future.
In addition, it has been reported that the production of AP-3 was improved in the pentose phosphate pathway weaken mutant [48]. Here we found pentose phosphate pathway was active in the first two days, but inactive in the last two days, when the AP-3 biosynthesis increased.
3.4. Relationship of Methionine Pathway and Ansamitocin P-3 Biosynthesis
The metabolic shift during fermentation process indicated that the biosynthesis of AP-3 is initiated when the cells sense stressful conditions, similar with most secondary metabolism. The significant high activity of cysteine and methionine metabolism in the last two days showed that this pathway plays an important role in the biosynthesis of AP-3. Methionine is the precursor of SAM (S-adenosyl-l-methionine), which is the key methyl donor for three steps of methylation reactions in AP-3 biosynthesis pathway. More significantly, one of the methylation reactions, catalyzed by asm10, was reported as the bottleneck in the production of AP-3, the increase in asm10 can increase the AP-3 production by 93% [23,49].
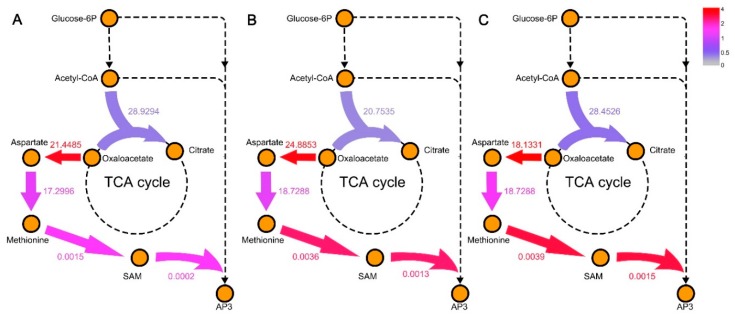
To further explore the relationship among cysteine and methionine metabolism, cell growth, and AP-3 production, we simulated the biosynthetic velocity of key metabolites in methionine biosynthesis and tricarboxylic acid cycle (TCA cycle), as shown in Figure 7. The biosynthetic velocity of citrate in the first day was significantly higher than that in other days, while the velocity of aspartate, methionine, and SAM were lower. Most flux flow into the TCA cycle on the first day to meet the growth demand of the strain. Since the second day, the flux turned to flow into the biosynthesis of methionine pathway, which improve the concentration of SAM in the cell and contribute to the biosynthesis of AP-3 [50].
Figure 7.
The flux change of methionine biosynthesis and tricarboxylic acid cycle (TCA cycle) in the specific models for day 2 (A), day 3 (B), and day 5 (C) compared with day 1. The values represent the flux through each reaction. The colored arrow represent the ratio of flux in each day to that of day 1. SAM: S-adenosyl-L-methionine.
3.5. Strain Optimization for Ansamitocin P-3 Overproduction by Aspm1282 Model
Using the Aspm1282 model, we aimed to identify potential engineering strategy for AP-3 overproduction. A series of computational strain optimization methods have been published, such as RobustKnock [51], OptGene [52], OptORF [53], GDLS [54], and FSEOF [55]. The meta-heuristic methods such as OptGene have been used widely, which aim to find the solution fulfilling the best optimized function, usually biomass-product coupled yield (BPCY). But sometimes BPCY remains 0, and the algorithm reports no feasible solution. To better characterize the coupling between biomass and target production, we proposed an improved objective function (Equation (9)) in our in silico strain design approach OptRAM, which can identify strategies for up-regulation, down-regulation or knockout of metabolic genes by simulated annealing algorithm.
| (9) |
| (10) |
Target means the average flux value of target product. Range is set to half of the interval between min and max target flux value.
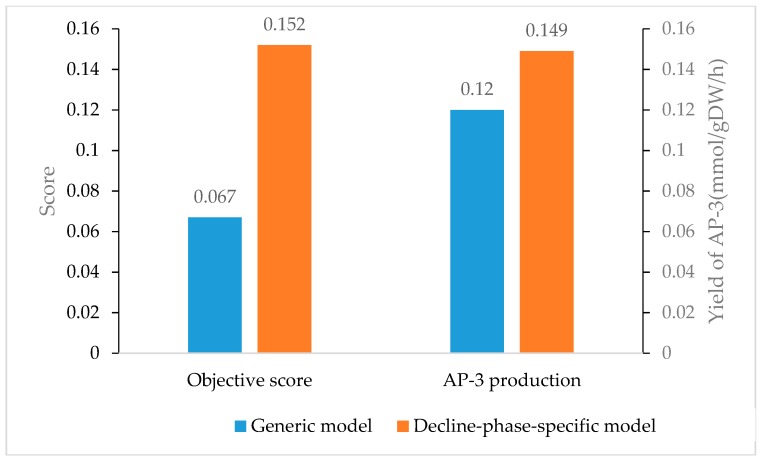
The other advantage of OptRAM is that we incorporated an evaluation mechanism to determine the best and feasible genetic modification solution, by considering growth rate, product of desired compound, and implementation cost. We ran OptRAM 25 times for the generic Aspm1282 model and the decline-phase-specific model, respectively, integrating expression data of the wild-type strain on day 5 (Table S4 in Supplementary Materials). The average of objective score and AP-3 production flux of the two models were illustrated in Figure 8, which demonstrated that the decline-phase-specific model outperformed generic model with both higher AP-3 production and better coupling with growth. Therefore, the model integrated with gene expression data in decline phase could be more suitable to simulate the metabolic pattern of secondary-metabolite-biosynthesis strain.
Figure 8.
The mean objective score and mean AP-3 production predicted by generic Aspm1282 model and decline-phase-specific model.
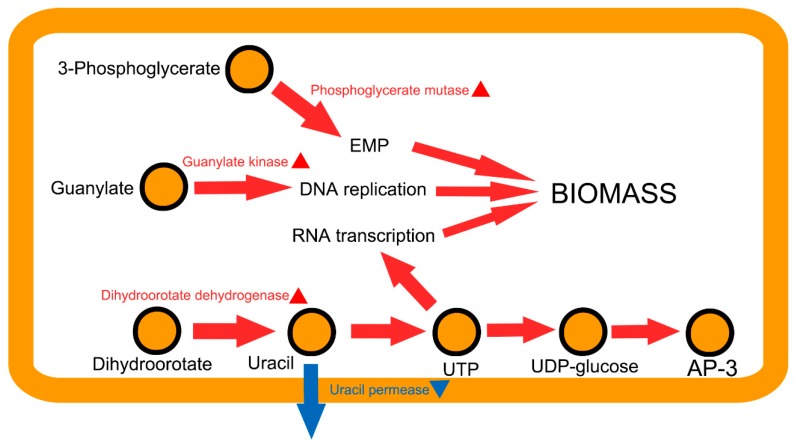
We selected the solution with the highest objective score among 25 simulations by decline-phase-specific model, which included four genetic modification sites. The detailed annotation and expression adjustment were shown in Table 4. The mechanism of the optimized modification strategy to improve AP-3 was illustrated in Figure 9. In this strategy, 42197.4.peg.5418 (guanylate kinase) and 42197.4.peg.5889 (uracil permease) are involved in nucleotide synthesis. The upregulation of 42197.4.peg.5418 can improve the biosynthesis of GTP (guanosine triphosphate) and thus promote the DNA replication. The down regulation of uracil permease can reduce the leakage of uracil to increase the flux rate of RNA synthesis to some extent. 42197.4.peg.3610 (phosphoglycerate mutase) catalyzes a critical step in glycolysis/gluconeogenesis pathway, whose upregulation can improve the growth rate of strain. These three genetic modification sites are all relevant to growth rate improvement. The other modification site, upregulation of 42197.4.peg.5886 (dihydroorotate dehydrogenase), can accelerate the biosynthesis of UDP (uridine diphosphate), which can not only enhance growth rate, but also improve the synthesis of UDP-glucose, a key precursor of AP-3. The combinatorial modification of the above four genes identified by computational simulation improved the theoretical flux of AP-3 synthesis from 0.201 to 0.372 mmol/gDW/h, and kept better growth meanwhile. It validated that the Aspm1282 model is relatively accurate and useful for guiding strain design.
Table 4.
The predicted modification of A. pretiosum ATCC 31280 for AP-3 overproduction.
| Genes | Enzymes | Modifications |
|---|---|---|
| 42197.4.peg.3610 | Phosphoglycerate mutase | Overexpression |
| 42197.4.peg.5418 | Guanylate kinase | Overexpression |
| 42197.4.peg.5886 | Dihydroorotate dehydrogenase | Overexpression |
| 42197.4.peg.5889 | Uracil permease | Underexpression |
Objective Score = 0.388; Product = 0.372.
Figure 9.
The mechanism of the optimized modification strategy to improve AP-3 and growth. The arrows represent flux rate of particular biological processes related with the biomass and AP-3 biosynthesis. The modification sites identified by OptRAM are labeled with triangle, and the red and blue ones mean overexpression or underexpression, respectively. Red and blue colored arrows represent up- or downregulation of the reactions in modified strain compared to the wild-type. AP-3: ansamitocin P-3; EMP: Embden Meyerhof Parnas pathway; UTP: uridine triphosphate; UDP: uridine diphosphate.
4. Discussion
4.1. The First Genome-Scale Metabolic Model of A. pretiosum
In this study, we reconstructed the first GSMM Aspm1282 for A. pretiosum ATCC 31280, which provides a fundamental and useful system to study the metabolic mechanism and guide for AP-3 overproduction. The model Aspm1282 covers 90.7% reactions with annotated genes, and 87% reactions with clear pathway information. Usually there are 50% genes with accurate functional annotation for actinobacteria, while our model accounts 87% metabolic genes with specific pathway function, which complements the interpretation of A. pretiosum genome and also provides a reference for other actinobacteria, such as Streptomyces coelicolor and Sacchropolysora erythrae. The effectiveness of this model has been confirmed by the positive effects of reported key factors and metabolites on AP-3 production. The lack of experimental information is still a limit for the validation of the model reconstructed here. Further experiments on A. pretiosum time-course growth and gene deletion should help us better refine and complete the model.
4.2. Metabolic Shift of Ansamitocin P-3 High-Yield Mutant NXJ-24 during Fermentation Process
As shown in Figure 5, it was obvious that the number of specific active reactions in the first day is significantly greater than the other days, which indicated that the strain is relative vigorous in the first day. Figure 6 illustrated that during the fermentation process, the percentage of the active growth related pathways decreased, and there is even no enriched growth related pathway in the last two days. The changes of flux distribution of condition-specific model can well reflect the metabolic shift from growth related pathway to other pathways such as amino acid metabolism and secondary metabolism pathway since the second day of cultivation. The AP-3 and cysteine and methionine metabolisms were enriched in the last two days, which indicated there are certain relationships among cell growth, activation of cysteine and methionine metabolism, and the biosynthesis of AP-3.
4.3. Up-Regulation of Methionine Biosynthetic Pathway May Be a Potential Strategy to Improve the Production of Ansamitocin P-3
Both the significantly active methionine pathway in the latter stage of fermentation and the relationship between methionine pathway and AP-3 biosynthesis indicated that the methionine pathway could be a potentially important pathway for AP-3 overproduction. It was reported that the N-methylation reaction, S-adenosyl-l-methionine + N-demethyl-ansamitocin P-3 → S-adenosyl-l-homocysteine + ansamitocin P-3 (named R09852 in KEGG database), catalyzed by Asm10, was one of the bottlenecks in AP-3 biosynthesis [23]. As a substrate of R09852, the biosynthesis velocity of SAM and its main precursor, methionine, could have a prominent impact on the production of AP-3. As shown in Figure 7A, it was obvious that with the change of metabolic pattern at the second day, the flux was diverted to aspartate from citrate. Because aspartate is the beginning of methionine pathway, this metabolic shift could promote the accumulation of methionine and thus increase the production of AP-3. For the predicted engineering strategy obtained from OptRAM, we also found gene 42197.4.peg.5105 (5-methyltetrahydrofolate-homocysteine methyltransferase) involved in methionine biosynthesis. As mentioned above, the up-regulation of it may improve the biosynthesis of SAM.
4.4. Application of the Reconstructed Model in Strain Design for Ansamitocin P-3 Overproduction
In actual industrial production, the target production efficiency is determined by both the biomass and flux of the target compound. Therefore, we set Obj as the evaluation of strain modification, which considers biomass and product simultaneously. We used OptRAM method to simulate Aspm1282 model and identify a modification strategy for AP-3 overproduction, which enhances the EMP pathway (Embden Meyerhof Parnas pathway), reduces the release of uracil, and improves the biosynthesis of UTP and GTP. EMP is an important pathway that provides energy and carbon skeleton for biomass. The improvement of UTP and GTP biosynthesis can promote the replication of DNA and the transcription of RNA, both of which are essential for biomass. What is more, the biosynthesis of UTP directly affects the production of AP-3 through the biosynthesis of UDP-glucose, one of the precursors for AP-3. All these modification sites demonstrated that the strain optimization by our newly reconstructed model is of great potential for real application in AP-3 overproduction.
Supplementary Materials
The following are available online at http://www.mdpi.com/2073-4425/9/7/364/s1, File S1: The SBML file of reconstructed genome-scale model Aspm1282 for A. pretiosum ATCC 31280, Table S1: List of reactions in Aspm1282 model, Table S2: Compositions of biomass for A. pretiosum ATCC 31280, Table S3: The effects of single gene deletions on AP-3 biosynthesis flux predicted by Aspm1282 model, Table S4: The strain optimization solutions of OptRAM for improving AP-3 by generic model and Decline-phase-specific model, Text S1: The positive correlation between AP-3 production with enzyme-catalyzing-reactions affected by literature-reported regulatory genes and metabolites for AP-3.
Author Contributions
J.L. reconstructed and validated the model, performed the in silico strain design, and wrote the manuscript; R.S. refined the model according to the literature and experimental measurements. X.N. made samples of A. pretiosum during the fermentation process for RNA-Sequencing. X.W. collected the set of key factors for AP-3 biosynthesis for model validation. Z.W. designed the project, analyzed data, and wrote the manuscript.
Funding
This research was funded by Shanghai Natural Science Funding grant number 16ZR1449700, Scientific Research Foundation for the Returned Overseas Chinese Scholars of the State Education Ministry grant number 15Z102050028, National Key Research and Development Plan of China grant number 2017YFC0908105 and the Science Fund for Creative Research Groups of the National Natural Science Foundation of China grant number 81421061.
Conflicts of Interest
The authors declare no conflicts of interest.
References
- 1.Higashide E., Asai M., Ootsu K., Tanida S., Kozai Y., Hasegawa T., Kishi T., Sugino Y., Yoneda M. Ansamitocin, a group of novel maytansinoid antibiotics with antitumour properties from Nocardia. Nature. 1977;270:721–722. doi: 10.1038/270721a0. [DOI] [PubMed] [Google Scholar]
- 2.Tanida S., Hasegawa T., Hatano K., Higashide E., Yoneda M. Ansamitocins, maytansinoid antitumor antibiotics. Producing organism, fermentation, and antimicrobial activities. J. Antibiot. 1980;33:192–198. doi: 10.7164/antibiotics.33.192. [DOI] [PubMed] [Google Scholar]
- 3.Staunton J., Weissman K.J. Polyketide biosynthesis: A millennium review. Nat. Prod. Rep. 2001;18:380–416. doi: 10.1039/a909079g. [DOI] [PubMed] [Google Scholar]
- 4.Gao Y., Fan Y., Nambou K., Wei L., Liu Z., Imanaka T., Hua Q. Enhancement of ansamitocin P-3 production in Actinosynnema pretiosum by a synergistic effect of glycerol and glucose. J. Ind. Microbiol. Biotechnol. 2014;41:143–152. doi: 10.1007/s10295-013-1374-3. [DOI] [PubMed] [Google Scholar]
- 5.Suwanborirux K., Chang C.J., Spjut R.W., Cassady J.M. Ansamitocin P-3, a maytansinoid, from Claopodium crispifolium and Anomodon attenuatus or associated actinomycetes. Experientia. 1990;46:117–120. doi: 10.1007/BF01955435. [DOI] [PubMed] [Google Scholar]
- 6.Wang J., Xiao H., Qian Z.G., Zhong J.J. Bioproduction of antibody-drug conjugate payload precursors by engineered cell factories. Trends Biotechnol. 2017;35:466–478. doi: 10.1016/j.tibtech.2017.03.001. [DOI] [PubMed] [Google Scholar]
- 7.Du Z.Q., Zhang Y., Qian Z.G., Xiao H., Zhong J.J. Combination of traditional mutation and metabolic engineering to enhance ansamitocin P-3 production in Actinosynnema pretiosum. Biotechnol. Bioeng. 2017;114:2794–2806. doi: 10.1002/bit.26396. [DOI] [PubMed] [Google Scholar]
- 8.Bandi S., Kim Y.J., Chang Y.K., Shang G., Yu T.W., Floss H.G. Construction of asm2 deletion mutant of Actinosynnema pretiosum and medium optimization for ansamitocin P-3 production using statistical approach. J. Microbiol. Biotechnol. 2006;16:1338–1346. [Google Scholar]
- 9.Bandi S., Kim Y.J., Sa S.O., Chang Y.K. Statistical approach to development of culture medium for ansamitocin P-3 production with Actinosynnema pretiosum ATCC 31565. J. Microbiol. Biotechnol. 2005;15:930–937. [Google Scholar]
- 10.Fan Y., Gao Y., Zhou J., Wei L., Chen J., Hua Q. Process optimization with alternative carbon sources and modulation of secondary metabolism for enhanced ansamitocin P-3 production in Actinosynnema pretiosum. J. Biotechnol. 2014;192:1–10. doi: 10.1016/j.jbiotec.2014.10.020. [DOI] [PubMed] [Google Scholar]
- 11.Kato Y., Bai L., Xue Q., Revill W.P., Yu T.W., Floss H.G. Functional expression of genes involved in the biosynthesis of the novel polyketide chain extension unit, methoxymalonyl-acyl carrier protein, and engineered biosynthesis of 2-desmethyl-2-methoxy-6-deoxyerythronolide B. J. Am. Chem. Soc. 2002;124:5268–5269. doi: 10.1021/ja0127483. [DOI] [PubMed] [Google Scholar]
- 12.Kitano H. Systems Biology: A brief overview. Science. 2002;295:1662–1664. doi: 10.1126/science.1069492. [DOI] [PubMed] [Google Scholar]
- 13.Price N.D., Reed J.L., Palsson B.Ø. Genome-scale models of microbial cells: Evaluating the consequences of constraints. Nat. Rev. Microbiol. 2004;2:886–897. doi: 10.1038/nrmicro1023. [DOI] [PubMed] [Google Scholar]
- 14.Huan T., Forsberg E.M., Rinehart D., Johnson C.H., Ivanisevic J., Benton H.P., Fang M., Aisporna A., Hilmers B., Poole F.L. Systems biology guided by XCMS Online metabolomics. Nat. Methods. 2017;14:461–462. doi: 10.1038/nmeth.4260. [DOI] [PMC free article] [PubMed] [Google Scholar]
- 15.Feist A.M., Herrgård M.J., Thiele I., Reed J.L., Palsson B.Ø. Reconstruction of biochemical networks in microorganisms. Nat. Rev. Microbiol. 2009;7:129–143. doi: 10.1038/nrmicro1949. [DOI] [PMC free article] [PubMed] [Google Scholar]
- 16.Kim M., Yi J.S., Kim J., Kim J.N., Min W.K., Kim B.G. Reconstruction of high-quality metabolic model enables identification of gene overexpression targets for enhanced antibiotics production in Streptomyces coelicolor A3(2) Biotechnol. J. 2014;9:1185–1194. doi: 10.1002/biot.201300539. [DOI] [PubMed] [Google Scholar]
- 17.Reed J.L., Vo T.D., Schilling C.H., Palsson B.O. An expanded genome-scale model of Escherichia coli K-12 (i JR904 GSM/GPR) Genome Biol. 2003;4:1–12. doi: 10.1186/gb-2003-4-9-r54. [DOI] [PMC free article] [PubMed] [Google Scholar]
- 18.Choi S., Kim H.U., Kim T.Y., Lee S.Y. Systematic engineering of TCA cycle for optimal production of a four-carbon platform chemical 4-hydroxybutyric acid in Escherichia coli. Metab. Eng. 2016;38:264–273. doi: 10.1016/j.ymben.2016.09.004. [DOI] [PubMed] [Google Scholar]
- 19.Orth J.D., Conrad T.M., Na J., Lerman J.A., Nam H., Feist A.M., Palsson B.Ø. A comprehensive genome-scale reconstruction of Escherichia coli metabolism—2011. Mol. Syst. Biol. 2011;7:535. doi: 10.1038/msb.2011.65. [DOI] [PMC free article] [PubMed] [Google Scholar]
- 20.Ip K., Donoghue N., Kim M.K., Lun D.S. Constraint-based modeling of heterologous pathways: Application and experimental demonstration for overproduction of fatty acids in Escherichia coli. Biotechnol. Bioeng. 2014;111:2056–2066. doi: 10.1002/bit.25261. [DOI] [PubMed] [Google Scholar]
- 21.Brochado A.R., Patil K.R. Overexpression of O-methyltransferase leads to improved vanillin production in baker’s yeast only when complemented with model-guided network engineering. Biotechnol. Bioeng. 2013;110:656–659. doi: 10.1002/bit.24731. [DOI] [PubMed] [Google Scholar]
- 22.Wang Y., Xu N., Ye C., Liu L., Shi Z., Wu J. Reconstruction and in silico analysis of an Actinoplanes sp. SE50/110 genome-scale metabolic model for acarbose production. Front. Microbiol. 2015;6:632. doi: 10.3389/fmicb.2015.00632. [DOI] [PMC free article] [PubMed] [Google Scholar]
- 23.Ning X., Wang X., Wu Y., Kang Q., Bai L. Identification and engineering of post-PKS modification bottlenecks for ansamitocin P-3 titer improvement in Actinosynnema pretiosum subsp. pretiosum ATCC 31280. Biotechnol. J. 2017;12 doi: 10.1002/biot.201700484. [DOI] [PubMed] [Google Scholar]
- 24.Aziz R.K., Bartels D., Best A.A., Dejongh M., Disz T., Edwards R.A., Formsma K., Gerdes S., Glass E.M., Kubal M. The RAST Server: Rapid annotations using subsystems technology. BMC Genom. 2008;9:75. doi: 10.1186/1471-2164-9-75. [DOI] [PMC free article] [PubMed] [Google Scholar]
- 25.Aziz R.K., Devoid S., Disz T., Edwards R.A., Henry C.S., Olsen G.J., Olson R., Overbeek R., Parrello B., Pusch G.D. SEED servers: High-performance access to the SEED genomes, annotations, and metabolic models. PLoS ONE. 2012;7:e48053. doi: 10.1371/journal.pone.0048053. [DOI] [PMC free article] [PubMed] [Google Scholar]
- 26.Ye C., Qiao W., Yu X., Ji X., Huang H., Collier J.L., Liu L. Reconstruction and analysis of the genome-scale metabolic model of Schizochytrium limacinum SR21 for docosahexaenoic acid production. BMC Genom. 2015;16:799. doi: 10.1186/s12864-015-2042-y. [DOI] [PMC free article] [PubMed] [Google Scholar]
- 27.Xu L.H., Li W.J., Liu Z.H., Jiang C.L. 放线菌系统学—原理、方法及实践. Science Press; Beijing, China: 2007. (In Chinese) [Google Scholar]
- 28.Varma A., Palsson B.O. Metabolic Flux Balancing: Basic concepts, scientific and practical use. Nat. Biotechnol. 1994;12:994–998. doi: 10.1038/nbt1094-994. [DOI] [Google Scholar]
- 29.Hyduke D., Schellenberger J., Que R., Fleming R., Thiele I., Orth J., Feist A., Zielinski D., Bordbar A., Lewis N. COBRA Toolbox 2.0. Protoc. Exch. 2011 doi: 10.1038/protex.2011.234. [DOI] [PMC free article] [PubMed] [Google Scholar]
- 30.Gurobi Optimization Inc. Gurobi Optimization V5.0 Solves New Problem Types, Adds New Features and Interfaces. Chin. Nurs. Res. 2007;52:98–111. [Google Scholar]
- 31.Li X., Wang W., Yang K. An engineered strong promoter for Streptomycetes. Appl. Environ. Microbiol. 2013;79:4484–4492. doi: 10.1128/AEM.00985-13. [DOI] [PMC free article] [PubMed] [Google Scholar]
- 32.Colijn C., Brandes A., Zucker J., Lun D.S., Weiner B., Farhat M.R., Cheng T.Y., Moody D.B., Murray M., Galagan J.E. Interpreting expression data with metabolic flux models: Predicting Mycobacterium tuberculosis mycolic acid production. PLoS Comput. Biol. 2009;5:e1000489. doi: 10.1371/journal.pcbi.1000489. [DOI] [PMC free article] [PubMed] [Google Scholar]
- 33.Lewis N.E., Hixson K.K., Conrad T.M., Lerman J.A., Charusanti P., Polpitiya A.D., Adkins J.N., Schramm G., Purvine S.O., Lopez-Ferrer D. Omic data from evolved E. coli are consistent with computed optimal growth from genome—Scale models. Mol. Syst. Biol. 2010;6:390. doi: 10.1038/msb.2010.47. [DOI] [PMC free article] [PubMed] [Google Scholar]
- 34.Kirkpatrick S., Vecchi M.P. Optimization by Simulated Annealing. Morgan Kaufmann Publishers Inc.; Burlington, MA, USA: 1987. [Google Scholar]
- 35.Metropolis N., Rosenbluth A.W., Rosenbluth M.N., Teller A.H., Teller E. Equation of state calculations by fast computing machines. J. Chem. Phys. 2004;21:1087–1092. doi: 10.1063/1.1699114. [DOI] [Google Scholar]
- 36.Research N.A. KEGG: Kyoto encyclopedia of genes and genomes. Nucleic Acids Res. 1999;27:29–34. doi: 10.1093/nar/27.1.29. [DOI] [PMC free article] [PubMed] [Google Scholar]
- 37.Overbeek R., Olson R., Pusch G.D., Olsen G.J., Davis J.J., Disz T., Edwards R.A., Gerdes S., Parrello B., Shukla M. The SEED and the Rapid Annotation of microbial genomes using subsystems technology (RAST) Nucleic Acids Res. 2014;42:206–214. doi: 10.1093/nar/gkt1226. [DOI] [PMC free article] [PubMed] [Google Scholar]
- 38.Tong X., Campbell J.W., Balázsi G., Kay K.A., Wanner B.L., Gerdes S.Y., Oltvai Z.N. Genome-scale identification of conditionally essential genes in E. coli by DNA microarrays. Biochem. Biophys. Res. Commun. 2016;322:347–354. doi: 10.1016/j.bbrc.2004.07.110. [DOI] [PubMed] [Google Scholar]
- 39.Luo H., Lin Y., Gao F., Zhang C.T., Zhang R. DEG 10, an update of the database of essential genes that includes both protein-coding genes and noncoding genomic elements. Nucleic Acids Res. 2014;42:D574–D580. doi: 10.1093/nar/gkt1131. [DOI] [PMC free article] [PubMed] [Google Scholar]
- 40.Subramanian A., Tamayo P., Mootha V.K., Mukherjee S., Ebert B.L., Gillette M.A., Paulovich A., Pomeroy S.L., Golub T.R., Lander E.S., et al. Gene set enrichment analysis: A knowledge-based approach for interpreting genome-wide expression profiles. Proc. Natl. Acad. Sci. USA. 2005;102:15545–15550. doi: 10.1073/pnas.0506580102. [DOI] [PMC free article] [PubMed] [Google Scholar]
- 41.Jia Y., Zhong J.J. Enhanced production of ansamitocin P-3 by addition of Mg2+ in fermentation of Actinosynnema pretiosum. Bioresour. Technol. 2011;102:10147–10150. doi: 10.1016/j.biortech.2011.08.031. [DOI] [PubMed] [Google Scholar]
- 42.Li S., Lu C., Chang X., Shen Y. Constitutive overexpression of Asm18 increases the production and diversity of maytansinoids in Actinosynnema pretiosum. Appl. Microbiol. Biotechnol. 2016;100:2641–2649. doi: 10.1007/s00253-015-7127-7. [DOI] [PubMed] [Google Scholar]
- 43.Li Y., Zhao P., Kang Q., Ma J., Bai L., Deng Z. Dual carbamoylations on the polyketide and glycosyl moiety by asm21 result in extended ansamitocin biosynthesis. Chem. Biol. 2011;18:1571–1580. doi: 10.1016/j.chembiol.2011.11.007. [DOI] [PubMed] [Google Scholar]
- 44.Lin J., Bai L., Deng Z., Zhong J.J. Effect of ammonium in medium on ansamitocin P-3 production by Actinosynnema pretiosum. Biotechnol. Bioprocess Eng. 2010;15:119–125. doi: 10.1007/s12257-009-3054-8. [DOI] [Google Scholar]
- 45.Moss S.J., Bai L., Toelzer S., Carroll B.J., Mahmud T., Yu T.W., Floss H.G. Identification of asm19 as an acyltransferase attaching the biologically essential ester side chain of ansamitocins using N-desmethyl-4,5-desepoxymaytansinol, not maytansinol, as its substrate. J. Am. Chem. Soc. 2002;124:6544–6545. doi: 10.1021/ja020214b. [DOI] [PubMed] [Google Scholar]
- 46.Pan W., Kang Q., Wang L., Bai L., Deng Z. Asm8, a specific LAL-type activator of 3-amino-5-hydroxybenzoate biosynthesis in ansamitocin production. Sci. China Life Sci. 2013;56:601–608. doi: 10.1007/s11427-013-4502-4. [DOI] [PubMed] [Google Scholar]
- 47.Shen X., Yi D., Chen S. Fermentation process of ansamitocin P-3 by Actinosynnema pretiosum. Chin. J. Pharm. 2017;10:1449–1453. [Google Scholar]
- 48.Fan Y., Hu F., Wei L., Bai L., Hua Q. Effects of modulation of pentose-phosphate pathway on biosynthesis of ansamitocins in Actinosynnema pretiosum. J. Biotechnol. 2016;230:3–10. doi: 10.1016/j.jbiotec.2016.05.010. [DOI] [PubMed] [Google Scholar]
- 49.Tan G., Liu Y., Wu Y., Ouyang K., Zhou L., Yu P., Liao J., Ning C. Electrically reversible redox-switchable polydopamine films for regulating cell behavior. Electrochim. Acta. 2017;228:343–350. doi: 10.1016/j.electacta.2016.12.189. [DOI] [Google Scholar]
- 50.Boissier F., Bardou F., Guillet V., Uttenweilerjoseph S., Daffé M., Quémard A., Mourey L. Further Insight into S-adenosylmethionine-dependent methyltransferases. J. Biol. Chem. 2006;281:4434–4445. doi: 10.1074/jbc.M510250200. [DOI] [PubMed] [Google Scholar]
- 51.Tepper N., Shlomi T. Predicting Metabolic Engineering Knockout Strategies for Chemical Production. Oxford University Press; Oxford, UK: 2010. [DOI] [PubMed] [Google Scholar]
- 52.Patil K.R., Rocha I., Förster J., Nielsen J. Evolutionary programming as a platform for in silico metabolic engineering. BMC Bioinform. 2005;6:1–12. doi: 10.1186/1471-2105-6-308. [DOI] [PMC free article] [PubMed] [Google Scholar]
- 53.Kim J., Reed J.L. OptORF: Optimal metabolic and regulatory perturbations for metabolic engineering of microbial strains. BMC Syst. Biol. 2010;4:53. doi: 10.1186/1752-0509-4-53. [DOI] [PMC free article] [PubMed] [Google Scholar]
- 54.Lun D.S., Rockwell G., Guido N.J., Baym M., Kelner J.A., Berger B., Galagan J.E., Church G.M. Large-scale identification of genetic design strategies using local search. Mol. Syst. Biol. 2009;5:296. doi: 10.1038/msb.2009.57. [DOI] [PMC free article] [PubMed] [Google Scholar]
- 55.Choi H.S., Lee S.Y., Kim T.Y., Woo H.M. In silico identification of gene amplification targets for improvement of lycopene production. Appl. Environ. Microbiol. 2010;76:3097–3105. doi: 10.1128/AEM.00115-10. [DOI] [PMC free article] [PubMed] [Google Scholar]
Associated Data
This section collects any data citations, data availability statements, or supplementary materials included in this article.


