

Abstract
The structural order of biopolymers, such as proteins, at interfaces defines the physical and chemical interactions of biological systems with their surroundings and is hence a critical parameter in a range of biological problems. Known spectroscopic methods for routine rapid monitoring of structural order in biolayers are generally only applied to model single-component systems that possess a spectral fingerprint which is highly sensitive to orientation. This spectroscopic behavior is not a generic property and may require the addition of a label. Importantly, such techniques cannot readily be applied to real multicomponent biolayers, have ill-defined or unknown compositions, and have complex spectroscopic signatures with many overlapping bands. Here, we demonstrate the sensitivity of plasmonic fields with enhanced chirality, a property referred to as superchirality, to global orientational order within both simple model and “real” complex protein layers. The sensitivity to structural order is derived from the capability of superchiral fields to detect the anisotropic nature of electric dipole–magnetic dipole response of the layer; this is validated by numerical simulations. As a model study, the evolution of orientational order with increasing surface density in layers of the antibody immunoglobulin G was monitored. As an exemplar of greater complexity, superchiral fields are demonstrated, without knowledge of exact composition, to be able to monitor how qualitative changes in composition alter the structural order of protein layers formed from blood serum, thereby establishing the efficacy of the phenomenon as a tool for studying complex biological interfaces.
Introduction
Biointerfaces play a key role in biology and biotechnology, providing the contact point between biological systems and their environment. The structure of biointerfaces, such as the orientation of constituent proteins and other macromolecular assemblies, is an important parameter as it governs functionality. Probing structural order in biolayers is a challenging task given the prerequisite high sensitivity required for the small quantities of material, which makes conventional biostructural sensing tools ineffective. There are some examples of the use of sum frequency generation (SFG)1 and linear dichroism (LD)2,3 to monitor orientational order in single layers of biomolecules on inorganic surfaces. However, these examples use systems which contain a chromophore, such as a heme group or dye, which can provide an effective “tag” of orientation. In general, orientational order within biolayers is inferred from thickness measurements of saturated layers obtained using ellipsometry4 or from theoretical modeling.5,6 In addition, atomic force microscopy (AFM) uses topographical and mechanical properties to establish the macromolecular shape of the molecule based on correlation-averaged image reconstruction. Thus, orientational information can be inferred from AFM images of a known biomolecule, but they cannot parametrize global order.7 Because these approaches require a priori knowledge of the adsorbed layers, they are restricted to focusing on modeling single-component protein layers rather than “real” compositionally complex biolayers.
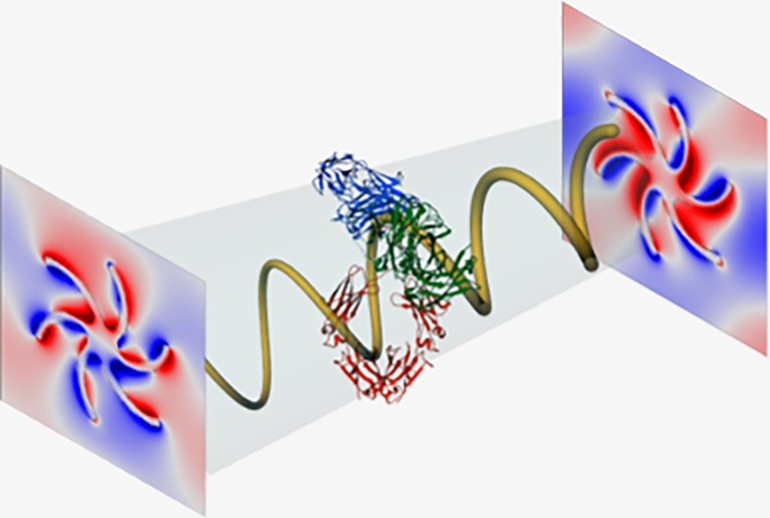
In this study, we present a new concept for probing orientational order within protein layers. Uniquely, this phenomenon is not reliant on an optical spectroscopic fingerprint (i.e., UV/vis or IR absorption bands) of the constituent material. Locally, the near-fields of chiral plasmonic nanostructures can have a level of chiral asymmetry higher than that of circularly polarized light of the same frequency,8−11 a property referred to as superchirality. In previous studies, the differential interaction of superchiral fields with biomaterials caused an asymmetry in optical properties of left-handed (LH) and right-handed (RH) nanostructures that is sensitive to biomacromolecular structure over a range of length scales, from secondary12−14 to quaternary structure.15 In the present study, the superchiral field is used to probe the level of global orientational order in protein layers. Through numerical simulations to model the effects of anisotropic chiral layers, we are able to validate and rationalize the experimental results. Specifically, we demonstrate that the ability of superchiral fields to detect structural order is due to the sensitivity of the anisotropic electric dipole–magnetic dipole (ED–MD) response of a layer. The unique capabilities of the phenomenon are demonstrated using two exemplar systems. First, the evolution of structural order in immunoglobulin G (IgG) layers with increasing surface density is studied. Second, chiral fields are used to probe structural order within compositionally complex protein layers formed from serum. We show that chiral fields can detect changes in the structural order of serum-derived protein layers, caused by varying the IgG content. The ability of chiral fields to probe pathologically relevant protein layers points toward the utilization of the phenomenon in biosensing applications.
Results and Discussion
In this study, we have used a Au plasmonic metafilm deposited on nanopatterned polycarbonate to provide templated plasmonic substrates (TPS) that consist of “Shuriken”-shaped indentations (Figure 1), with either LH or RH six-fold rotational symmetry arranged in a square lattice.16 The nanoscopic indentations in the surface polycarbonate substrate have a depth of ∼80 nm, are 500 nm in diameter from arm to arm, and have a pitch of 700 nm. When gold is evaporated onto the surface, it takes the shape of the indentation and forms a hybrid plasmonic structure constituting an inverse structure at the top and a solid structure at the bottom (see Supporting Information section 3.1 for more information).
Figure 1.
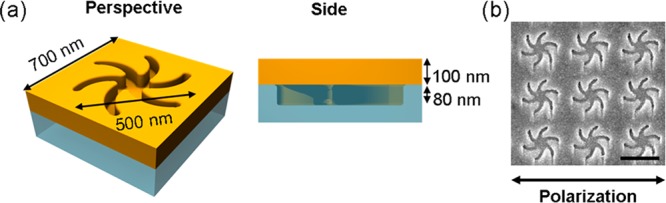
(a) Perspective and side views showing the dimensions of a single Shuriken nanostructure and its depth profile. (b) Electron microscopy images of a RH TPS of the nanostructure and polarization direction (for linear polarization conditions) of the incident light (scale bar represents 500 nm).
Optical Properties of the Metafilms
The optical properties of the metafilms immersed in water (buffer) have been experimentally measured and modeled in previous studies.17,18 The level of enhanced chirality (i.e., superchirality) of the near-field has been calculated, demonstrating that the handedness of the fields is governed by that of the plasmonic structures.15,16 Reflectance spectra from LH and RH metafilms immersed in buffer, measured by monitoring the scattering of linearly polarized light (shown in Figure 4 (top, black)), are similar to those observed previously. The spectra display a region of enhanced reflectivity that is an outcome of coupling between optical states supported by the plasmonic structure.17−23 The separation (S) of the two minima on either side of this reflectivity dip is used to parametrize the asymmetry of the effects of chiral dielectrics on the reflectance spectra. We derive a parameter from S:
| 1 |
where chiral/waterSLH/RH is the separation of the reflectance dips for LH (RH) structures in the presence of water (chiral dielectric). The hypothesis to be tested in this study is that the ΔΔS is sensitive to structural order within a dielectric layer.
Figure 4.

Experimental reflectance spectra (top) collected from LH (top) and RH (bottom) TPS exposed to buffer (black) and a biofluid (buffered IgG 1.5 mg mL–1, red/blue), which has formed a saturated, disordered layer. Electromagnetic simulations (bottom) of an equivalent system, implementing an isotropic chiral layer with ξxx = ξyy, = ξzz = 1.7 × 10⁻⁴ to act as the IgG layer. ΔΔS values for each are given. To aid comparison, the protein layer spectra have been shifted so its first peak overlaps those collected from buffer.
IgG Layers
A system which displays coverage-dependent order has been chosen to test the sensitivity of ΔΔS to structural order within protein. Specifically, the simple model system used is layers of IgG adsorbed onto a negatively charged (carboxylate, COO–-terminated) self-assembled monolayers (SAMs), formed on the TPS substrates. The antibody IgG is one of the abundant serum proteins (see Table 2 for information about the physiochemical properties of abundant blood proteins) and is the only one that has a net positive charge at serum pH (i.e., the protein surface has regions of both positive and negative charges albeit with the former in excess); it has an isoelectric point of ∼8.3.24,25 This protein provides an ideal model system because IgG adsorption onto a negatively charged (COO–-terminated) SAM has been studied previously both experimentally and theoretically.6,26,27 These previous studies indicate that IgG adsorbs relatively strongly onto COO–-terminated SAMs, due to its net positive charge. The reported experimental data and Monte Carlo simulation indicate that in a saturated layer IgG adopts a range of orientations on a COO–-terminated surface.
Table 2. Physiochemical Parameters for the Four Most Abundant Serum Proteins.
| serum protein | molecular weight (kDa) | concentration in serum (mg/mL) | isoelectric point |
|---|---|---|---|
| human serum albumin | 66.5 | 37.20 | 5.4–5.8 |
| immunoglobulin G | 150.0 | 9.17 | 6.6–10.0 (mean 8.3) |
| immunoglobulin A | 385.0 | 1.80 | 4.5–6.8 |
| transferrin | 80.0 | 2.36 | 5.8–6.2 |
Shifts in the wavelength of the plasmonic resonance (the first peak, i.e., minima of the reflectivity dip toward the lower wavelengths) are used to monitor IgG adsorption onto the anionic surface. The sensitivity of plasmonic resonances to the local refractive index of the near-field is well-established and is routinely exploited for quantifying adsorption.28 In the case of LH and RH chiral structures, a change in refractive index, caused by adsorption, results in red shifts ΔλLH and ΔλRH in the plasmonic resonances. If the adsorbed material is achiral, ΔλLH = ΔλRH, whereas for chiral analytes, ΔλLH ≠ ΔλRH. Thus, the average shift [ΔλAV = (ΔλLH + ΔλRH)/2] in the position of the plasmonic resonances relative to buffer, equivalent to the change of the effective refractive index of the surroundings, is used to quantify the amount of material adsorbed on the nanostructured surface.28 Hence, a plot of ΔλAV against IgG solution concentration (mg mL–1) is an adsorption isotherm for the system (Figure 2 (top)). The isotherms for IgG and the other biofluids studied can be fitted to a modified Langmuir model, which was developed for adsorption in heterogeneous environments.29 The kinetic model from which the modified Langmuir isotherm was derived assumes that bonding affinity decreases with increasing surface coverage. The expression for the isotherm has been formulated to obtain the maximum average wavelength shift (ΔλAVMAX), which is proportional to protein layer thickness at saturation; ΔλAVMAX = 4.0 ± 0.1 nm for buffered IgG.
Figure 2.

Adsorption isotherm (top) with associated fit (red line) and structural isotherm (bottom) with a guide for the eye added (red line) for buffered IgG solutions derived from ΔλAV and ΔΔS values.
A plot of ΔΔS versus IgG concentration (mg mL–1) shown in Figure 2 (bottom)—henceforth, such a plot will be referred to as a “structural isotherm”—shows a rise to a maximum value and then a fall before saturation of the layer. The reduction in ΔΔS implies an increase in structural disorder of adsorbed IgG before the saturation of the protein layers. This reduction is consistent with the modified Langmuir model used to fit the adsorption isotherms that, along with the form of the structural isotherm, can be explained by a microscopic picture (Figure 3). This behavior is also consistent with previously proposed analysis based on simulation and modeling.6 Initially, IgG will adsorb in the most energetically favorable type of site; when these sites are fully occupied, other less energetically favorable ones are then filled. Hence, with increasing coverage, the heterogeneity of the protein adsorption site/geometry increases, leading to higher levels of structural disorder. It is important to note that for achiral materials ΔΔS = 0 (Supporting Information 1.1), thus unlike other optical phenomena which monitor dielectric properties (e.g., surface plasmon resonance (SPR) and ellipsometry), the ΔΔS parameter is inherently sensitive to (chiral) structure rather than layer thickness.
Figure 3.
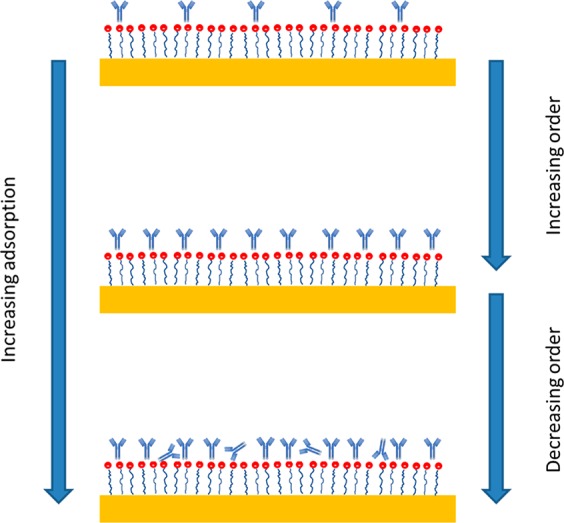
Illustration showing the decrease in structural disorder with increasing adsorption of IgG.
In previous studies, asymmetries in the position of resonances in optical rotatory dispersion (ORD) spectra13,15,16,18 or circular dichroism (CD),14 ΔΔλ, have been used to parametrize the asymmetries in the interaction of biomaterials with chiral near-fields. Plots of ΔΔλ derived from ORD spectra are shown in Supporting Information section 1.2. The presence of the protein layers causes asymmetries in the shifts in ORD resonances which are consistent with the behavior of ΔΔS plots. In this study, we have focused on ΔΔS rather than ΔΔλ because the former parameter is dominated by coupling strength between the optical states.18 In contrast, the ΔΔλ parameter arises from asymmetries in both coupling strength and phase.17,18
Numerical EM Simulations
To validate that ΔΔS is sensitive to anisotropic structure, IgG experimental and numerical simulated spectra were compared. Specifically, experimental ΔΔS values were compared with those derived from numerical EM simulated spectra for anisotropic and isotropic layers.
We first introduce the framework required to model isotropic and anisotropic chiral layers surrounding chiral plasmonic structures. The effect of chiral dielectric media on optical properties is modeled using the constitutive equations for a chiral medium:
| 2 |
| 3 |
Here, ε0 is the permittivity of free space, εr is the relative permittivity, μ0 is the permeability of free space, μr is the relative permeability, E is the complex electric field, B is the complex magnetic flux density, H is the magnetic field, D is the electric displacement field, and ξ is a second-rank tensor describing the chiral property of a molecular layer. ξ, the chirality tensor, is only nonzero for a chiral dielectric. The sign of tensor elements ξij (i, j = x, y, and z) is defined by the handedness of the chiral dielectric.
For an isotropic chiral medium, optical activity is only derived from electric dipole–magnetic dipole interactions. In this case, only the diagonal elements of the chirality tensor, ξiso, are nonzero, with
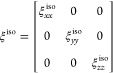 |
4 |
| 5 |
In this work, we need to simulate the effects of an anisotropic chiral dielectric layer. Specifically, we wish to replicate a layer of adsorbed biomolecules which adopt a well-defined orientation with respect to the surface but are rotationally isotropic (i.e., the layer has C∞ symmetry). There are important differences between the chiral properties of anisotropic and isotropic media, which affects the form of the ξ tensor. Theron and Cloete30 proposed the following tensor ξaniso for anisotropic chiral medium with C∞ symmetry:
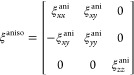 |
6 |
The diagonal elements account for the ED–MD contribution to optical activity, but the elements are no longer equal with
| 7 |
The diagonal elements for isotropic and anisotropic tensors are related by
| 8 |
The element ξxyani accounts for the electric dipole–electric quadrupole (ED–EQ) contribution to optical activity which is ≠0 for anisotropic media.30
Estimates for the relative magnitudes of the individual values of the ξijani tensor elements can be made using the following assumptions. From previous work on CD from proteins oriented in membranes (lipid layers),31 it can be estimated that ξzz/ξxxani ≳ 10. Also the relative size of the ED–EQ contribution can be derived from32
| 9 |
where rmol and D are the size of the molecule and spatial extent of the near-fields, respectively. For proteins and the nanostructures studied, the ratio is ∼0.1.
We can assume that the saturated IgG layer formed at the highest concentration (1.5 mg mL–1) is completely structurally disordered (i.e., isotropic). The experimental and simulated spectra and the tensor elements used for the simulation are shown in Figure 4 and Table 1, respectively. Other details on the method used to generate the simulations are in Supporting Information section 2.1. From the isotropic tensor elements, one can derive the expected values for an anisotropic form of the dielectric using eq 8 and the following assumptions: ξzzani/ξxx ≃ 10 and ξxyani/ξxx ≃ 0.1. Spectra simulated using these derived ξani tensor elements are shown in Figure 5. The ΔΔS values for the anisotropic dielectric, 1.33 nm, are within experimental error of the maximum value obtained for the IgG layer, thus providing prima facie validation of the sensitivity of strength of coupling between modes of the resonator to the anisotropic structure of a surrounding biomaterial layer. To assess the relative contributions of the ED–MD and ED–EQ interactions, simulations have been performed neglecting the ξxyani in the ξani tensor, giving a ΔΔS value of 1.30 nm. This small difference in the two ΔΔS values (0.03 nm) clearly demonstrates that ED–EQ only has a minor contribution to the observed asymmetry. This is consistent with previous theoretical studies of the role of ED–EQ interactions in plasmonic enhanced CD of oriented molecules.32,33 As would be expected from eq 9, the ED–EQ term only makes a significant contribution to CD in the case where a nanostructure dimension is of similar size (∼1 nm) to the molecule33 and makes a much smaller contribution when larger structures are considered.32,34
Table 1. Values for Components of the ξ Tensor Used for the Isotropic and Anisotropic Chiral Layers in the Electromagnetic Simulations and Their Associated ΔΔS Values, along with the Experimental ΔΔS Values with Buffered IgGa.
| dipole–dipole (ED–MD) (ξxx, ξyy, ξzz) | dipole–quadrupole (ED–EQ) (ξxy, ξyx) | ΔΔS (nm) simulation | ΔΔS (nm) experimental | |
|---|---|---|---|---|
| isotropic | ξxx = ξyy, = ξzz = 1.7 × 10⁻⁴ | ξxy = ξyx = 0 | 0.92 ± 0.10 | 1.00 ± 0.10 |
| anisotropic | ξxx = ξyy, = 1 × 10⁻⁵, ξzz = 5 × 10⁻⁴ | ξxy = ξyx = 0 | 1.30 ± 0.10 | 1.40 ± 0.10 |
| ξxx = ξyy, = 1 × 10⁻⁵, ξzz = 5 × 10⁻⁴ | ξxy = ξyx = 5 × 10⁻⁵ | 1.33 ± 0.10 |
ΔΔS for the anisotropic layer with and without the ED–EQ contribution is given for the simulations.
Figure 5.

Experimental reflectance spectra (top) collected from LH (top) and RH (bottom) TPS exposed to buffer (black) and a biofluid (buffered IgG 0.15 mg mL–1, red/blue), which has formed a highly ordered layer. Electromagnetic simulations (bottom) of an equivalent system, implementing an anisotropic chiral layer with ξxx = ξyy, = 1 × 10⁻⁵, ξzz = 5 × 10⁻⁴ and ξxy = ξyx = 5 × 10⁻⁵ to act as the IgG layer. ΔΔS values for each are given. To aid comparison, the protein layer spectra have been shifted so its first peak overlaps those collected from buffer.
Serum Layers
We now turn to the application of chiral fields monitoring structural order in multicomponent protein layers derived from blood serum, a complex biofluid left after the removal of cells and clotting factors from blood. Human serum contains >20 000 different proteins that span 9 decades of concentration with an overall protein concentration of ∼1 mM (∼60 mg mL–1). Human serum albumin (HSA) is the most abundant of the serum proteins in human serum with a concentration of ∼37.2 mg mL–1, but IgG also has a high abundancy, with a typical concentration of ∼9.2 mg mL–1. For comparative purposes, we have also studied the adsorption of buffered HSA on to the COO-terminated SAM layers and found no detectable adsorption over the range of concentrations used. This is consistent with previous work on related bovine serum albumin, which was found to have an affinity to COO-terminated SAMs significantly lower than that for IgG26,27 due to electrostatic repulsion between the negatively charged HSA and surface. Thus, we propose that the protein layers formed will have a complex, unknown composition of serum proteins depleted in HSA but enriched in IgG relative to its abundancy in serum. The influence of spiking the serum with increasing amounts of IgG on the structural order of the serum protein layers was probed. It is assumed that the relative amounts of IgG within the adsorbed serum layer will increase with its concentration in solution.
For the pure serum adsorption isotherm (Figure 6A), the ΔλAVMAX of 3.7 ± 0.1 nm is smaller than the value obtained for the buffered IgG solution (4.0 ± 0.1 nm). This difference indicates that the protein layer formed by blood serum is less dense than that produced by the buffered IgG solution. Given that the majority of other abundant serum proteins have molecular weights much lower than that of IgG (see Table 2), the ΔλAVMAX value is consistent with the multicomponent composition of the serum-adsorbed layer. The structural isotherm plots (Figure 6B) for serum display qualitatively similar behavior to IgG: a rise and then fall before saturation of the layer. However, in contrast to the buffered IgG solution, the maximum ΔΔS value is smaller (0.4 ± 0.1 nm compared to 1.4 ± 0.1 nm) and falls to zero at saturation. This reduction in maximum ΔΔS for serum is consistent with the proposed model of increasing adsorption, leading to greater structural disorder. We speculate that the reduced magnitude of ΔΔS is in part due to the greater structural disorder, compared to pure IgG, of the compositionally heterogeneous serum layers. Also, as the chirality tensor represents an intrinsic molecular property, the elements of the ξani and the ξiso tensors could, on average, be smaller for the serum proteins compared to that for IgG.
Figure 6.

(A) Adsorption isotherms with associated fits (red lines) and (B) structural isotherms with added guides for the eye (red lines) for serum and IgG spiked serum are shown. The amount of serum protein, which is IgG, is given in brackets, and the absolute increase in IgG with respect to serum is also given. (C) ΔΔS values obtained at the highest concentrations, i.e., ΔΔSSAT, for the IgG spiked serum.
Adsorption and structural isotherms for IgG spiked serum are shown in Figure 6A,B. Spiking blood serum with IgG causes an increase in the ΔλAVMAX value (Figure 6A), indicating this increase is indicative of enhanced IgG content in the protein layer. IgG spiking has a significant effect on the form of the structural isotherms (Figure 6B). In particular, the ΔΔS value (Figure 6C) at the highest serum concentration, that is, close to layer saturation, referred to as ΔΔSSAT, shows a systematic change with increasing IgG content. Initially, spiking causes an increase in the relative amount of IgG within the protein layer, leading to greater compositional homogeneity and thus a higher level of structural order. However, beyond a certain point of spiking, higher IgG content leads to a decrease in structural order.
The selectivity of the structure of serum layers formed on the COO-terminated SAM layers to IgG content was assessed by spiking with other abundant serum proteins: HSA, transferrin, and immunoglobulin A (IgA). The three proteins have net negative charges, and hence the serum layers spiked with them will still be enriched with IgG. Adsorption and structural isotherms for IgA, HSA, and transferrin spiked serum are shown in Figure 7A,B, respectively. The ΔλAVMAX values for transferrin and HSA spiked serum of 3.4 ± 0.1 and 3.5 ± 0.1 nm, respectively, are smaller than that for pure serum, which is indicative of the fact that the introduction of HSA and transferrin lowers the average molecular weight of the proteins in the serum (Table 2). In contrast, spiking with IgA, the heaviest abundant protein, increases the average molecular weight of the serum proteins resulting in a ΔλAVMAX value of 4.2 ± 0.1 nm, which is higher than that observed for pure serum. The structural isotherms (Figure 7B) obtained for IgA, transferrin, and HSA are identical within experimental error to that of blood serum, indicating that the added proteins have no significant effect on the structural order of the protein layer.
Figure 7.

(A) Adsorption isotherms for serum spiked with 0.05 mg mL–1 of HSA, IgA, and transferrin along with associated fits (red line). (B) Structural isotherms corresponding to the serum (spiked with HSA, IgA, and transferrin) adsorption isotherms. The structural isotherms for serum and serum spiked IgG (17% total IgG) are also shown for comparison.
In summary, the work presented demonstrates the ability of superchiral fields generated by plasmonic nanostructures to probe global protein structural order in complex multicomponent biological layers. This interrogation is not possible with established state of the art techniques. Numerical modeling was used to establish that the dominant cause of asymmetric coupling between modes in chiral plasmonic structure, and hence, the sensitivity to structural order is the anisotropic ED–MD response of a dielectric layer. Thus, in contrast to known phenomena, which monitor a molecular spectroscopic fingerprint, there is no necessity for either labeling or prior knowledge of interface composition. The work provides clear evidence for the potential of a superchiral field for the characterization of real complex biological interfaces and also possible applications in biosensing.
Methods
Fabrication of Templated Plasmonic Substrates
The templated substrates were prepared by injection molding as described previously.16,35 Clean silicon substrates were coated with ∼80 nm of PMMA (Elvacite 2041, Lucite International) and exposed in a Vistec VB6 UHR EWF lithography tool operating at 100 kV. After exposure, the substrates were developed, and a 300 μm thick nickel shim was formed through electroplating. The shim is then mounted in a custom-made tool capable of manufacturing ASA standard polymer slides. An Engel Victory Tech 28 ton injection molding machine was used in fully automatic production mode in the manufacture of the polymer slides using polycarbonate (Makrolon DP2015) as feedstock. Polycarbonate is known to best replicate the nanofeatures and is commonly used in the industry for optical storage media. The injection molded substrates have the chiral nanostructures imparted in the plastic surface and are subsequently covered by a continuous 100 nm Au film to complete the TPS process.
Measurement of Optical Spectra
We have used a custom-built polarimeter that measures the reflected light from our samples. It uses a tungsten halogen light source (Thorlabs), polarizers (Thorlabs), and a 10× objective (Olympus). The samples are positioned with the help of a camera (Thorlabs, DCC1645C), and the spectrum is measured using a compact spectrometer (Ocean Optics USB4000). Using Stokes methods, we can measure the intensity of light at four angles of the analyzer and calculate the optical properties of our chiral plasmonic arrays. Reflectivity measurements used plain Au as a background. The errors were determined from the deviation of eight measurements.
Nitrilotriacetic Acid Functionalization
To functionalize the gold substrate surface, a thiolated nitrilotriacetic acid (NTA) monolayer was adsorbed, using an adapted process previously described in the literature.33 First, the gold substrates are cleaned in an oxygen plasma cleaner for 20 s at 160 W before being immersed in a 95% ethanol solution and bubbled with nitrogen. A 0.2 mM NTA (Prochimia Surfaces) solution in 95% ethanol is made, and the clean gold substrates are then placed into the thiol solution and bubbled with nitrogen gas for a further 5 min. After bubbling with nitrogen, the substrates are left in the thiol solution to incubate overnight (16–20 h), which allows for the formation of a SAM on the substrate surface. The samples are removed from the thiol solution before being rinsed with 95% ethanol and then incubated in 1 mM sodium hydroxide for 5 min. Finally, the samples are removed and rinsed with ∼1 mL of HEPES buffered saline (10 mM HEPES and 150 mM NaCl in water at pH 7.2) and then ∼5 mL of water before being dried under a stream of nitrogen.
Serum and Spiked Serum
Stock serum solutions with a total protein concentration of 60 mg mL–1 were produced by dissolving lyophilized human blood serum (ERM certified reference material, Sigma-Aldrich) in distilled water. Serum (both unspiked and spiked) solutions with concentrations ranging from 3 to 3 × 10⁻⁴ mg mL–1 were produced by diluting the stock serum solutions with 10 mM pH 7.4 Tris buffer. Spiked serum samples were produced by adding the relevant protein to a stock serum solution diluted to 3 mg mL–1. Spiked IgG was produced by adding 0.025, 0.05, 0.100, 0.175, and 0.250 mg of the protein per milliliter of serum stock solution diluted to 3 mg mL–1. Subsequently, an amount of buffer was added to each spike solution to give solutions with an overall concentration of 3 mg mL–1; this provided solutions with 16.1, 17.0, 18.6, 21.1, and 23.6% of IgG by mass. Transferrin, HSA, and IgA spiked serum were produced by adding 0.05 mg of protein per milliliter of stock serum solution diluted to 3 mg mL–1. Once again, an amount of buffer was added to each spiked solution to give solutions with an overall concentration of 3 mg mL–1. All the spiked solutions were then diluted with buffer to produce the required protein concentration.
Acknowledgments
The authors acknowledge financial support from the Engineering and Physical Sciences Research Council (EP/K034936/1, EP/P00086X/1, and EP/S001514/1), National Science Foundation (Grant CHE-1307021), JSPS Core to Core (EP/M024423/1), and technical support from the James Watt Nanofabrication Centre (JWNC). C.K. thanks the Carnegie Trust for the award of scholarship. R.T. thanks the EPSRC for the award of scholarship, and V.R. acknowledges support from the National Institutes of Health (GM077173).
Supporting Information Available
The Supporting Information is available free of charge on the ACS Publications website at DOI: 10.1021/jacs.8b03634.
Asymmetry (ΔΔS) for salt solution, asymmetry (ΔΔλ) IgG, EM simulations, chirality plots from simulation, chirality calculation of ξ, templated plasmonic substrates: fabrication and properties (PDF)
The authors declare no competing financial interest.
Supplementary Material
References
- Roy S.; Covert P. A.; FitzGerald W. R.; Hore D. K. Biomolecular Structure at Solid-Liquid Interfaces As Revealed by Nonlinear Optical Spectroscopy. Chem. Rev. 2014, 114 (17), 8388–8415. 10.1021/cr400418b. [DOI] [PubMed] [Google Scholar]
- Onfelt B.; Lincoln P.; Norden B.; Baskin J. S.; Zewail A. H. Femtosecond linear dichroism of DNA-intercalating chromophores: Solvation and charge separation dynamics of [Ru(phen)(2)dppz](2+) systems. Proc. Natl. Acad. Sci. U. S. A. 2000, 97 (11), 5708–5713. 10.1073/pnas.100127397. [DOI] [PMC free article] [PubMed] [Google Scholar]
- Lee J. E.; Saavedra S. S. Molecular orientation in heme protein films adsorbed to hydrophilic and hydrophobic glass surfaces. Langmuir 1996, 12 (16), 4025–4032. 10.1021/la960253z. [DOI] [Google Scholar]
- Malmsten M. Ellipsometry Studies of Protein Adsorption at Lipid Surfaces. J. Colloid Interface Sci. 1994, 168 (1), 247–254. 10.1006/jcis.1994.1416. [DOI] [Google Scholar]
- Adamczyk Z. Modeling adsorption of colloids and proteins. Curr. Opin. Colloid Interface Sci. 2012, 17 (3), 173–186. 10.1016/j.cocis.2011.12.002. [DOI] [Google Scholar]
- Zhou J.; Chen S. F.; Jiang S. Y. Orientation of adsorbed antibodies on charged surfaces by computer simulation based on a united-residue model. Langmuir 2003, 19 (8), 3472–3478. 10.1021/la026871z. [DOI] [Google Scholar]
- Dufrene Y. F. Using nanotechniques to explore microbial surfaces. Nat. Rev. Microbiol. 2004, 2 (6), 451–460. 10.1038/nrmicro905. [DOI] [PubMed] [Google Scholar]
- Schaferling M.; Dregely D.; Hentschel M.; Giessen H. Tailoring Enhanced Optical Chirality: Design Principles for Chiral Plasmonic Nanostructures. Phys. Rev. X 2012, 2 (3), 031010. 10.1103/PhysRevX.2.031010. [DOI] [Google Scholar]
- Hendry E.; Mikhaylovskiy R. V.; Barron L. D.; Kadodwala M.; Davis T. J. Chiral Electromagnetic Fields Generated by Arrays of Nanoslits. Nano Lett. 2012, 12 (7), 3640–3644. 10.1021/nl3012787. [DOI] [PMC free article] [PubMed] [Google Scholar]
- Hentschel M.; Schaferling M.; Duan X. Y.; Giessen H.; Liu N. Chiral plasmonics. Sci. Adv. 2017, 3 (5), e1602735. 10.1126/sciadv.1602735. [DOI] [PMC free article] [PubMed] [Google Scholar]
- Kramer C.; Schaferling M.; Weiss T.; Giessen H.; Brixner T. Analytic Optimization of Near-Field Optical Chirality Enhancement. ACS Photonics 2017, 4 (2), 396–406. 10.1021/acsphotonics.6b00887. [DOI] [PMC free article] [PubMed] [Google Scholar]
- Jack C.; Karimullah A. S.; Leyman R.; Tullius R.; Rotello V. M.; Cooke G.; Gadegaard N.; Barron L. D.; Kadodwala M. Biomacromolecular Stereostructure Mediates Mode Hybridization in Chiral Plasmonic Nanostructures. Nano Lett. 2016, 16 (9), 5806–5814. 10.1021/acs.nanolett.6b02549. [DOI] [PubMed] [Google Scholar]
- Jack C.; Karimullah A. S.; Tullius R.; Khorashad L. K.; Rodier M.; Fitzpatrick B.; Barron L. D.; Gadegaard N.; Lapthorn A. J.; Rotello V. M.; Cooke G.; Govorov A. O.; Kadodwala M. Spatial control of chemical processes on nanostructures through nano-localized water heating. Nat. Commun. 2016, 7, 10946. 10.1038/ncomms10946. [DOI] [PMC free article] [PubMed] [Google Scholar]
- Hendry E.; Carpy T.; Johnston J.; Popland M.; Mikhaylovskiy R. V.; Lapthorn A. J.; Kelly S. M.; Barron L. D.; Gadegaard N.; Kadodwala M. Ultrasensitive detection and characterization of biomolecules using superchiral fields. Nat. Nanotechnol. 2010, 5 (11), 783–787. 10.1038/nnano.2010.209. [DOI] [PubMed] [Google Scholar]
- Tullius R.; Karimullah A. S.; Rodier M.; Fitzpatrick B.; Gadegaard N.; Barron L. D.; Rotello V. M.; Cooke G.; Lapthorn A.; Kadodwala M. ″Superchiral″ Spectroscopy: Detection of Protein Higher Order Hierarchical Structure with Chiral Plasmonic Nanostructures. J. Am. Chem. Soc. 2015, 137 (26), 8380–8383. 10.1021/jacs.5b04806. [DOI] [PubMed] [Google Scholar]
- Karimullah A. S.; Jack C.; Tullius R.; Rotello V. M.; Cooke G.; Gadegaard N.; Barron L. D.; Kadodwala M. Disposable Plasmonics: Plastic Templated Plasmonic Metamaterials with Tunable Chirality. Adv. Mater. 2015, 27 (37), 5610–5616. 10.1002/adma.201501816. [DOI] [PubMed] [Google Scholar]
- Kelly C.; Khosravi Khorashad L.; Gadegaard N.; Barron L. D.; Govorov A. O.; Karimullah A. S.; Kadodwala M. Controlling Metamaterial Transparency with Superchiral Fields. ACS Photonics 2018, 5 (2), 535–543. 10.1021/acsphotonics.7b01071. [DOI] [Google Scholar]
- Tullius R.; Platt G. W.; Khosravi Khorashad L.; Gadegaard N.; Lapthorn A. J.; Rotello V. M.; Cooke G.; Barron L. D.; Govorov A. O.; Karimullah A. S.; Kadodwala M. Superchiral Plasmonic Phase Sensitivity for Fingerprinting of Protein Interface Structure. ACS Nano 2017, 11 (12), 12049–12056. 10.1021/acsnano.7b04698. [DOI] [PMC free article] [PubMed] [Google Scholar]
- Liu N.; Langguth L.; Weiss T.; Kastel J.; Fleischhauer M.; Pfau T.; Giessen H. Plasmonic analogue of electromagnetically induced transparency at the Drude damping limit. Nat. Mater. 2009, 8 (9), 758–762. 10.1038/nmat2495. [DOI] [PubMed] [Google Scholar]
- Zhang S.; Genov D. A.; Wang Y.; Liu M.; Zhang X. Plasmon-induced transparency in metamaterials. Phys. Rev. Lett. 2008, 101 (4), 047401. 10.1103/PhysRevLett.101.047401. [DOI] [PubMed] [Google Scholar]
- Yin X. H.; Schaferling M.; Metzger B.; Giessen H. Interpreting Chiral Nanophotonic Spectra: The Plasmonic Born-Kuhn Model. Nano Lett. 2013, 13 (12), 6238–6243. 10.1021/nl403705k. [DOI] [PubMed] [Google Scholar]
- Deutsche C. W.; Lightner D. A.; Woody R. W.; Moscowitz A. Optical Activity. Annu. Rev. Phys. Chem. 1969, 20, 407–488. 10.1146/annurev.pc.20.100169.002203. [DOI] [Google Scholar]
- Tassin P.; Zhang L.; Zhao R. K.; Jain A.; Koschny T.; Soukoulis C. M. Electromagnetically Induced Transparency and Absorption in Metamaterials: The Radiating Two-Oscillator Model and Its Experimental Confirmation. Phys. Rev. Lett. 2012, 109 (18), 187401. 10.1103/PhysRevLett.109.187401. [DOI] [PubMed] [Google Scholar]
- Prin C.; Bene M. C.; Gobert B.; Montagne P.; Faure G. C. Isoelectric Restriction of Human-Immunoglobulin Isotypes. Biochim. Biophys. Acta, Gen. Subj. 1995, 1243 (2), 287–289. 10.1016/0304-4165(94)00187-3. [DOI] [PubMed] [Google Scholar]
- Jin Y.; Luo G. A.; Oka T.; Manabe T. Estimation of isoelectric points of human plasma proteins employing capillary isoelectric focusing and peptide isoelectric point markers. Electrophoresis 2002, 23 (19), 3385–3391. . [DOI] [PubMed] [Google Scholar]
- Silin V.; Weetall H.; Vanderah D. J. SPR studies of the nonspecific adsorption kinetics of human IgG and BSA on gold surfaces modified by self-assembled monolayers (SAMs). J. Colloid Interface Sci. 1997, 185 (1), 94–103. 10.1006/jcis.1996.4586. [DOI] [PubMed] [Google Scholar]
- Chen S. F.; Liu L. Y.; Zhou J.; Jiang S. Y. Controlling antibody orientation on charged self-assembled monolayers. Langmuir 2003, 19 (7), 2859–2864. 10.1021/la026498v. [DOI] [Google Scholar]
- Anker J. N.; Hall W. P.; Lyandres O.; Shah N. C.; Zhao J.; Van Duyne R. P. Biosensing with plasmonic nanosensors. Nat. Mater. 2008, 7 (6), 442–453. 10.1038/nmat2162. [DOI] [PubMed] [Google Scholar]
- Sibbesen E. Some New Equations to Describe Phosphate Sorption by Soils. J. Soil Sci. 1981, 32 (1), 67–74. 10.1111/j.1365-2389.1981.tb01686.x. [DOI] [Google Scholar]
- Theron I. P.; Cloete J. H. The electric quadrupole contribution to the circular birefringence of nonmagnetic anisotropic chiral media: A circular waveguide experiment. IEEE Trans. Microwave Theory Tech. 1996, 44 (8), 1451–1459. 10.1109/22.536028. [DOI] [Google Scholar]
- Burck J.; Wadhwani P.; Fanghanel S.; Ulrich A. S. Oriented Circular Dichroism: A Method to Characterize Membrane Active Peptides in Oriented Lipid Bilayers. Acc. Chem. Res. 2016, 49 (2), 184–192. 10.1021/acs.accounts.5b00346. [DOI] [PubMed] [Google Scholar]
- Zhang H.; Govorov A. O. Giant circular dichroism of a molecule in a region of strong plasmon resonances between two neighboring gold nanocrystals. Phys. Rev. B: Condens. Matter Mater. Phys. 2013, 87 (7), 075410. 10.1103/PhysRevB.87.075410. [DOI] [Google Scholar]
- Zhang W. X.; Wu T.; Wang R. Y.; Zhang X. D. Surface-Enhanced Circular Dichroism of Oriented Chiral Molecules by Plasmonic Nanostructures. J. Phys. Chem. C 2017, 121 (1), 666–675. 10.1021/acs.jpcc.6b09435. [DOI] [Google Scholar]
- Tang Y. Q.; Cohen A. E. Optical Chirality and Its Interaction with Matter. Phys. Rev. Lett. 2010, 104 (16), 163901. 10.1103/PhysRevLett.104.163901. [DOI] [PubMed] [Google Scholar]
- Gadegaard N.; Mosler S.; Larsen N. B. Biomimetic polymer nanostructures by injection molding. Macromol. Mater. Eng. 2003, 288 (1), 76–83. 10.1002/mame.200290037. [DOI] [Google Scholar]
Associated Data
This section collects any data citations, data availability statements, or supplementary materials included in this article.