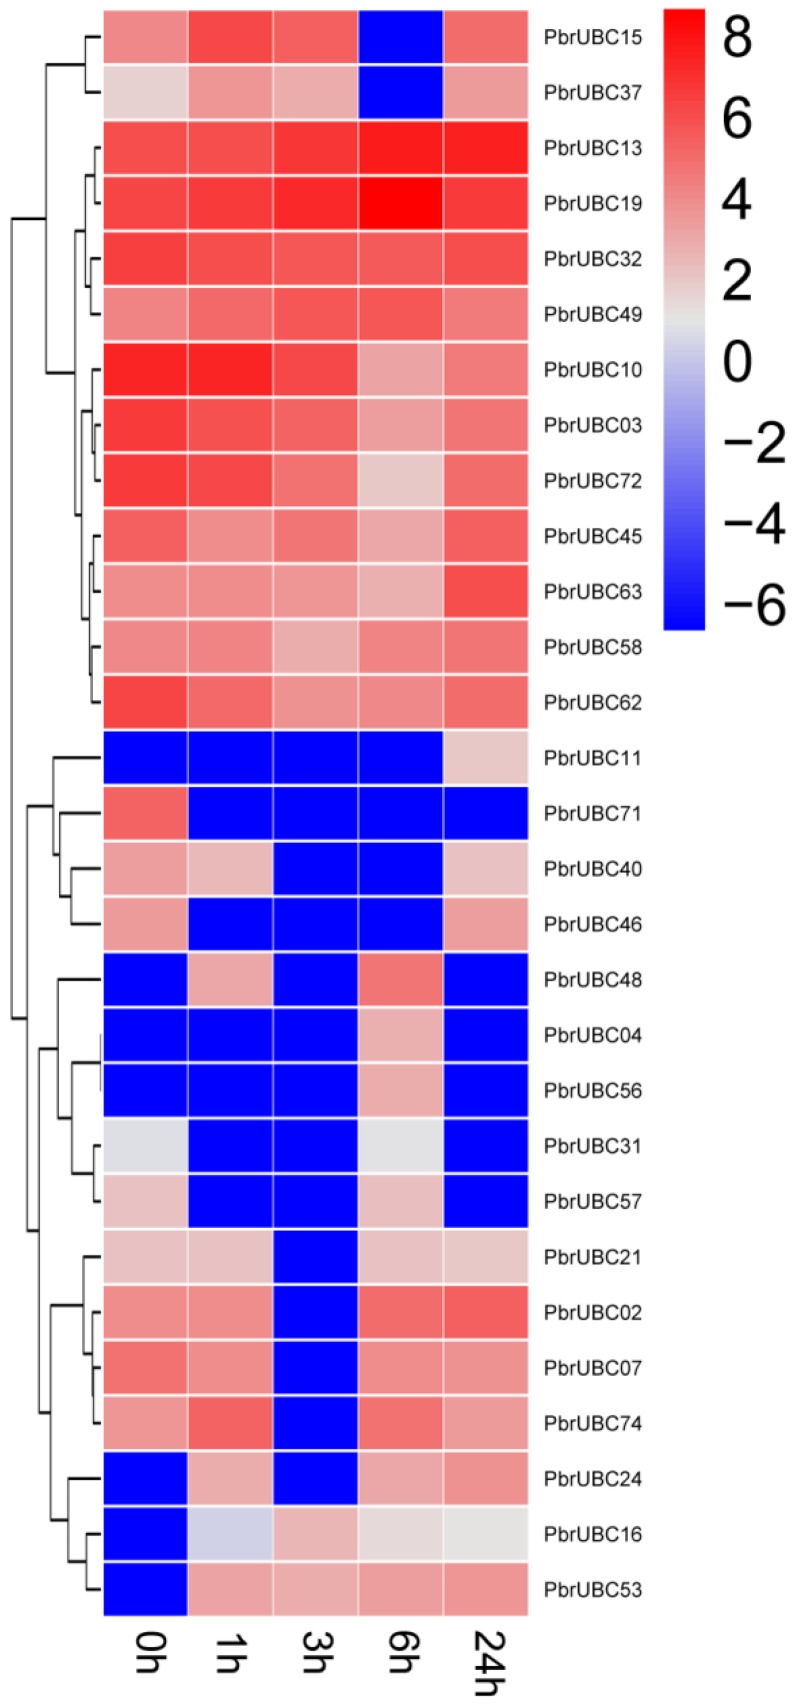
Figure 6.
Expression analysis of PbrUBC genes under drought stress treatment. The color scale represents normalized log 2-transformed, where grey indicates a medium level, blue indicates a low level, and red indicates a high level. The treatments were indicated at the bottom of each column, and the genes are located on the right.

