Abstract
Poly(ADP-ribose)polymerase (PARP) inhibitors have emerged as potent antitumor drugs. Here, we describe the intrinsic fluorescence properties of the clinically approved PARP inhibitor rucaparib and its potential to directly measure drug distribution and target engagement—a critical factor for understanding drug action and improving efficacy. Methods: We characterized the photophysical properties of rucaparib and determined its quantum yield and lifetime. Using confocal microscopy and flow cytometry, we imaged the intracellular distribution of rucaparib and measured uptake and release kinetics. Results: Rucaparib has an excitation/emission maximum of 355/480 nm and a quantum yield of 0.3. In vitro time-lapse imaging showed accumulation in cell nuclei within seconds of administration. Nuclear rucaparib uptake increased with higher PARP1 expression, and we determined an intracellular half-life of 6.4 h. Conclusion: The label-free, intrinsic fluorescence of rucaparib can be exploited to interrogate drug distribution and target binding, critical factors toward improving treatment efficacy and outcome.
Keywords: PARP1, rucaparib, fluorescence imaging, indole chromophore, drug-target interactions
Inhibitors of the DNA repair enzymes Poly(ADP-ribose)polymerase (PARP) 1/2 recently gained clinical approval by the Food and Drug Administration for the treatment of certain ovarian cancers (olaparib, rucaparib, niraparib). Simultaneously, companion diagnostics for PARP inhibitors (PARPi) are in early clinical evaluation (NCT03085147, NCT02469129, NCT03334500, NCT02637934, NCT03083288). Companion diagnostics can become powerful tools that enable patient selection, treatment planning, treatment monitoring, and diagnostic and intraoperative imaging (1). In contrast to whole-body imaging, which is predominantly based on radiolabeled PARPi, the development of fluorescent PARPi enables the interrogation of the intratumoral and intracellular distribution, shedding light on their subcellular pharmacokinetics (2). Heretofore, the development of companion PARP imaging agents has required conjugation to a detectable fluorophore. The resulting modified compound is a new chemical entity, which will exhibit nonidentical properties compared with the parent PARPi. For example, the optically active PARPi derived from olaparib, PARPi-FL, maintains its cell-penetrating and specific target-binding properties but has a higher molecular weight (640 vs. 435 g/mol) and a slightly lower affinity (12.2 vs. 5 nM) (3).
In contrast, the clinically approved PARPi rucaparib features intrinsic fluorescence, enabling direct imaging of the actual drug without any structural modifications. Rucaparib has a molecular weight of 323 g/mol and a PARP1 Ki of 1.4 nM (4). Rucaparib, unlike many other PARPi, has an indole chromophore embedded in its structure. This chromophore is similar to that of the intrinsically fluorescent amino acid tryptophan, which has been used to study peptides and proteins (5). In this study, we characterize the fluorescence properties of rucaparib and explore its potential to measure PARP1 expression, drug delivery, and drug-target interactions.
MATERIALS AND METHODS
Spectroscopy
Stock solutions of rucaparib in 1× Dulbecco’s phosphate-buffered saline and N-acetyl-l-tryptophanamide (NATA; Sigma-Aldrich) in water and were made at 100 μM concentrations. UV-visible spectra of rucaparib and NATA at 5 different concentrations were obtained on a Perkin-Elmer Lambda 35 UV-vis spectrometer, scanning from 200 to 1,000 nm, in 1-nm increments with a slit width of 1 nm. Solutions were mixed directly in 1-cm path length quartz cuvettes, and these same cuvettes were used for steady-state and time-correlated fluorescence measurements.
Steady-state fluorescence emission and excitation spectra were obtained on a HORIBA Scientific FluoroLog-3 fluorometer. All spectra were corrected by dividing by the wavelength-dependent lamp intensity reference signal, and further baseline-corrected using the spectra of the pure solvents. For both the NATA and the rucaparib samples, emission spectra were obtained using a 290-nm (1-nm slit width) excitation wavelength and scanning from 300 to 1,000 nm (5-nm slit width). The NATA excitation spectra were obtained at an emission wavelength of 400 nm (1-nm slit width), scanning from 200 to 390 nm (5-nm slit width). Rucaparib excitation spectra were obtained similarly, but monitoring emission wavelengths of 450 and 500 nm.
Fluorescence quantum yields were calculated using the slopes of the gradient plots of fluorescence intensity versus absorbance for the rucaparib and NATA samples, according to Equation 1.
| Eq. 1 |
To determine the fluorescence lifetime of rucaparib, time-correlated single-photon counting (TCSPC) measurements were recorded with the FluoroHub Tau-3 module for the same fluorometer, using a diode laser source (NanoLED-405) with a pulse duration less than 200 ps. The excitation wavelength was set to 395 nm (slit-width 5 nm), and the emission wavelength was set to 450 or 500 nm (both with 5-nm slit widths) to obtain 2 separate measurements for each sample concentration. The recorded decay was fit to a monoexponential function using the Decay Analysis Software (version 6.4) provided with the instrument.
Cell Culture
We used different tumor cell lines to evaluate rucaparib binding across a variety of tumor types and PARP1 expression levels. Cells were cultivated in monolayer culture at 37°C in a 5% CO2 humidified atmosphere, following standard procedures. They were maintained in their respective growth medium (Roswell Park Memorial Institute medium for M21, JHU-LX22, 4T1; McCoy’s for HT-29; Dulbecco modified Eagle medium for OV90; and minimum essential medium for U87), containing 10% (v/v) fetal bovine serum and 1% penicillin/streptavidin.
Time-Lapse Imaging
HT-29 cells were grown in poly-l-lysine–coated μ-slides (Ibidi). On a confocal microscope, equipped with a heated incubation chamber providing 5% CO2, time-lapse imaging was initiated using a 405-nm laser for excitation and a 420- to 480-nm emission filter, with an image acquisition setting of 5-s intervals for a total of 10 min. At 15 s, rucaparib was added to the medium to a final concentration of 5 μM, and after 5 min rucaparib-containing medium was removed, fresh medium was added, and imaging was continued for another 5 min. To determine specificity of the uptake, M21 cells were grown on poly-l-lysine–coated μ-slides and imaged on a SP8 confocal microscope for 60 min. Field-of-views were set up to be recorded in adjacent wells to simultaneously observe rucaparib uptake with and without blocking with a 10-fold molar excess of olaparib. FIJI was used for image analysis.
Confocal Microscopy in Different Cell Lines
To observe rucaparib binding in different cell lines, HT-29, OV90, M21, and U87 cells were grown in 8-well chamber slides and incubated with 5 μM rucaparib for 30 min, followed by a 10-min wash in culture medium. Cells were then fixed with 4% paraformaldehyde, nuclei were costained with the far-red fluorescent DNA dye DRAQ5, slides were mounted with Mowiol and imaged on an LSM 880 confocal microscope. To compare PARPi-FL and rucaparib uptake, cells were incubated with a mixture of both compounds at equal concentration (5 μM) for 30 min and processed as described above. To determine differences in rucaparib uptake over time in high and low PARP1-expressing cell lines, M21 and U87 cells were incubated for different durations (5 μM rucaparib for 5 or 40 min) or at different concentrations (0, 0.5, 1, 5, 10, and 25 μM rucaparib for 20 min). Rucaparib incubation was followed by a 10-min washing step in fresh media in all cases. All images were obtained using the same microscope setting and were set to identical window/level settings for rucaparib using FIJI.
Cryosection Imaging
Animals studies were done in accordance with the Institutional Animal Care and Use Committee. Athymic nude mice (n = 1 per cell line) were xenografted with 4T1 or M21 cells (2 mio cells per animal). After 7 days, animals were intravenously injected with 200 nmol of rucaparib and sacrificed 60 min later. Tumors were excised and split in 2 parts. One part was frozen in optimal-cutting-temperature (OCT) compound, and the other part was fixed in 4% paraformaldehyde before paraffin-embedding and immunohistochemical staining. We acquired 10-μm cryosections from the OCT block that were imaged using a confocal microscope. Rucarib was detected in the DAPI channel.
Immunohistochemistry
Immunohistochemical detection of PARP was carried out on FFPE-embedded 3-μm tumor sections using the automated Discovery XT processor (Ventana Medical Systems). After deparaffinization and antigen retrieval, anti–PARP1 antibody (0.2 μg/ml) was incubated for 5 h, followed by 1 h of incubation with biotinylated goat anti–rabbit IgG (PK6106; Vector Labs) at a 1:200 dilution. For immunohistochemistry detection, a DAB detection kit (Ventana Medical Systems) was used according to the manufacturer’s instructions. Sections were counterstained with hematoxylin and cover-slipped with Permount (Fisher Scientific).
Western Blot
PARP1 protein expression was measured with Western blot analysis. Proteins were isolated from cells, and 30 μg of protein per sample were separated with sodium dodecyl sulfate polyacrylamide gel electrophores and transferred to a nitrocellulose membrane. Proteins were detected using antibodies specific for PARP1 (1:1,000; sc-7150, Santa Cruz) and b-actin (1:2,000; A3854, Sigma-Aldrich) with a corresponding horseradish peroxidase–conjugated secondary antibody (1:10,000; sc-2004, Santa-Cruz). Detection was done using chemiluminescent substrate (Thermo Scientific #34077, SuperSignal West Pico).
Intracellular Half-Life of Rucaparib
JHU-LX22 cells (200,000 cells/well in 6-well plates seeded 24 h before were incubated with 0.2 μM rucaparib for 20 min at 37°C and washed for 10 min in medium. Then, fresh medium was added for a postincubation time of 0, 1, 2, 4, 8, 12, 24, or 48 h. Subsequently, cells were incubated with 0.2 μM PARPi-FL for 20 min at 37°C, followed by a 10-min wash in medium to allow for washout of unbound PARPi-FL. Then, cells were trypsinized, washed with flow buffer (1% bovine serum albumin [w/v] in phosphate-buffered saline), transferred to 5-mL flow cytometry tubes through the 40-μm cell strainer cap, and left on ice until flow cytometry (Fortessa II; BD Biosciences). Raw data were processed in FlowJo software to calculate rucaparib and PARPi-FL uptake per cell. Cell clumps and debris were eliminated using the corresponding gates (forward and side scatter) for the unstained cell population. Rucaparib fluorescence was measured in the DAPI channel, and PARPi-FL fluorescence was imaged in the fluorescein isothiocyanate channel. Data were analyzed as mean fluorescence intensity (MFI) or normalized MFI (nMFI). For rucaparib, 100% nMFI represents the MFI of rucaparib at 0 h. For the indirect measurement through PARPi-FL, the highest MFI value was defined as 100% and the nMFI of every time point was subtracted from 100. Decay curves were calculated with Prism using a 2-phase decay least-squares regression. The experiment was carried out 3 times (with technical triplicates).
RESULTS
Fluorescence Spectroscopy
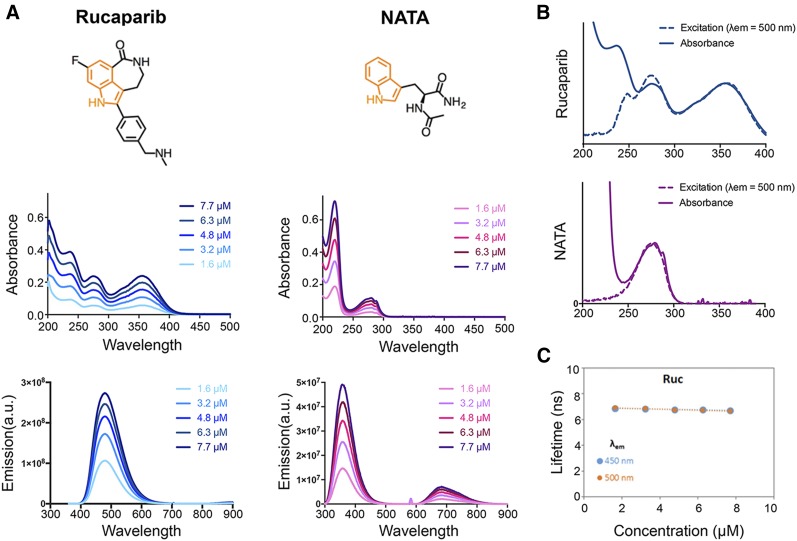
We characterized the intrinsic fluorescence of rucaparib in comparison to NATA, a neutral tryptophan analog, which served as reference standard. The structures and position of the indole chromophore of both molecules are displayed in Figure 1A.
FIGURE 1.
Spectroscopic characterization of rucaparib. (A) Chemical structures with highlighted indole chromophore (orange) and absorbance and emission spectra of rucaparib and NATA at 5 concentrations in water. (B) Fluorescence excitation spectra compared with absorbance (C) and fluorescence lifetime measurement of rucaparib at the emission wavelengths 450 and 500 nm in different concentrations in water.
The absorbance maxima for rucaparib at 275 and 355 nm and for NATA at 220 and 280 nm are independent of concentration, suggesting that fluorophore aggregation was negligible in μM concentrations in water (Fig. 1A). The NATA emission spectra (λex = 290 nm) has a major peak around 360 nm (6), consistent with other indoles, whereas the rucaparib emission (λex = 290 nm) peak is at 480 nm (Fig. 1A). The quantum yield for rucaparib is 0.30, which is significantly higher than NATA ( = 0.13 (7,8)). The excitation spectra of rucaparib matched the absorbance bands at 280 and 350 nm (Fig. 1B).
The fluorescence lifetime for rucaparib was measured as 6.8 ns, which is greater than the reported lifetimes of NATA and many other indole derivatives at a similar pH (6). We also observed a significant pH dependency for the photophysical properties of rucaparib (Supplemental Fig. 1; supplemental materials are available at http://jnm.snmjournals.org) that may afford other diagnostic capabilities and future studies on the interactions of rucaparib with PARP1 and other proteins.
Rucaparib Live Cell Imaging
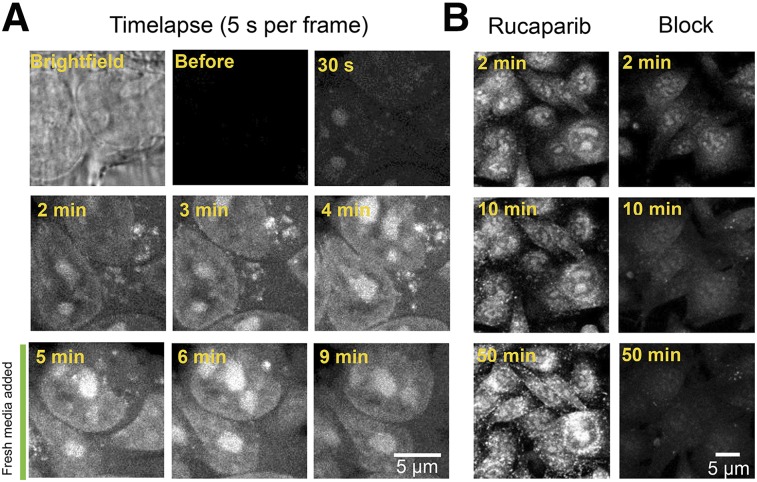
The rucaparib signal appeared within the cell nucleoli within 30 s of addition to the medium, followed by the nuclei, indicating that detectable concentrations were first reached in these compartments due to binding and accumulation (Fig. 2A; Supplemental Video 1). The cytoplasmic signal was low, with the exception of a punctate extranuclear uptake, which rapidly disappeared after washing (Fig. 2A). Specificity of the accumulation was confirmed by simultaneous addition of rucaparib and a blocking dose of nonfluorescent olaparib, which strongly reduced rucaparib accumulation (Fig. 2B).
FIGURE 2.
Live cell imaging of rucaparib uptake. (A) Single images from a time-lapse video of HT29 cells during incubation with 5 μM rucaparib allows observation of cell penetration and nuclear accumulation. (B) Uptake of rucaparib with and without block (rucaparib mixed with a 10-fold molar excess of olaparib) in M21 cells to show specificity of rucaparib uptake.
Characterization of Intracellular Rucaparib Uptake
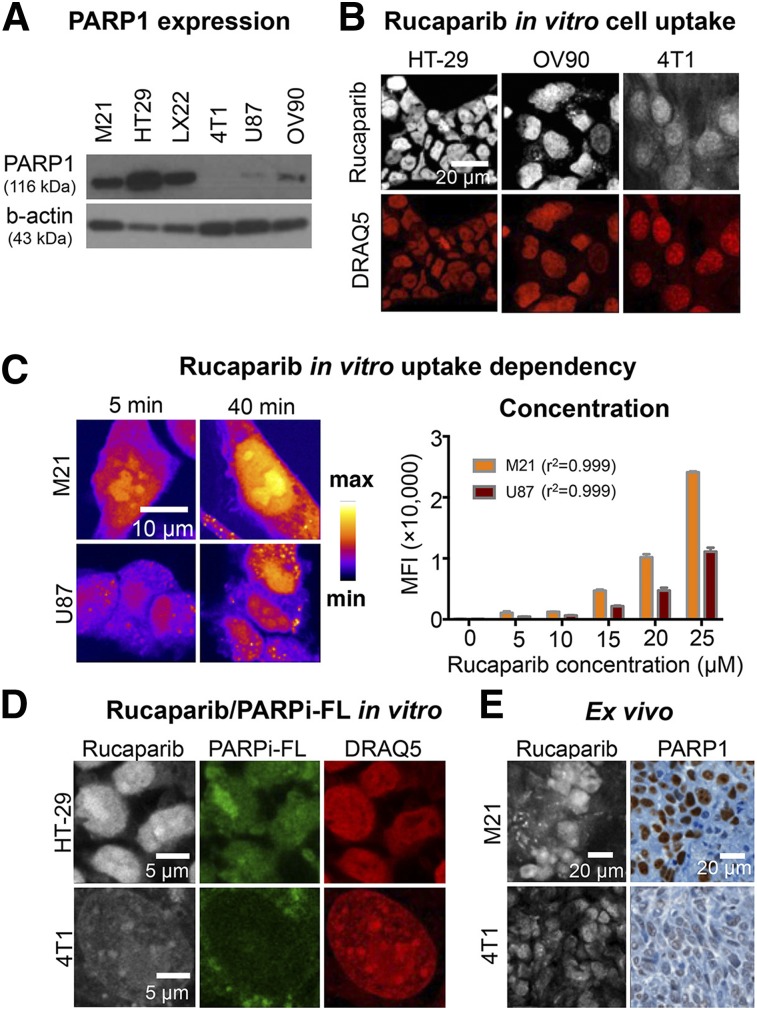
We characterized how rucaparib fluorescence can be used to visualize PARP1 expression levels in a set of cell lines (Fig. 3). First, we determined PARP1 expression levels for all cell lines via Western blot, which were from highest to lowest HT29, M21, JHU-LX22, OV90, U87, and 4T1 (Fig. 3A). In agreement with PARP1 protein expression levels, we identified high (HT29), intermediate (OV90), and low (4T1) rucaparib uptake using confocal microscopy (Fig. 3B). We further investigated the ability of rucaparib to distinguish between different PARP1 expression levels by varying either the incubation time (5 vs. 40 min) or the concentration (5 vs. 25 μM) in M21 and U87 cells. For both conditions, we found a stronger rucaparib signal increase in M21 cells, which express higher levels of PARP1 than U87 cells (Fig. 3C).
FIGURE 3.
Measurement of PARP1 expression using rucaparib. (A) Western blot of PARP1 protein content of investigated cell lines using anti–PARP1 antibody and β-actin as loading control. (B) Comparison of rucaparib binding in tumor cell lines HT29, OV90, and 4T1 after a 30-min incubation with 5 μM rucaparib. Nuclei were counterstained with DRAQ5, and cells were fixed before imaging. (C) Modulation of incubation time and incubation concentration in M21 (high-PARP1) and U87 (low-PARP1) cells. (D) Comparison of rucaparib and PARPi-FL uptake in HT29 and 4T1 cells after simultaneous incubation at 5 μM. Nuclei were counterstained with DRAQ5, and cells were fixed before imaging. Images of each channel are comparable due to identical window/level settings. (E) Rucaparib detection in cryosections of M21 or 4T1 tumor–bearing mice compared with PARP1 immunohistochemistry. Mice received intravenous injection of 200 nmol rucaparib and were sacrificed 60 min after injection.
Furthermore, we compared rucaparib uptake with the fluorescently labeled olaparib derivative, PARPi-FL, which has been previously validated to be quantitative for PARP1 expression (2). Coincubation of rucaparib and PARPi-FL led to overlapping signals of both compounds in cell nuclei, which was strong in HT29 cells (high PARP1) and weak in 4T1 cells (low PARP1) (Fig. 3D). This was also confirmed by imaging cryosections of M21 and 4T1 tumors that were excised 60 min after systemic injection of rucaparib. The strong rucaparib signal in M21 sections and the weak rucaparib signal in 4T1 sections were confirmed by concordant immunohistochemical PARP1 staining (Fig. 3D).
On-Target Binding Time of Rucaparib
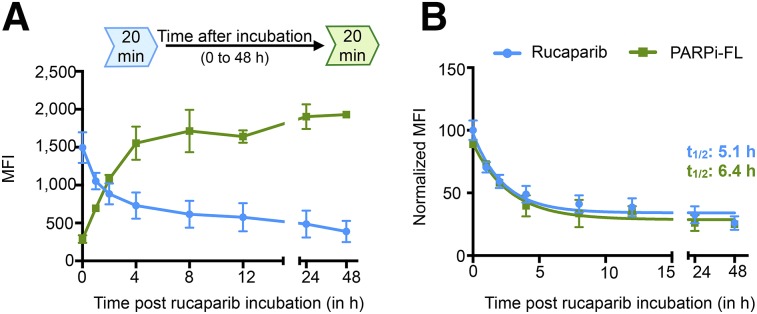
We measured how long rucaparib resides within a cell as readout for the inhibition of DNA repair. We determined the on-target binding time by directly measuring rucaparib and confirmed the results using the established PARP imaging agent PARPi-FL as control to indirectly measure rucaparib binding. We observed a 2-phase decay of the rucaparib signal over 48 h and a corresponding increase of the PARPi-FL signal since it can bind only to unoccupied binding sites (Fig. 4A). We calculated the on-target half-life of rucaparib for both methods and found similar half-lives of 5.1 h (direct) and 6.4 h (indirect) (Fig. 4B), confirming the possibility of measuring drug pharmacokinetics directly through rucaparib fluorescence.
FIGURE 4.
Quantification of intracellular retention of rucaparib. (A) Mean fluorescence intensities (MFI) of rucaparib and PARPi-FL over 48 h to observe clearance of rucaparib over time. (B) Normalized MFI to display on-target half-life of rucaparib measured directly via rucaparib or indirectly via PARPi-FL. Rucaparib and PARPi-FL were incubated at 0.2 μM. Decay curves were calculated with Prism using a 2-phase decay least-squares regression. Experiment was repeated 3 times with technical triplicates.
For validation of the results, we determined interactions between the 2 PARPi by measuring whether rucaparib binding was influenced by the presence of PARPi-FL and vice versa. We found that binding of rucaparib was not affected by PARPi-FL at the conditions used for determining the half-life of rucaparib. However, at longer incubation times and excess concentrations of PARPi-FL, rucaparib was released faster, which is in concurrence with the fact that both compounds compete for the same binding site. A similar effect was observed when PARPi-FL incubation was followed by rucaparib (Supplemental Fig. 2).
Taken together, these experiments show the potential to measure the intracellular dynamics and target interaction of rucaparib using its intrinsic fluorescence.
DISCUSSION
The PARPi rucaparib has recently been approved for the treatment of ovarian cancer and is in late-stage clinical trials of a variety of tumor types. In this study, we report that the intrinsic fluorescence signal of rucaparib allows the direct visual investigation of the PARP-dependent intracellular binding properties and distribution at the subcellular level. Notably, this is the clinically used drug without any structural modifications or conjugations.
The fluorescence of rucaparib arises from the core indole chromophore motif, similar to tryptophan. The increased quantum yield and lifetime are likely due to the fused 7-member heterocyclic amide, which enhances structural rigidity and thereby dampens vibrational relaxation to the ground state. Several factors contribute to the substantial redshift observed in the absorption and emission spectra relative to tryptophan. The fluorine and amide moieties inductively withdraw electron density from the aromatic ring, whereas the latter can also partially conjugate to it through resonance. Additionally, the minimum energy conformation of the phenyl substituent may have a dihedral angle close to 45°, similar to biphenyl, which could substantially perturb the photophysical properties (9). The redshifted absorption and emission of rucaparib permit the use of conventional excitation sources (355, 405 nm) in microscopes and flow cytometers, whereas its higher quantum yield allows for more sensitive detection of the fluorescence signal. Similar to tryptophan, rucaparib exhibits pH-dependent fluorescent properties that can be used to further explore the nature of the binding pocket and intermolecular interactions.
We demonstrate that rucaparib uptake imaging assays clearly distinguish between cells and xenografts expressing high levels and low levels of PARP1 without the need of laborious and expensive staining procedures or labeling. Furthermore, the ability to directly measure dynamics of rucaparib uptake and clearance can have important implications in the evaluation of clinical studies involving rucaparib. Interestingly, live cell imaging revealed a pattern of extranuclear uptake of rucaparib, potentially due to secondary target-binding effects (10).
CONCLUSION
The possibility of direct rucaparib imaging offers a broad variety of clinically relevant applications, which can complement whole-body imaging of radioactively labeled PARP imaging agents (1,11). This includes an in-depth investigation of off-target binding effects and establishing rucaparib as an ex vivo tool during clinical studies to monitor intracellular drug levels, for example, in liquid cancers. Furthermore, heterogeneity of drug delivery, which is a potential source for resistance to PARPi therapy, can be investigated at a high spatial resolution using rucaparib imaging.
There are ongoing clinical trials to evaluate rucaparib, including breast cancer, ovarian cancer, fallopian tube cancer, pancreatic cancer, and prostate cancer. The identification of patients who will most likely benefit from rucaparib therapy and the optimization of treatment regimens will be of critical importance to improve outcomes for patients.
DISCLOSURE
This work was supported by National Institutes of Health grants NIH R01CA204441 (to Thomas Reiner), R21CA191679 (to Thomas Reiner), and P30 CA008748. We thank the Center for Molecular Imaging and Nanotechnology, the Tow Fellowship Program in Molecular Imaging and Nanotechnology (for support to Brandon Carney and Susanne Kossatz), the National Science Foundation Integrative Graduate Education and Research Traineeship 0965983, and CHE-161-755 (to Charles M. Drain). No other potential conflict of interest relevant to this article was reported.
Supplementary Material
REFERENCES
- 1.Carney B, Kossatz S, Reiner T. Molecular imaging of PARP. J Nucl Med. 2017;58:1025–1030. [DOI] [PMC free article] [PubMed] [Google Scholar]
- 2.Thurber GM, Yang KS, Reiner T, et al. Single-cell and subcellular pharmacokinetic imaging allows insight into drug action in vivo. Nat Commun. 2013;4:1504. [DOI] [PMC free article] [PubMed] [Google Scholar]
- 3.Irwin CP, Portorreal Y, Brand C, et al. PARPi-FL: a fluorescent PARP1 inhibitor for glioblastoma imaging. Neoplasia. 2014;16:432–440. [DOI] [PMC free article] [PubMed] [Google Scholar]
- 4.Rouleau M, Patel A, Hendzel MJ, Kaufmann SH, Poirier GG. PARP inhibition: PARP1 and beyond. Nat Rev Cancer. 2010;10:293–301. [DOI] [PMC free article] [PubMed] [Google Scholar]
- 5.Chen Y, Barkley MD. Toward understanding tryptophan fluorescence in proteins. Biochemistry. 1998;37:9976–9982. [DOI] [PubMed] [Google Scholar]
- 6.Eftink MR, Jia J, Hu D, Ghiron CA. Fluorescence studies with tryptophan analogs: excited state interactions involving the side chain amino group. J Phys Chem. 1995;99:5713–5723. [Google Scholar]
- 7.Muiño PL, Callis PR. Solvent effects on the fluorescence quenching of tryptophan by amides via electron transfer: experimental and computational studies. J Phys Chem B. 2009;113:2572–2577. [DOI] [PubMed] [Google Scholar]
- 8.Chen RF. Fluorescence quantum yields of tryptophan and tyrosine. Anal Lett. 1967;1:35–42. [Google Scholar]
- 9.Johansson MP, Olsen J. Torsional barriers and equilibrium angle of biphenyl: reconciling theory with experiment. J Chem Theory Comput. 2008;4:1460–1471. [DOI] [PubMed] [Google Scholar]
- 10.Knezevic CE, Wright G, Rix LLR, et al. Proteome-wide profiling of clinical PARP inhibitors reveals compound-specific secondary targets. Cell Chem Biol. 2016;23:1490–1503. [DOI] [PMC free article] [PubMed] [Google Scholar]
- 11.Makvandi M, Xu K, Lieberman BP, et al. A radiotracer strategy to quantify PARP-1 expression in vivo provides a biomarker that can enable patient selection for PARP inhibitor therapy. Cancer Res. 2016;76:4516–4524. [DOI] [PMC free article] [PubMed] [Google Scholar]
Associated Data
This section collects any data citations, data availability statements, or supplementary materials included in this article.


