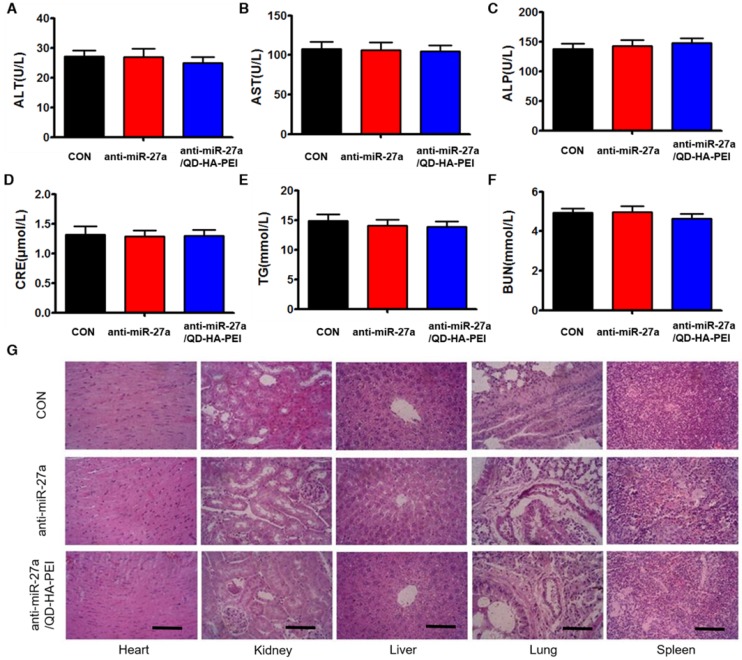
Figure 10.
Assessment of the systemic side effects after treatment. Serum biochemistry indexes of mice in each group, including (A) ALT, (B) AST, (C) ALP, (D) CRE, (E) BUN, and (F) TG. (G) Representative H&E-stained images of heart, kidney, liver, lung and spleen from mice in each group; scale bars represent 100 µm.

