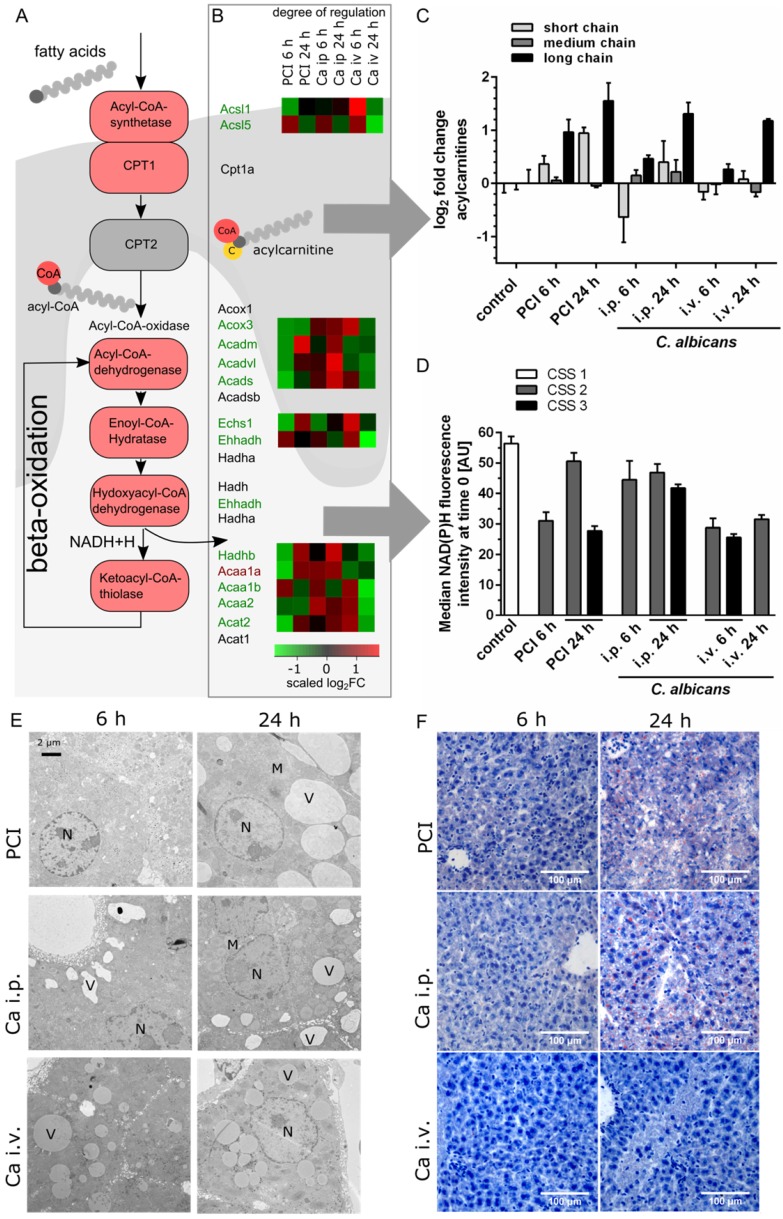
Figure 4.
Transcriptomics, metabolomics and microscopy revealed defects in lipid metabolism. (A) Schematic outline of fatty acid activation, transport and metabolism. Corresponding genes from the interaction network are depicted. (B) Genes involved in fatty acid degradation are overall downregulated; genes that are up- or downregulated in all groups are marked by a red or green gene symbol. A heat map shows the scaled relative changes within the downregulation. (C) Distribution of different acylcarnitine chain-length for all groups and timepoints. Values shown as Log2FC of the sum of short-chain (C2-C8), medium-chain (C6-C10) and long-chain (C14-C22) acylcarnitines, as classified by Ikeda et al. 24 (D) Effects on energy metabolism are depicted by NAD(P)H fluorescence in liver tissue at the first timepoint using time-lapse intravital imaging. Subgroups are separated by the respective clinical severity score (CSS) of the animals. (E) Representative electron micrographs demonstrating a morphologic assessment of liver ultrastructure. Pathogen and route of infection leads to different patterns of lipid accumulation. 3000x magnification (Nucleus (N), mitochondria (M), vesicles (V)). (F) Sudan III-staining of representative histological sections of murine liver depict tissue and lipid accumulation after PCI and C. albicans infection.

