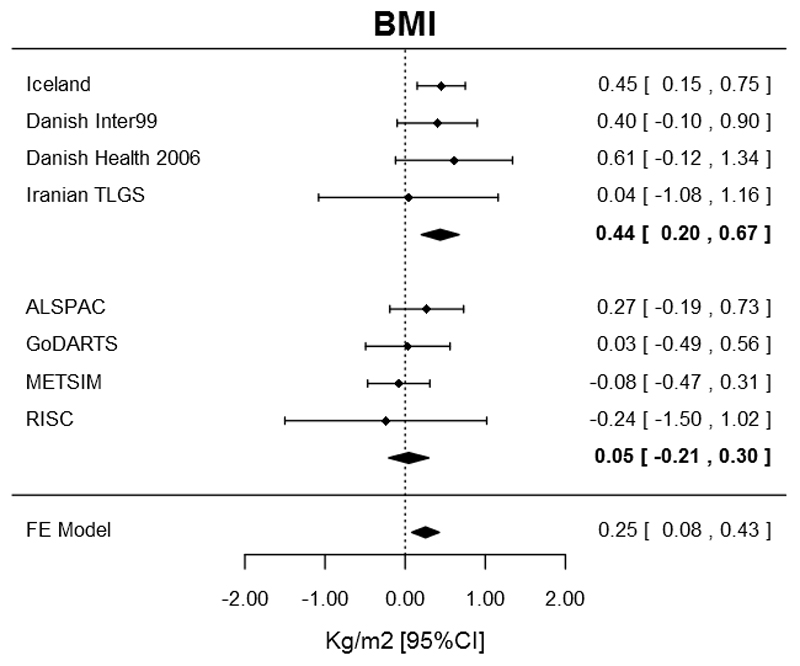
Figure 2.
Forest plot of the association between the CCND2 rs76895963 low frequency allele and BMI including eight studies with no, or limited, ascertainment or enrichment for or against type 2 diabetes. These eight studies included four from the original paper, including Decode individuals and a sample of GoDARTs individuals made to consist of 5% diabetic cases. The dashed line indicates null effect. The top, middle and bottom diamonds represent the effect size (center of diamond) and 95% confidence intervals (horizontal ends) from the discovery studies, replication studies and overall meta-analysis; respectively.

