 Archived sample contains Ca2+-dependent lipopeptides active against Gram-positive bacteria; conformers of aspartocin B in DMSO solution were studied by 2D NMR.
Abstract
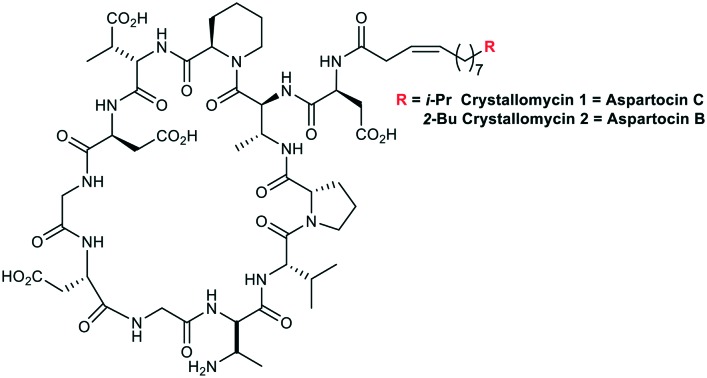
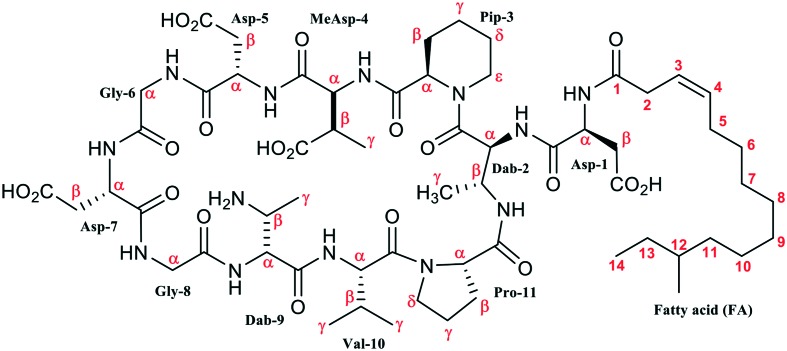
The study of an archived sample of crystallomycin complex using HPLC, ESI HRMS, and 2D NMR showed that two major components of the antibiotic, compounds 1 and 2, are lipopeptides having the same peptide core, Asp1-cyclo(Dab2-Pip3-MeAsp4-Asp5-Gly6-Asp7-Gly8-Dab9-Val10-Pro11-), N-acylated either with Δ3-iso-tetradecenoyl or Δ3-anteiso-pentadecenoyl that are identical to aspartocins C and B, respectively. According to the 2D NMR study, compound 2 in DMSO solution exists as a mixture of four conformers. The producing strain was identified as Streptomyces griseorubens. Compounds 1 and 2 have considerable Ca2+-dependent activity against Gram-positive bacteria including five MRSA strains.
1. Introduction
Lipopeptide antibiotics were discovered in the ‘golden era’ of 1950–60s, however, their structure elucidation took several subsequent decades.1 Crystallomycin was reported by Gause and co-workers in 1957 and named after its ability to crystallize from ethanol.2 Two years later, a chemical study3 appeared where a conclusion was made that crystallomycin is very similar, if not identical, to amphomycin,4 discovered a few years before. However, direct microbiological comparison5 of crystallomycin and amphomycin showed the same activity spectrum, but incomplete cross-resistance, thus suggesting these two antibiotics are not identical. No further chemical study of crystallomycin was reported. At present, interest in amphomycin-type antibiotics re-emerged, because they are considered to be good precursors in development of novel therapeutic agents against multidrug resistant Gram-positive pathogens.6 Here we report the study of an archived sample of crystallomycin.
2. Results and discussion
2.1. Identification and activity studies
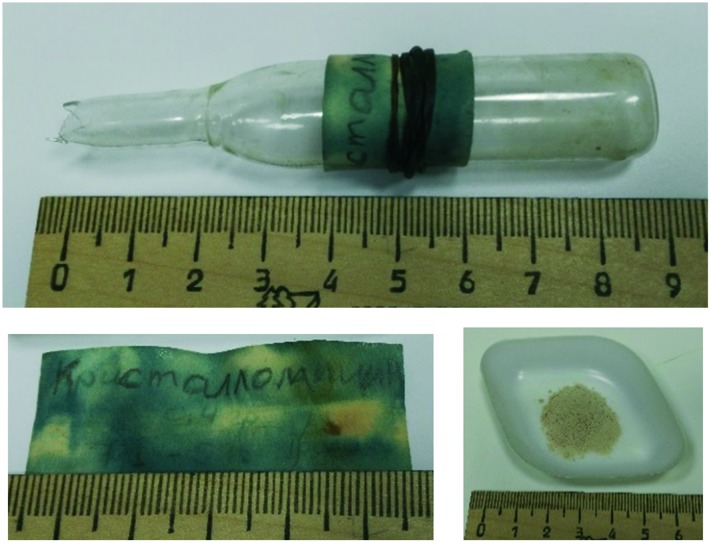
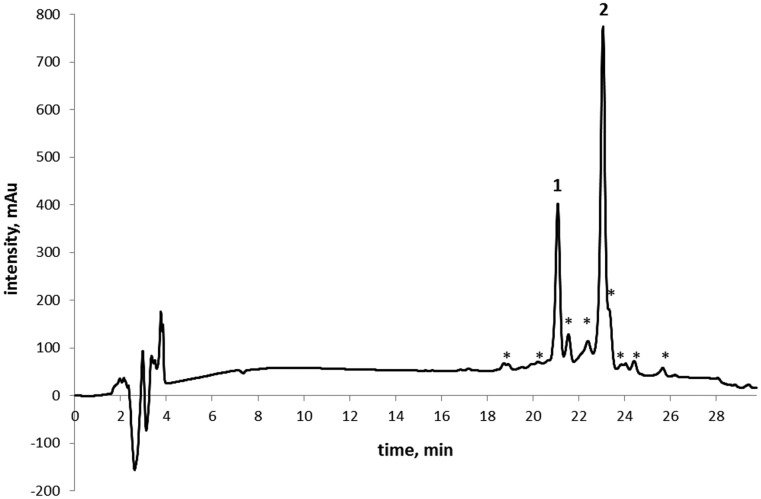
The sealed glass ampoule containing a crystallomycin sample isolated 60 years ago was found in the antibiotic collection of the Gause Institute of New Antibiotics (Moscow, Russia). The sample, stored in a refrigerator at 0…+5 °C, is a loose, off-white powder (Fig. 1). Its HPLC analysis indicated a mixture of two major and several minor components (Fig. 2).
Fig. 1. The ampoule (above), its label and the antibiotic sample (below); the label says (in Russian): “Crystallomycin 0.4 g 7/I-57”.
Fig. 2. HPLC profile of crystallomycin complex.
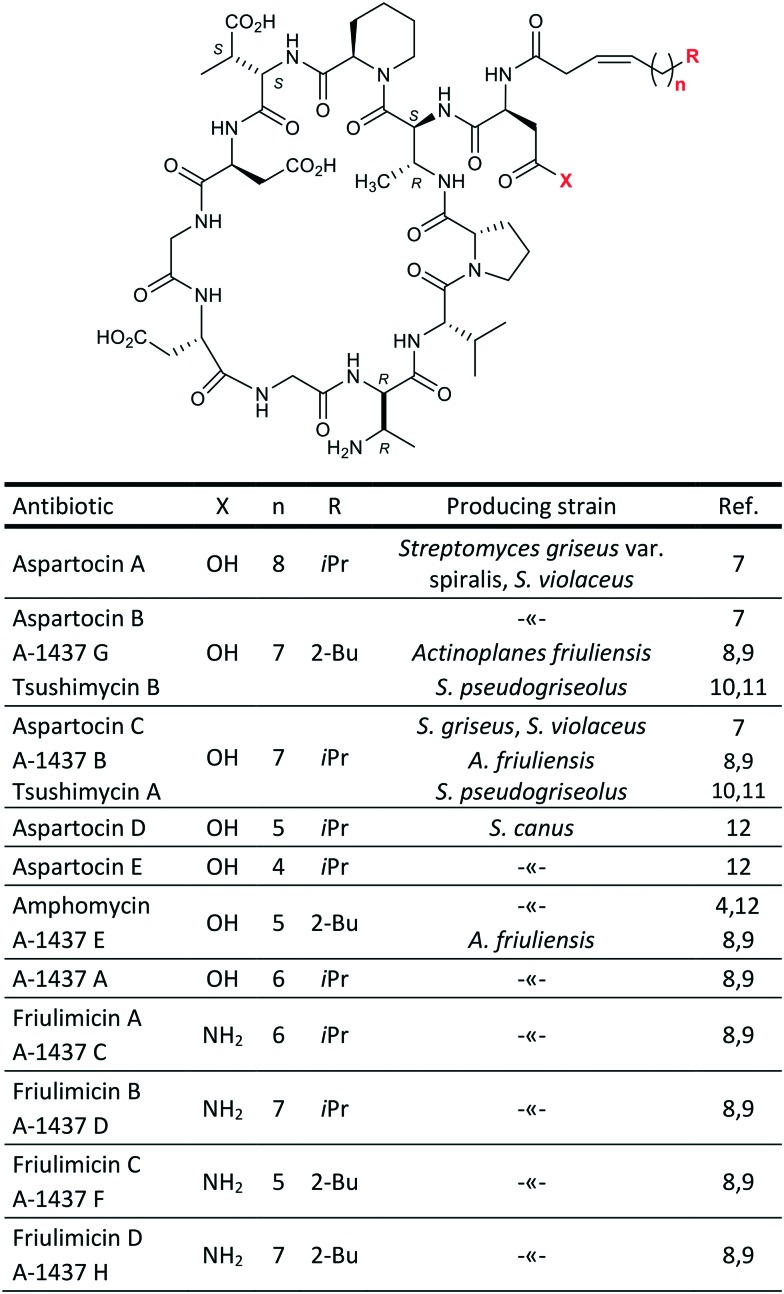
Both major compounds were isolated using semi-preparative HPLC; 5.6 mg of 1 and 17.3 mg of 2 (also named Cryst-1 and Cryst-2 in below NMR studies) were obtained. ESI HRMS analysis gave the following m/z values: 1304.6731, [1 + H]+; 1326.6550, [1 + Na]+; 1348.6373, [1 – H + 2Na]+; 1318.6894, [2 + H]+; 1340.6703, [2 + Na]+. The mass of 1 is similar to that reported for aspartocin C, while the mass of 2 is similar to that of aspartocins A and B (within 1 ppm difference). Aspartocins are acidic antibiotics of the amphomycin family (Fig. 3).
Fig. 3. Antibiotics of the amphomycin family.
The cyclopeptide structure of the two main representatives of this type of antibiotics – friulimicin B and aspartocin C – was correctly described for the first time only in 2000 using 2D NMR techniques.9 For a long time before the revision, a linear structure with a C-terminal diketopiperazine moiety had been assigned to amphomycin by Bodanszky.13 For some related compounds, e.g. zaomycin,14 glumamycin,15 parvulines,16 and antibiotic 33,17 described as similar to amphomycin, the unambiguous structure is still to be determined. Tsushimycin, an antibiotic isolated from culture S. pseudogriseolus, contains at least two different types of fatty acid moieties.18 Nevertheless, authors of the paper10 referred only to one component as ‘tsushimycin’. To highlight the difference, we use designations A and B in Fig. 3 for these lipopeptides.
Next, crystallomycins 1 and 2 were examined using various 1D and 2D NMR techniques.19 Sequential 1H assignment was done using a standard approach based on combination of 2D TOCSY and NOESY spectra.20 The study revealed the identity of compound 2 to aspartocin B (A-1437 G/tsushimycin B) and of compound 1 to aspartocin C (A-1437 B/tsushimycin A); see section 2.2 below.
Crystallomycin producing strain 00887 was isolated in 1955. It was stored in Gause Institute strain collection (as Actinomyces violaceoniger INA 00887). 16S rRNA gene sequence revealed that the strain belongs to genus Streptomyces and species S. griseorubens. The nucleotide sequence of 16S rRNA gene of the Streptomyces griseorubens strain was submitted to NCBI under GeneBank accession number MG200163 and phylogenetic analysis was carried out (Fig. 4).
Fig. 4. Phylogenetic tree of strain INA 00887 on the basis of 16S rRNA gene sequence. Scale –5 nucleotide substitutions per 10 000 nucleotides. Bootstrap values (%) were calculated from 100 trees.
The HPLC-MS analysis of extract from freshly prepared fermentation broth shows the presence of two peaks fully identical with 1 and 2 from authentic sample (Fig. S6†).
Compounds 1 and 2 show activity towards Gram-positive bacteria, including methicillin- and vancomycin-resistant strains (Table 1), and no activity towards Gram-negative bacteria, yeasts and fungi. Both compounds exhibit strong increase of activity in calcium-adjusted media (2–8-fold decrease in MIC). This is a common feature of calcium-dependent lipopeptides.
Table 1. Minimum inhibitory concentrations (MIC) of crystallomycins 1 and 2 against Gram-positive bacteria, μg mL–1.
| Microorganism | Antimicrobial
a
|
||||
| Cub | 1(Ca2+) | 1 | 2(Ca2+) | 2 | |
| S. aureus ATCC 29213 | 0.5 | 4 | 16 | 2 | 4–8 |
| MRSA 86 | 1 | 4 | 16 | 2 | 8 |
| MRSA 88 | 0.5–1 | 4 | 16 | 2 | 8 |
| MRSA 71001 | 0.5–1 | 4 | 16 | 2 | 8 |
| MRSA 20450 | 1 | 2 | 16 | 1–2 | 8 |
| MRSA 17 | 2 | 4 | nd b | 4 | 8 |
| S. epidermidis C2001 (MR) | 1 | 4 | 16 | 2 | 4–8 |
| S. epidermidis 004-T1 (MR) | 1 | 4 | 32 | 4 | 16 |
| S. epidermidis 20459 (MR) | 1 | 4 | nd | 4 | nd |
| E. faecalis ATCC 29212 | 4 | 8 | nd | 8 | 16 |
| E. gallinarum VP4147 | 8 | 4–8 | nd | 4–8 | 16 |
aCub – cubicin (daptomycin); (Ca2+) – in the presence of calcium ions (1.25 mM).
bnd – not determined.
2.2. NMR studies
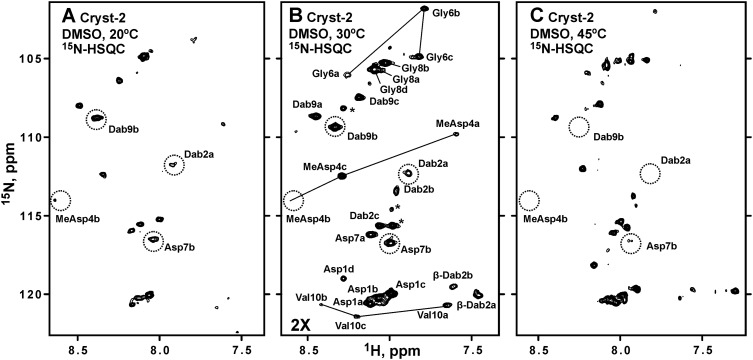
The samples of the major compound 2 (‘Cryst-2’) were studied in DMSO-d6, CD3OD, and H2O + D2O. The 15N-HSQC spectra measured in DMSO-d6 (Fig. 5) revealed the signals of HN-groups, indicating that Cryst-2 has a polypeptide part. However, the observed 1H–15N cross-peaks demonstrated unequal intensities, and their number significantly exceeded the number of HN-groups expected for the peptide with MW ∼1.3 kDa (Fig. 5). Comparison of 15N-HSQC spectra measured at 20, 30, and 45 °C showed that some of these signals became significantly broadened (even beyond the detection limit) at elevated temperature (Fig. 5, dotted). The observed signal doubling and broadening arise from the conformational heterogeneity of Cryst-2 molecule in solution (see below). Probably, the corresponding conformational exchange processes take place on ms–s time scale, thus approaching intermediate regime at 45 °C. This induces broadening of some of the resonances. An attempt to shift these exchange processes to the fast regime by increasing the NMR data acquisition temperature was unsuccessful due to considerable degradation of the Cryst-2 compound at 70 °C. Thus, the optimal temperature for NMR study of Cryst-2 was 30 °C (Fig. 5).
Fig. 5. 2D 1H,15N-HSQC spectra of Cryst-2 in DMSO-d6 at 20 °C (A), 30 °C (B) and 45 °C (C). The spectra on the panels A and C were measured and processed using identical parameters. The longer measurement time was used for the spectrum on the panel B; and, therefore, this spectrum is drawn with a lower threshold. The obtained resonance assignment of HN-groups is shown on the panel B. Signals of the four different Cryst-2 conformational states are marked using lowercase letters (a, b, c, d). The HN cross-peaks of MeAsp4, Gly6, and Val10 in the a, b, and c conformers are connected by lines. The resonances that became broadened at 45 °C are marked by dotted circles. It should be noted that not all expected HN cross-peaks for the four structural forms of Cryst-2 were identified in the spectra. Some resonances are under the drawing threshold. The unassigned resonances are shown by asterisks. These resonances could belong to the unidentified atoms of the Cryst-2 conformers or originated from impurities in the sample.
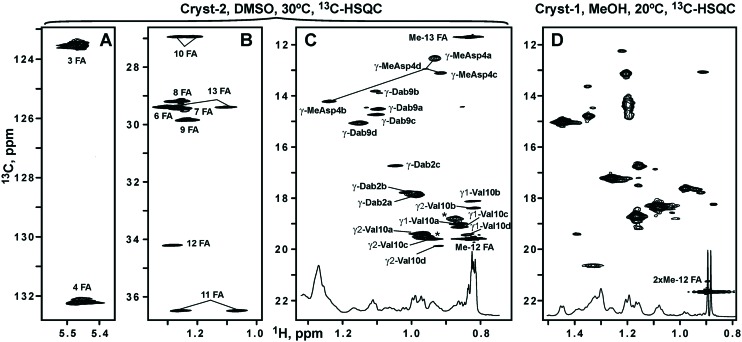
Analysis of the 2D TOCSY, COSY, 13C-HSQC, and 3D TOCSY-13C-HSQC spectra revealed the set of the narrow signals corresponding to the fatty acid residue (FA). This FA contains 15 carbon atoms, 14 of which have attached protons (Fig. 6, Table 2). The cross-peak between 2-CH2-group of FA and HN-group of Asp1 residue observed in the NOESY spectrum revealed a connection between the peptide and lipid parts of Cryst-2, indicating that the compound is a lipopeptide. The multiplicity edited 13C-HSQC spectrum allowed to distinguish signals of CH and CH2 groups. The two CH groups having chemical shifts typical to substituted alkenes (5.47/123.5 and 5.46/132.2 ppm, δH/δC, respectively) were assigned to the positions 3 and 4 of FA (Fig. 6A, Table 2). Another CH group is located at the position 12 of FA (Fig. 6B), where an attached methyl-group (Me-12) corresponds to the branching in the fatty chain. Two methyl groups of FA (Me-12 and Me-13) having chemical shifts of 0.83/11.7 and 0.82/19.6 ppm (δH/δC, respectively) display characteristic pattern of overlapped quartet and triplet in the 1D 1H spectrum (Fig. 6C, inset). Thus, FA moiety in the Cryst-2 lipopeptide has one double bond and two methyl-groups. Such FA residue had previously been identified in the aspartocin B antibiotic.7 One set of NMR signals was observed for the majority of the FA groups. At the same time, the resonances of 2-CH2, 3-CH, and 4-CH groups were split into several parts (see Fig. 6A). Thus, the conformational heterogeneity of Cryst-2 molecule in DMSO solution originates from the exchange processes taking place in the peptide part of the antibiotic.
Fig. 6. The fragments of 2D 1H,13C-HSQC spectra of Cryst-2 (DMSO-d6, 30 °C) and Cryst-1 (CD3OH, 20 °C). The obtained resonance assignment of Cryst-2 is shown. Signals of different Cryst-2 conformational states are marked by lowercase letters (a, b, c, d). (A and B) Assignment of the fatty acid moiety (FA) in Cryst-2. (C) Methyl region of the Cryst-2 spectrum showing terminal signals of FA, and resonances of MeAsp4, Dab2, Dab9 and Val10 residues. The cross-peaks of MeAsp4 in the different structural forms are connected by lines. The unassigned resonances are shown by asterisks. These resonances could belong to additional structural states of Cryst-2 or to the sample impurities. (D) Methyl region of the Cryst-1 spectrum. The signal of the terminal isopropyl group of FA is shown. The lower insets on the panels C and D show corresponding fragments of the 1D 1H spectra.
Table 2. 1H, 13C and 15N chemical shifts (ppm) of the four different conformational states of Cryst-2 lipopeptide (2) in DMSO solution at 30 °C a .
|
|
Cryst-2 conformer |
||||||||
|
a
|
b
|
c
|
d
|
||||||
| δ H | δ C(δN) | δ H | δ C(δN) | δ H | δ C(δN) | δ H | δ C(δN) | ||
| Asp1 | HN | 8.12 | 120.6 | 8.07 | 120.2 | 7.99 | 120.0 | 8.28 | 119.0 |
| α | 4.63 | 50.0 | 4.68 | 50.0 | 4.62 | 49.8 | 4.66 | 50.2 | |
| β | 2.67/2.48 | 36.8 | 2.66/2.49 | 36.9 | 2.68/2.50 | 36.5 | 2.82/2.54 | 36.4 | |
| Dab2 | HN | 7.89 | 112.3 | 7.95 | 113.4 | 8.06 | 115.6 | 8.22 | — |
| α | 4.91 | 53.0 | 4.92 | 52.9 | 4.66 | 52.4 | 4.82 | 53.4 | |
| β | 4.26 | 46.0 | 4.26 | 46.1 | 4.00 | 46.5 | 4.07 | 46.4 | |
| γ | 0.99 | 17.8 | 1.01 | 17.7 | 1.05 | 16.7 | 1.04 | 18.2 | |
| β-HN | 7.34 | — | 7.61 | 119.5 | 7.46 | 120.0 | 7.47 | — | |
| Pip3 | α | 4.96 | 53.6 | 5.02 | 53.1 | 4.79 | 56.7 | 5.10 | 52.8 |
| β | 2.00/1.68 | 27.0 | 2.01/1.51 | 25.4 | 2.11/1.55 | 28.0 | 2.10/1.99 | 31.8 | |
| γ | 1.35/1.47 | 20.5 | 1.23/1.48 | 21.0 | 1.39 | 20.6 | 1.54/1.37 | 20.6 | |
| δ | 1.55/1.58 | 24.6 | 1.53/1.66 | 24.7 | 1.20 | 24.7 | 1.60/1.48 | 24.8 | |
| ε | 3.80/3.30 | 43.6 | 3.03/3.81 | 44.0 | 4.26/2.74 | 40.4 | 3.93 | 43.8 | |
| MeAsp4 | HN | 7.59 | 109.9 | 8.59 | 114.4 | 8.29 | 112.5 | 7.68 | — |
| α | 4.64 | 54.4 | 4.12 | 56.3 | 4.69 | 55.0 | 4.66 | 54.3 | |
| β | 2.95 | 40.8 | 2.76 | 41.8 | 2.94 | 40.9 | 2.89 | 41.0 | |
| γ | 0.93 | 12.5 | 1.24 | 14.2 | 0.92 | 13.1 | 0.97 | 12.9 | |
| Asp5 | HN | 8.44 | — | — | — | — | — | — | — |
| α | 4.32 | 51.1 | 5.00 | 49.8 | 5.00 | 49.7 | — | — | |
| β | 2.74/2.58 | 35.5 | 3.18/2.67 | 33.3 | 2.59/3.10 | 34.0 | — | — | |
| Gly6 | HN | 8.26 | 106.0 | 7.78 | 101.9 | 7.82 | 104.9 | — | — |
| α | 3.68/3.75 | 42.9 | 3.60/3.88 | 41.9 | 3.90/3.68 | 42.9 | — | — | |
| Asp7 | HN | 8.12 | 116.2 | 7.98 | 116.7 | — | — | — | — |
| α | 4.46 | 50.3 | 4.66 | — | — | — | — | — | |
| β | 2.59/2.47 | 36.3 | 2.74/2.58 | 36.8 | — | — | — | — | |
| Gly8 | HN | 8.02 | 105.2 | 8.03 | 105.7 | — | — | 8.09 | 105.7 |
| α | 3.80/3.68 | 42.9 | 3.88 | 43.3 | 3.90/3.64 | 42.8 | 3.73/3.87 | 43.2 | |
| Dab9 | HN | 8.45 | 108.6 | 7.86 | 107.0 | 8.19 | 107.5 | 8.33 | 109.4 |
| α | 4.71 | 53.9 | 4.82 | 54.0 | 4.60 | 53.8 | 4.72 | 54.1 | |
| β | 3.61 | 48.1 | 3.66 | 49.5 | 3.57 | 48.3 | 3.58 | 48.2 | |
| γ | 1.10 | 14.5 | 1.11 | 13.8 | 1.10 | 14.7 | 1.16 | 15.0 | |
| Val10 | HN | 7.65 | 120.7 | 8.41 | 120.5 | 8.21 | 121.4 | 8.14 | 120.3 |
| α | 4.25 | 56.9 | 4.38 | 55.7 | 4.25 | 56.9 | 4.41 | 56.3 | |
| β | 2.02 | 30.2 | 1.91 | 32.1 | 2.06 | 29.9 | 2.15 | 29.5 | |
| γ1 | 0.98 | 19.4 | 0.82 | 18.4 | 0.94 | 19.6 | 0.93 | 19.8 | |
| γ2 | 0.86 | 19.0 | 0.82 | 18.1 | 0.86 | 19.1 | 0.84 | 19.4 | |
| Pro11 | α | 4.15 | 60.1 | 4.14 | 60.0 | 4.09 | 60.7 | 4.47 | 60.9 |
| β | 1.70/2.08 | 30.0 | 1.70/2.08 | 29.9 | 1.79/2.05 | 29.9 | 2.09/1.99 | 32.1 | |
| γ | 1.92/1.82 | 25.1 | 1.90/1.81 | 25.1 | 1.96/1.80 | 25.0 | 1.89/1.70 | 21.8 | |
| δ | 3.74/3.55 | 47.6 | 3.71/3.49 | 47.6 | 3.79/3.57 | 47.8 | 3.55/3.32 | 47.0 | |
| FA | 1 | 170.1 |
|
||||||
| 2 | 2.93 | 34.4 | |||||||
| 3 | 5.47 | 123.5 | |||||||
| 4 | 5.46 | 132.2 | |||||||
| 5 | 1.99 | 27.4 | |||||||
| 6 | 1.30 | 29.4 | |||||||
| 7 | 1.26 | 29.4 | |||||||
| 8 | 1.25 | 29.2 | |||||||
| 9 | 1.24/1.22 | 29.8 | |||||||
| 10 | 1.26/1.21 | 26.9 | |||||||
| 11 | 1.25/1.07 | 36.5 | |||||||
| 12 | 1.29 | 34.2 | |||||||
| 13 | 1.10/1.28 | 29.4 | |||||||
| 14 | 0.83 | 11.7 | |||||||
| Me-12 | 0.82 | 19.6 | |||||||
aThe four structural forms of Cryst-2 are denoted as a, b, c, d. Inset: structure of Cryst-2 (2).
To investigate the structure of the peptide moiety of Cryst-2, the spin-systems of individual residues were identified in the 2D TOCSY and COSY spectra. The sequential connections were established via HNi-1–HNi, HCαi-1–HNi and/or HCβi-1–HNi cross-peaks in the NOESY spectra. The observed broadening and splitting of the signals significantly complicated the analysis of 13C-HMBC spectra. This made it impossible to establish unambiguous sequential connectivities through 13C resonance frequencies. The obtained NMR data revealed that the peptide part of Cryst-2 is identical to the peptide parts of aspartocin antibiotics and represents the 11-residue peptide cyclized through the β-amino group of 2,3-diaminobutiric acid (Dab2).7 Thus the major component of Crystalomicin antibiotic coincides with the aspartocin B lipopeptide. The close correspondence observed between 13C-HSQC spectra of Cryst-2 and aspartocin B7 in CD3OD solution (Fig. S1†) together with the high-resolution mass spectrometry data (m/z 1318.6889) confirms the identity of these antibiotics.
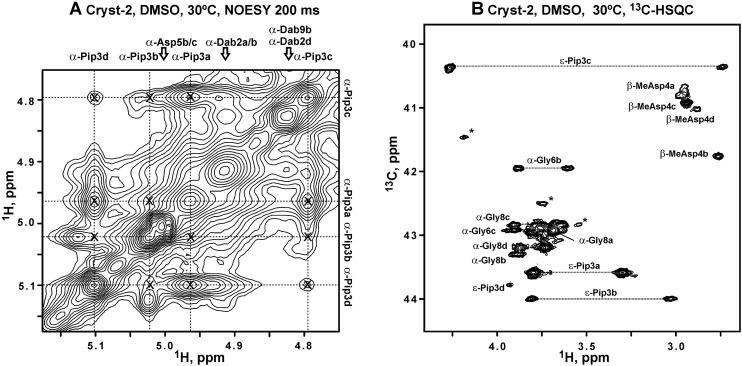
Detailed analysis of NMR spectra permitted to identify at least four sets of signals for the majority of residues in the peptide part of Cryst-2 (Table 2). It suggests that the molecule adopts at least four different conformations in solution. These forms denoted as a, b, c, d have the relative population of about 100 : 70 : 65 : 30 (Fig. 5B and 6C). The system of intra-conformer cross-peaks observed in the NOESY and ROESY spectra (Fig. 7A and S2 and S3†) indicated that these structural states of Cryst-2 are interconnected by conformational exchange processes. Using intensities of the diagonal and exchange cross-peaks observed for the 1Hα proton of Pip3 (Fig. 7A) we estimated the characteristic time of corresponding processes.19 The exchange processes between conformer a and conformers b, c, and d are going faster (characteristic times ∼1.5 s) than exchange b ↔ c and b ↔ d (characteristic times ∼3 s). The slowest exchange process was observed between conformers c and d (time ∼8 s). Therefore the corresponding cross-peaks have lowest amplitude (Fig. 7A).
Fig. 7. NMR data reveal exchange processes between the four conformational sates of Cryst-2 in DMSO-d6 solution and cis–trans isomerization of Dab2–Pip3 peptide bond. (A) The fragment of 2D 1H,1H-NOESY spectrum (tm = 400 ms). The assignment of 1Hα resonances of the Pip3 residue in the a, b, c, and d conformers is shown. The exchange originated (inter-conformer) cross-peaks are marked by crosses. The unassigned resonances probably belong to additional structural states of Cryst-2 or to impurities. (B) Fragment of 2D 1H,13C-HSQC spectrum of Cryst-2. Signals of CH2 groups are connected by dotted lines. The assignment of HCε resonances of Pip3 residue is shown. Characteristic upfield shift of 13Cε resonance in the conformer c confirmed that the corresponding Dab2–Pip3 peptide bond is in the cis configuration. According to chemical shift data, the other conformers (a, b, d) of Cryst-2 have trans Dab2–Pip3 bonds.
Due to signal broadening and overlap, some of the resonances from Asp5–Asp7 fragment were not reliably identified in the NMR spectra. For example, the 1HN resonance of Asp5 was observed only for the conformer a in the 1H TOCSY and NOESY spectra, but the corresponding HN cross-peak was not identified in the 15N-HSQC. Nevertheless, we successfully obtained the 1H, 15N and 13C resonance assignment for the four structural forms of Asp1–MeAsp4 and Gly8–Pro11 fragments (Table 2). The connections between these fragments were established via NOE contacts between HNγ of Dab2 and HCα/β of Pro11. The mapping of the assigned fragments to the specific structural forms of Cryst-2 was also supported by the relative cross-peaks intensity in the 13C-HSQC spectra. Due to significant exchange contribution to the relaxation rates of the nuclei within 1H15N-groups, the comparison of signal intensity in the 15N-HSQC spectra was found less reliable.
The observed exchange processes could involve cis–trans isomerization of the tertiary amide bonds in the peptide part of Cryst-2. The molecule contains two such bonds Dab2–Pip3 and Val10–Pro11. The configuration of Xxx–Pro peptide bonds could be distinguished either using characteristic patterns of NOE cross-peaks (HCαi-1–HCδi for trans isomer and HCαi-1–HCαi for cis),20 or using the difference in the chemical shifts of 13Cβ and 13Cγ nuclei of the Pro residue.21 The corresponding chemical shifts observed in the characteristic regions around 30 and 25 ppm (Table 2), respectively, revealed the trans configuration of the Val10–Pro11 bond in the a, b and c conformers (ΔδCβγ ∼ 5.1 ppm). On the other hand, the 13Cβ and 13Cγ chemical shifts of the d conformer (32.1 and 21.8 ppm, respectively, ΔδCβγ of 10.3 ppm) were consistent only with the cis configuration.21 The observation of the strong NOE contacts between HCα of Val10 and HCδ of Pro11 confirmed trans configuration of the Val10–Pro11 bond in the conformers a and c. Crowding in the corresponding spectral region did not permit to use NOE data for analysis of configuration of the b and d conformers.
The same approach could be applied to the determination of the geometry of Xxx–Pip peptide bonds. Indeed, we observed strong NOE contacts between HCα of Dab2 and HCε of Pip3 in the conformers a, b and d, while the conformer c demonstrated strong NOE between HCα of Dab2 and HCα of Pip3. This indicated that only the conformer c adopts cis configuration of the Dab2–Pip3 peptide bond. The comparison of 13C chemical shifts for Pip3 residue of Cryst-2 with the values reported previously for the cis- and trans-isomers of pipecolic acid in the ring-opened degradation product of rapamycin22 also supported this conclusion. The chemical shifts of 13Cα and 13Cε nuclei in the conformers a, b and d were observed in the spectral regions around 53 and 44 ppm, respectively (mean difference 9.4 ppm), while the same atoms in the conformer c resonate at 56.7 and 40.4 ppm (difference 16.3 ppm). These values nicely correspond to the 13Cα and 13Cε chemical shifts observed in the ring-opened rapamycin (50.7 and 43.8 ppm for the trans-isomer, and 55.7 and 38.1 ppm for the cis-isomer, respectively).22 Interestingly the conformers c and d, having cis-configuration of the different bonds, are connected with the slowest (among observed) exchange process.
The presence of conformational heterogeneity had previously been noted in the NMR study of aspartocin lipopeptides conducted in the DMSO, methanol and acetonitrile/water mixtures,7,9 but the resonance assignment and structural characterization had been done only for the major isomers of aspartocin A and B. The presently obtained results agree with the previous finding that the configuration of Dab2–Pip3 and Val10–Pro11 bonds is all trans in the major structural form of aspartocin B.
The obtained results permit to conclude that the two most populated conformers of the Cryst-2 in DMSO solution (a and b) have identical all-trans configuration of the tertiary amide bonds. Thus the difference in their structures could be associated with the more complex structural transition(s), e.g. with the fluctuations in the overall conformation of the cyclic part of the molecule. These fluctuations should be sufficiently slow to provide two distinct sets of NMR resonances and, thus, the a and b states should be separated by the relatively large energetic/enthalpy barrier associated with rupture of several hydrogen bonds or an ionic bond (salt-bridge). Taking into account that the largest changes in the chemical shifts between a and b conformers were observed in MeAsp4–Val10 fragment and especially at MeAsp4 residue (see Fig. 5B and 6C and Table 2), we could propose that one of these conformers is stabilized by ionic interaction between oppositely charged side chain groups of MeAsp4 and Dab9 residues. The other structural forms of the Cryst-2 in DMSO solution also could be stabilized by ionic interactions involving the amino-group of Dab9 and acidic groups of the other residues (e.g. Asp1, Asp5 or Asp7).
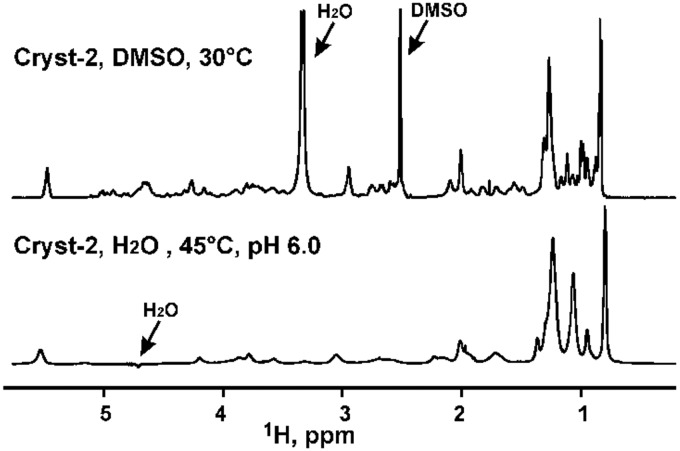
The Cryst-2 was also directly solubilized in water (+5% D2O). The obtained sample was optically clear, but the 1D 1H NMR spectra measured at pH in range from 3 to 7 demonstrated very broad lines (Fig. 8). This implies the formation of micelle-like aggregates by the Cryst-2 molecule in water solutions and is consistent with the lipopeptide structure of the compound.23
Fig. 8. Comparison of the 1D 1H spectra of Cryst-2 in DMSO-d6 and in H2O (5% D2O). The positions of the residual solvent signals are indicated. In the lower spectrum the strong water signal is suppressed by WATERGATE.
The minor component of the antibiotic, compound 1 (“Cryst-1”) was studied by NMR in CD3OH. The 2D 13C-HSQC spectrum revealed the narrow intense signal of methyl group at 0.89/21.7 ppm (δH/δC, respectively, Fig. 6D). This signal corresponded to doublet in the 1D 1H spectrum (Fig. 6D, inset) and therefore belongs to the two overlapped methyl resonances of the isopropyl group. Such FA residues terminating by isopropyl-like moiety (iso-FA) had previously been identified in the aspartocin A and C antibiotics.7 Taking into account the result of HRMS analysis (m/z 1304.6733), we could conclude that the Cryst-1 compound is identical to aspartocin C lipopeptide. As compared to aspartocin B (Cryst-2), this antibiotic contains an identical peptide part, but the FA is different (Δ3-iso-14 : 1 vs. Δ3-anteiso-15 : 1). The FA residue of aspartocin C is shorter by one CH2 group and has a different arrangement of two methyl groups. The presence of the additional set of weak signals in the 13C-HSQC spectrum of Cryst-1 (Fig. 6D) indicated that this lipopeptide also inhere conformational heterogeneity in solution.
The observed conformational heterogeneity significantly complicated NMR analysis of Cryst-1 and -2 lipopeptides. For further structural studies the careful screening of solvent composition is needed to find the experimental conditions where exchange processes are suppressed or slowed down. The membrane mimicking media of detergent micelles or lipid-detergent bicelles could provide such environment.
3. Conclusions
In summary, we found that the crystallomycin antibiotic reported in 1957 indeed is similar to compounds of amphomycin lipopeptide family, and contains two major components (identical to aspartocins B and C) along with several minor compounds. The producing strain INA 00887 was cultivated and identified as Streptomyces griseorubens. NMR studies of compound 2 (Cryst-2, aspartocin B) in DMSO revealed four major conformers, probably corresponding to the set of (Dab2)–Pip3 and (Val10)–Pro11 rotamers on peptide bonds. Both crystallomycins showed pronounced calcium-dependent activity against Gram-positive bacteria, including several MRSA strains.
4. Experimental
4.1. HPLC
Analytical HPLC separations were performed in the following conditions: 20 μL of sample (solution of crystallomycin 2 mg mL–1 in 50% ethanol), column – Waters Sunfire C18 5 μm 4.6 × 250 mm, detection at 210 nm, flow rate 1 mL min–1, eluent A – 0.1% TFA in water, B – 0.1% TFA in acetonitrile, linear gradient of B, % (time, min): 30(0) → 60(25) → 75(26) → 75(30). Semi-preparative HPLC separations were performed in the following conditions: 200 μL of sample (contains 10.9 mg of crystallomycin complex in 50% ethanol), column – Waters XBridge Prep C18 5 μm OBD 19 × 150 mm, detection at 210 nm, flow rate 6 mL min–1, eluent – 45% acetonitrile/water + 0.1% TFA (isocratic). After analytical re-runs of obtained fractions, the selected fractions with 95+%-content of 1 or 2 were combined. Organic solvent was evaporated under vacuum (bath temp. 30 °C), water residue was lyophilized. Compounds 1 (2.0 mg) and 2 (6.8 mg) were obtained as white amorphous powders.
4.2. HRMS
High resolution mass spectra (HRMS) were registered on a Bruker Daltonics micrOTOF-Q II instrument using electrospray ionization (ESI). The measurements were acquired in a positive ion mode with the following parameters: interface capillary voltage 4500 V; mass range from m/z 50 to 3000; external calibration (Electrospray Calibrant Solution, Fluka); nebulizer pressure 0.4 bar; flow rate 3 μL min–1; nitrogen was applied as a dry gas (6 L min–1); interface temperature was set at 180 °C. Observed m/z values: 1304.6731 for 1 (calc. 1304.6733 for [C59H93N13O20 + H]+) (Fig. S4†); 1318.6894 for 2 (calc. 1318.6889 for [C60H95N13O20 + H]+) (Fig. S5†).
4.3. Cultivation and extraction
Strain INA 00887 from Gause Institute strain collection was cultivated as described earlier.2 Fermentation broth (0.25 L) was separated by centrifugation and filtration into culture filtrate and mycelium. The culture filtrate was acidified by aq. HCl to pH = 3.0 and extracted with n-butanol (2 × 100 mL), the extracts were combined, concentrated in vacuo to dryness. The residue was taken up in 1 mL of methanol and then filtered (precipitate discarded). Preliminary antibacterial assay of obtained extract was performed by agar disc (d = 6 mm) diffusion method as following: 50 μL of the methanol sample was dripped onto each disk, and 50 μL methanol was used as the negative control. The indicator pathogens used for antimicrobial assay were: Staphyloccocus aureus (ATCC 29213), Escherichia coli (ATCC 25922), Aspergillus niger (ATCC 16404), Candida albicans (ATCC 14053). The inhibition activity was detected only against S. aureus strain. The HPLC-MS analysis of obtained extract showed the presence of two peaks fully identical with 1 and 2 from authentic sample (Fig. S6†).
4.4. NMR
NMR experiments were carried out on Avance-III-800 and Avance-III-600 spectrometers (Bruker) equipped with 5 mm triple-resonance (1H, 13C, 15N) CryoProbes. The Cryst-2 samples contained about 10 mM of the compound in DMSO-d6, CD3OH, or in H2O + 5% D2O. The Cryst-1 sample contained about 4.5 mM of the compound in CD3OH. Spectra were measured in the temperature range from 20 to 45 °C. The following 2D NMR spectra were measured for Cryst-2 in DMSO-d6 using standard gradient-enhanced pulse sequences:19 DQF-COSY, TOCSY (τm = 80 ms), NOESY (τm = 100, 200, and 400 ms), ROESY (τm = 100 and 200 ms) 15N-HSQC, 13C-HSQC, multiplicity edited 13C-HSQC (13C-HSQC-ed), 13C-HMBC, and 3D TOCSY-13C-HSQC (τm = 80 ms). The 1H chemical shifts were referenced to the residual CD2H signals of CD3OH and DMSO-d5 at 3.33 and 2.50 ppm, respectively. Chemical shifts of 13C and 15N were referenced indirectly relative to tetramethylsilane (TMS) and liquid NH3. To estimate rates of exchange processes, intensities of the diagonal and exchange cross-peaks in NOESY spectrum were fitted to solution of the Bloch–McConnell equations in the Mathematica program (ver. 7, Wolfram Research). The six rates for forward reactions were treated as variables. The backward rates were calculated from equilibrium populations of the states and forward rates assuming microscopic reversibility. R1 relaxation rates were estimated from 1D inversion recovery experiment (∼0.55 s–1) and assumed to be equal for different states.
4.5. Antibacterial activity
MICs were determined by broth microdilution according to CLSI guidelines24 with or without Ca2+ ions. A total of ten clinical isolates such as methicillin-resistant Staphylococcus spp. (MRSA and MRSE) and vancomycin-resistant Enterococcus spp. were used in this study. Staphylococcus aureus ATCC 29213 and E. faecalis ATCC 29212 were used as standard microorganisms for quality control of the tests. These strains were obtained from the State collection of pathogenic microorganisms of Tarasevich State Research Institution of Standardization and Control of Biological Medicines. The clinical isolates were obtained from The Russia Research Institute for Antibiotics Culture Collection.
Conflicts of interest
There authors declare no competing interest.
Supplementary Material
Acknowledgments
The research was supported by joint grant from Russian Foundation for Basic Research and National Natural Science Foundation of China (projects 17-53-53130 and 81611530716, respectively). V. A. K. was supported in part by the Molecular and Cellular Biology Program of the Russian Academy of Sciences. P. N. S. was supported in part by the Program of fundamental research for state academies for 2013–2020 years (No. 01201363818). NMR experiments were carried out using equipment provided by the IBCH core facility (CKP IBCH) supported by the Russian Ministry of Education and Science, grant RFMEFI62117X0018. We thank N. G. Machavariani and O. N. Sineva for their helpful advice.
Footnotes
†Electronic supplementary information (ESI) available. See DOI: 10.1039/c8md00002f
References
- Baltz R. H., Miao V., Wrigley S. K. Nat. Prod. Rep. 2005;22:717–741. doi: 10.1039/b416648p. [DOI] [PubMed] [Google Scholar]
- Gause G. F., Preobrazhenskaya T. P., Kovalenkova V. K., Il'icheva N. P., Brazhnikova M. G., Lomakina N. N., Kovsharova I. N., Shorin V. A., Kunrat I. A., Shapovalova S. P., Antibiotiki, 1957, 26 , 9 –14 , (in Russian) . [PubMed] [Google Scholar]
- Lomakina N. N., Brazhnikova M. G., Biokhimiya, 1959, 24 , 425 –431 , (in Russian) . [PubMed] [Google Scholar]
- Heinemann B., Kaplan M. A., Muir R. D., Hooper I. R. Antibiot. Chemother. 1953;3:1239–1342. [PubMed] [Google Scholar]
- Shorin V. A., Shapovalova S. P., Antibiotiki, 1959, 41 , 77 –81 , (in Russian) . [PubMed] [Google Scholar]
- (a) Pasetka C. J., Erfle D. J., Cameron D. R., Clement J. J., Rubinchik E. Int. J. Antimicrob. Agents. 2010;35:182–185. doi: 10.1016/j.ijantimicag.2009.10.013. [DOI] [PubMed] [Google Scholar]; (b) Craig W. A., Andes D. R., Stamstad T. Antimicrob. Agents Chemother. 2010;54:5092–5098. doi: 10.1128/AAC.00238-10. [DOI] [PMC free article] [PubMed] [Google Scholar]; (c) Rubinchik E., Schneider T., Elliott M., Scott W. R. P., Pan J., Anklin C., Yang H., Dugourd D., Müller A., Gries K., Straus S. K., Sahl H. G., Hancock R. E. W. Antimicrob. Agents Chemother. 2011;55:2743–2754. doi: 10.1128/AAC.00170-11. [DOI] [PMC free article] [PubMed] [Google Scholar]; (d) Dugourd D., Yang H., Elliott M., Siu R., Clement J. J., Straus S. K., Hancock R. E. W., Rubinchik E. Antimicrob. Agents Chemother. 2011;55:3720–3728. doi: 10.1128/AAC.00322-11. [DOI] [PMC free article] [PubMed] [Google Scholar]; (e) Singh M., Chang J., Coffman L., Kim S. J. Sci. Rep. 2016;6:31757. doi: 10.1038/srep31757. [DOI] [PMC free article] [PubMed] [Google Scholar]
- Kong F., Janota K., Ashcroft J. S., Carter G. T. Rec. Nat. Prod. 2010;4:131–140. [Google Scholar]
- Aretz W., Meiwes J., Seibert G., Vobis G., Wink J. J. Antibiot. 2000;53:807–815. doi: 10.7164/antibiotics.53.807. [DOI] [PubMed] [Google Scholar]
- Vértesy L., Ehlers E., Kogler H., Kurz M., Meiwes J., Seibert G., Vogel M., Hammann P. J. Antibiot. 2000;53:816–827. doi: 10.7164/antibiotics.53.816. [DOI] [PubMed] [Google Scholar]
- Bunkóczi G., Vértesy L., Sheldrick G. M. Acta Crystallogr., Sect. D: Biol. Crystallogr. 2005;61:1160–1164. doi: 10.1107/S0907444905017270. [DOI] [PubMed] [Google Scholar]
- (a) Shoji J., Kozuki S., Okamoto S., Sakazaki R., Otsuka H. J. Antibiot. 1968;21:439–443. [PubMed] [Google Scholar]; (b) Nishimura H. and Otsuka H., US Pat., 3781420, 1973.
- Yang H., Huang X., Zhang Z., Wang C., Zhou J., Huang K., Zhou J., Zheng W. Nat. Prod. Res. 2014;28:861–867. doi: 10.1080/14786419.2014.886210. [DOI] [PubMed] [Google Scholar]
- Bodanszky M., Sigler G. F., Bodanszky A. J. Am. Chem. Soc. 1973;95:2352–2357. doi: 10.1021/ja00788a040. [DOI] [PubMed] [Google Scholar]
- Hinuma Y. J. Antibiot., Ser. A. 1954;7:134–136. [PubMed] [Google Scholar]
- Inoue M., Hitomi H., Mizuno K., Fujino M., Miyake A., Nakazawa K., Shibata M., Kanzaki T. Bull.Bull. Chem. Soc. Jpn.Chem. Soc. Jpn. 1960;33:1014–1015. [Google Scholar]
- Toth-Sarudy E., Horvath I., Gyimesi J., Ott I., Alfoldi L., Berdy J., Koczka I., Scholtz V., Szell V. and Laszio E., US Pat., 3798129, 1974.
- Gause G. F., Preobrazhenskaya T. P., Spiridonova I. A., Maskimova T. S., Ol'khovatova O. L., Brazhnikova M. G., Tolstykh I. V., Borisova V. N., Fedorova G. B., Antibiotiki, 1980, 25 , 883 –887 , (in Russian) .7469391 [Google Scholar]
- Shoji J., Otsuka H. J. Antibiot. 1969;22:473–479. doi: 10.7164/antibiotics.22.473. [DOI] [PubMed] [Google Scholar]
- Fundamentals of Protein NMR Spectroscopy, ed. G. S. Rule and T. K. Hitchens, Springer, Dordrecht, 2006. [Google Scholar]
- Wütrich K., NMR of Proteins and Nucleic Acids, Wiley, New York, 1986. [Google Scholar]
- Schubert M., Labudde D., Oschkinat H., Schmieder P. J. Biomol. NMR. 2002;24:149–154. doi: 10.1023/a:1020997118364. [DOI] [PubMed] [Google Scholar]
- Zhou C. C., Stewart K. D., Dhaon M. K. Magn. Reson. Chem. 2005;43:41–46. doi: 10.1002/mrc.1501. [DOI] [PubMed] [Google Scholar]
- Ball L.-J., Goult C. M., Donarski J. A., Micklefield J., Ramesh V. Org. Biomol. Chem. 2004;2:1872–1878. doi: 10.1039/b402722a. [DOI] [PubMed] [Google Scholar]
- Clinical and Laboratory Standards Institute (CLSI). Performance standards for antimicrobial susceptibility testing: Twenty fifth informational supplement. CLSI document M100-S25. Wayne, PA: CLSI; 2015. CLSI Methods for dilution antimicrobial susceptibility tests for bacteria that grow aerobically; Approved Standard, 10th Ed. CLSI document M07-A10, Wayne, PA, 2015.
Associated Data
This section collects any data citations, data availability statements, or supplementary materials included in this article.


