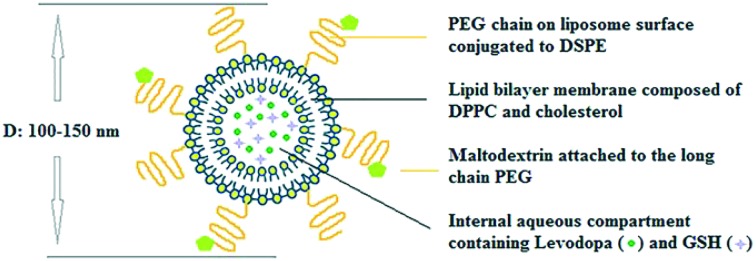
 Maltodextrin conjugated and glutathione co-loaded liposomes can improve brain targeting of levodopa by enhancing blood–brain barrier targeting and transport.
Abstract
Central nervous system acting drugs, when administered intravenously, cannot show their effect in the brain due to the difficulty in crossing the blood–brain barrier (BBB). Levodopa is one of those drugs that are used to treat Parkinson's disease. In this study, a new liposomal levodopa delivery system that is modified with maltodextrin was developed in order to target and enhance transport through the BBB. An antioxidant, glutathione, was co-loaded in liposomes as a supportive agent and its effect on liposome stability and delivery was investigated. Glutathione co-loading had a positive effect on the viabilities of 3T3 and SH-SY5Y cells. Maltodextrin targeted liposomes showed high in vitro levodopa passage in the parallel artificial membrane permeability assay and had superior binding to MDCK cells. Results suggest that maltodextrin modification of liposomes is an effective way of targeting the BBB and the developed liposomal formulation would improve brain delivery of central nervous system agents.
1. Introduction
Parkinson's disease is one of the progressive neurodegenerative diseases which cannot be completely cured. Medications are only used to control the symptoms while minimizing the side effects.1 Dopaminergic drugs demonstrate clinical utility in the treatment of Parkinson's disease.2 Levodopa, the most effective drug to ameliorate the symptoms, should be achieved at a certain concentration in the brain to produce continuous dopaminergic stimulation.3 Levodopa is able to cross through the BBB via L-type amino-acid transporter 1 (LAT1) and converted back into dopamine in the striatum. However, some of the levodopa is also converted to dopamine prior to BBB entry and dopamine, due to its hydrophilicity, is unable to cross the BBB.4 Despite the presence of LAT1 mediated transport, levodopa permeability was reported to be less than 5%.5 Therefore, levodopa should be reformulated to increase its availability in the brain. One widely and effectively used approach for drug targeting to the disease site is the use of liposomes. Liposomes are biocompatible, biodegradable, non-immunogenic, and non-toxic drug carrying systems.6 Liposomes were targeted to the brain using a receptor-mediated endocytosis approach by conjugation of specific molecules like transferrin,7 monoclonal antibody (OX26),8 and glucose.9 One of these molecules is maltodextrin, which can also be readily used as a basic component of several drug carrying systems. Maltodextrins are produced by partially hydrolysing starch with acids and/or enzymes.10 Maltodextrin was demonstrated to be appropriate for brain targeting by using maltodextrin nanoparticles via receptor-mediated endocytosis.11 Maltodextrin is a polysaccharide which is innocuous to human health and mostly used in food and beverage products as a commercially available ingredient.12 This hydrophilic molecule, maltodextrin, is highly biocompatible and when attached to the liposome surface will increase the stability and bioavailability of the system. In this study, a maltodextrin conjugated levodopa loaded liposome was developed as a new system to enhance BBB levodopa targeting and transport for the treatment of Parkinson's disease. Maltodextrin conjugated liposomes were designed to be delivered to the brain via receptor mediated endocytosis due to the brain's high energy demand.
Previous studies indicate that the use of antioxidants prevents phospholipid oxidation and thereby increases the bioavailability of liposomes besides being beneficial to cells.13,14 Glutathione (GSH) is a natural antioxidant found in many cells that neutralizes reactive oxygen species produced in the cells.15 GSH was found to be encouraging and supportive for treatment of neurodegenerative diseases (such as Alzheimer's disease, Parkinson's disease, multiple sclerosis, etc.) by preventing oxidative stress and maintaining cell functioning.16 Here, GSH was co-loaded into liposomes with levodopa in order to improve stability. Although there are a few studies on liposomal formulations of levodopa and GSH, they are investigated in separate studies and are not considered in a targeted system. In this study, maltodextrin is used to increase the transition of a liposomal delivery system through the BBB and the possible effects of GSH co-loading to levodopa liposomes were investigated.
2. Experimental
2.1. Materials
1,2-Dipalmitoyl-sn-glycero-3-phosphocholine-16:00 (DPPC), DSPE-PEG(2000) amine, and l-α-phosphatidylethanolamine-N-(lissamine Rhodamine B sulfonyl) were purchased from Avanti Polar Lipids, Inc. (USA). 18:00 mPEG (2000)-DSPE was provided by Lipoid (Germany). Cholesterol (Chol), l-Glutathione reduced, N,N-dicyclohexylcarbodiimide (DCC), N-hydroxysuccinimide (NHS), l-glutamine and HAM's nutrient mixture F-12 with l-glutamine were purchased from Sigma Aldrich Chem. Co. (USA). Levodopa, maltodextrin (dextrose equivalent (DE): 18.5) (Roquette, France), SH-SY5Y (human neuroblastoma) and MDCK (Madin-Darby Canine Kidney) cell lines, materials for the parallel artificial membrane permeability assay for the blood–brain barrier (PAMPA-BBB) (Pion Inc., USA), were kindly provided by Abdi Ibrahim Pharmaceuticals Inc. (Istanbul, Turkey). The 3T3 fibroblast cell line was obtained from the Foot-and-Mouth Disease Institute of the Ministry of Agriculture and Rural Affairs of Turkey. The glutathione assay kit was obtained from Cayman Chemical Company (USA).
2.2. Carboxymethylation and conjugation of maltodextrin to DSPE-PEG
In order to create necessary groups for maltodextrin conjugation to the amine group of DSPE-PEG, hydroxyl groups on maltodextrin were converted to carboxymethyl groups. Maltodextrin (0.2 g) and sodium hydroxide (0.046 g) were dissolved in isopropanol : water (4 : 1 v/v) solution and allowed to react with monochloroacetic acid in isopropanol for 4 hours. Reaction was stopped by adding ethanol solution (70%, 10 ml) and the solution was freeze-dried to obtain carboxymethylated maltodextrin.
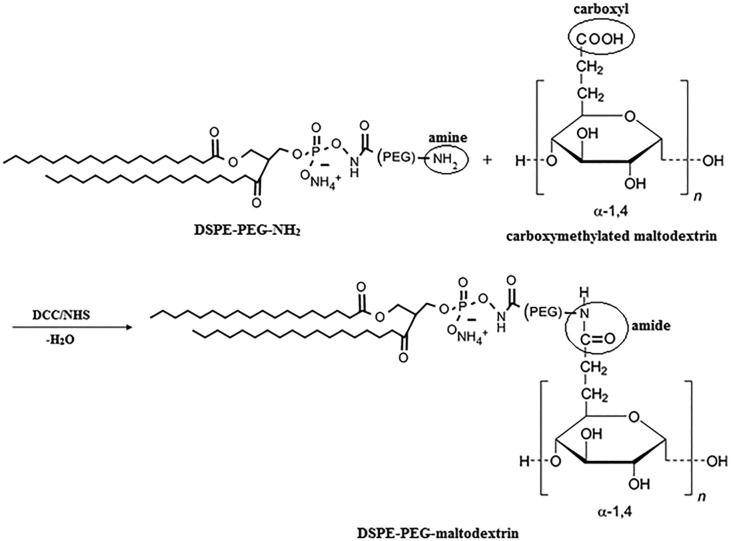
Carboxymethylated maltodextrin (0.74 g) in acetone (100 ml) was allowed to react with DCC (0.28 g) and NHS (0.17 g) for 22 hours at RT. Activated maltodextrin was collected after acetone evaporation under nitrogen. Activated maltodextrin and DSPE-PEG(2000) amine (0.052 g) were dissolved in DMSO (20 ml) and allowed to react for 24 hours. The solution was dialyzed (dialysis tubing, 2000 MWCO) against dH2O for 24 hours and centrifuged at 14 000 rpm for 10 minutes to collect the product. Conjugation of DSPE-PEG(2000) amine and the carboxymethylated maltodextrin scheme is presented in Fig. 1. The change in the chemical structure of maltodextrin and DSPE-PEG(2000) amine was analysed by Attenuated Total Reflectance Fourier Transform Infrared and Raman (ATR-FTIR) spectroscopy (Bruker IFS 66/S, METU, Central Laboratory) at the mid-infrared spectrum range (4000–400 cm–1). Carboxymethylation and conjugation efficiencies were calculated from changes in spectra using OMNIC Spectra Software (Thermo Fisher Scientific, USA).17
Fig. 1. Conjugation of DSPE-PEG(2000) amine and carboxymethylated maltodextrin.
The carboxymethylation efficiency was estimated by calculating the percent intensity decrease of hydroxyl groups on maltodextrin. The same amounts of carboxymethylated maltodextrin and maltodextrin were used for FTIR analysis. The area under the hydroxyl group peaks for unreacted maltodextrin and carboxymethylated maltodextrin was compared and the carboxymethylation efficiency was calculated according to following formula as the percentage of modified hydroxyl groups on maltodextrin:
 |
The efficiency of maltodextrin and DSPE-PEG(2000) amine conjugation was calculated from the percent decrease in amine bond intensity. The conjugation efficiency after reaction was calculated according to following formula:
 |
2.3. Preparation of liposome groups
Conventional liposomes were prepared with three different molar lipid compositions (DPPC : Chol; 8 : 2, 7 : 3, and 6 : 4). Stealth liposome groups were prepared with a DPPC : Chol molar lipid ratio of 7 : 3 by addition of DSPE-mPEG(2000) into the lipid film at 2 or 4 mole% of DPPC. Targeted liposomes were prepared with 4% PEG via covalent conjugation of maltodextrin to the DSPE-PEG(2000) amine at two different ratios: 0.35% and 0.7 mole% of total lipid. In cellular association experiments, lipid films were prepared with Lissamine-Rhodamine labelled lipid (0.5 mole%). The dried lipid film was hydrated with 1 ml of phosphate buffer (PB, 0.1 M, pH 7.4) containing only levodopa (5 mg) or with GSH (0.012 or 0.006 mg) by vortex mixing and heating at different temperatures (38–44 °C). Then, the suspension was extruded through 800, 400, and 100 nm polycarbonate membranes (Avanti Polar Lipids, USA) and liposomes were collected after size exclusion chromatography (Sephadex G-75) by measuring O.D. at 410 nm using a microplate spectrophotometer (GMI Biotech 3550, USA). For cell culture studies, liposomes were filtered through 0.2 μm polyethersulfone filters to sterilize before use.
2.4. Quantification of levodopa, glutathione and phospholipids
Levodopa was detected by fluorescence spectrometry (Turner Biosystems Modulus, UV Kit, USA). Encapsulation and release were calculated using the constructed calibration curve. GSH was detected with ELISA kit (Cayman, USA) by measuring the optical density at 405 nm. The amount of DPPC was determined by the Stewart method.18
2.5. Particle size, surface charge and morphology of liposomes
The particle size distribution and surface charge of liposome groups were determined by laser diffraction using a Zeta sizer (Nano ZS90, Malvern Instruments, METU Central Lab). The morphology of liposomes was observed by High Contrast Transmission Electron Microscopy (TEM) (FEI Technai G2 Spirit BioTwin CTEM, METU, Central Laboratory) at 80 kV. The liposome solution was diluted with PB solution (0.1 M, pH 7.4) and stained with 2% uranyl acetate solution, before being placed on a Formvar-carbon film on 300 square mesh copper grids.
2.6. Drug encapsulation efficiency and percent drug loading
The percent drug encapsulation efficiency (% EE) and percent drug loading of large unilamellar vesicles (LUV) were calculated as:% EE = (mg levodopa or GSH in LUVs/mg levodopa or GSH initially added) × 100%% Drug loading = (mg levodopa or GSH in LUVs/mg DPPC in LUVs) × 100%
2.7. In vitro release studies
Liposome groups were dialyzed (MW cut off: 12 000 Da) against 10 ml of PB (0.1 M, pH 7.4). The release setup was kept at 37 °C and continuously shaken in a water bath (NÜVE ST 402, Turkey). Samples were taken after 6, 24 and 48 hours in order to measure the amount of levodopa and GSH released from the liposomes.
2.8. Liposome stability
For stability analysis, liposomes were stored at 4 °C and 25 °C for six months. Particle size and zeta potential measurements were performed monthly. The drug content of liposomes was also calculated after 6 months by precipitating liposomes by centrifugation at 25 000 rpm for 20 minutes at 4 °C and determining the amount of levodopa that was dispersed in the supernatant. By subtracting the levodopa amount dispersed in the supernatant from the initial liposome encapsulated amount, the drug amount retained in liposomes after 6 months was calculated.
2.9. In vitro cytotoxicity tests
3T3 and MDCK cells were routinely cultured in DMEM (high glucose–glutamine) supplemented with FBS (10%) and penicillin–streptomycin (1%), whereas SH-SY5Y cells were routinely cultured in a 1 : 1 mixture of DMEM (high glucose–glutamine) and HAM's nutrient mixture F-12 with l-glutamine supplemented with FBS (10%) and penicillin–streptomycin (1%) at 37 °C under a humidified atmosphere of 5% CO2–95% air in an incubator (5215, SHEL LAB, USA). The medium was refreshed periodically after two days.
The cytotoxicity of levodopa and liposome formulations was tested on 3T3 and SH-SY5Y cells by the MTT assay. 3T3 and SH-SY5Y cells were seeded at an initial density of 6 × 10⁴ cells per well and 2 × 10⁵ cells per well in 24-well plates and allowed to attach for 24 hours. Then, fresh medium containing either drug solution (0, 20, 40, 60, 80, 100 μM levodopa with or without 0.06 μM GSH) or liposome formulation (i. empty liposome, ii. 100 μM levodopa containing liposome, iii. 100 μM levodopa and 0.06 μM GSH containing liposome) was added. After 24 and 48 hours of incubation, the MTT assay was performed. Optical densities were measured at 570 nm using a microplate reader (μQuant, BioTek®, Winooski, VT, USA).
2.10. In vitro blood–brain barrier transport assay
In vitro BBB transport experiments were performed using the parallel artificial membrane permeability assay for the BBB. The artificial membranes between donor and acceptor compartments were formed by adding lipid solution (10 μl per well in 96-well plates) to each compartment. The wells of the acceptor plate (lower compartment) were filled with PB (0.1 M, pH 7.4, 200 μl per well in 96-well plates). The donor plate (upper compartment) was placed on the acceptor plate and the wells of the donor plate were filled with either drug solution (0.75 mg ml–1 levodopa) or liposomal suspension (0.75 mg ml–1 levodopa containing liposome). The system was incubated at 37 °C in the dark. Aliquots of the acceptor phase were analysed after 6, 9, 24, and 48 hours in order to obtain the transported amount of levodopa. Aliquots of the donor phase were analysed after 48 hours in order to obtain the transported amount of DPPC. The percent drug passage and percent lipid passage were calculated with the equations below:% drug passage = (mg levodopa in acceptor compartment/mg levodopa initially added to donor compartment) × 100%% lipid passage = 100 – (mg DPPC left in donor compartment after 48 hours of incubation/mg DPPC initially added to donor compartment × 100)%
2.11. Cellular association of liposomes
MDCK cells were seeded at an initial density of 3 × 10⁵ cells per well on glass coverslips in a 6-well plate and allowed to attach for 2 days. Then, the medium was replaced with fresh medium containing Lissamine-Rhodamine labelled liposomes (500 μM total lipid concentration) and incubated in the dark. After 3 and 6 hours of incubation, the medium was removed and cells were washed with PBS. Cellular binding of the labelled liposomes was imaged by laser scanning confocal microscopy (LSCM) using a Plan-Neofluar 40×/1.3 Oil DIC objective (Zeiss LSM 510, METU, Central Lab.). The fluorescence intensity around the cells was measured using ImageJ Software and the corrected fluorescence (CF) values were calculated according to the following formulaCF = Mean fluorescence of selected region – Mean fluorescence of background,where the mean fluorescence is the integrated fluorescence intensity per unit area.19
2.12. Statistical analysis
In comparing the groups for a single parameter, one-way analysis of variance (ANOVA) test was applied with Tukey's multiple comparison test for the post-hoc pairwise comparisons (SPSS-22 software program, SPPS Inc., USA). Differences were considered significant for p < 0.05.
3. Results and discussion
3.1. Characterization of maltodextrin
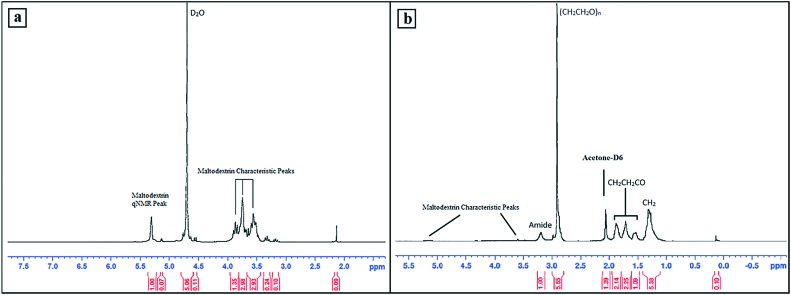
H NMR analysis (Bruker AVANCE, 300 MHz) was performed to confirm the characteristic peaks of maltodextrin and DSPE-PEG–maltodextrin conjugate (Fig. 2). Maltodextrin peaks were detected in the 3.5–4.0 ppm region and qNMR protons were observed at 5.308 ppm.20 The H NMR peaks of DSPE-PEG–maltodextrin were detected as DSPE related peaks at 0.88 ppm (CH3), 1.30 ppm (CH2) and between 1.53–1.88 ppm (CH2CH2CO), a PEG related peak at 2.91 ppm, and maltodextrin peaks between 3.00–5.50 ppm.21 The broad peak of protons around the N group was visualised at 3.2 ppm, indicating the amide link.
Fig. 2. The H NMR spectrum of maltodextrin (a) and DSPE-PEG–maltodextrin conjugate (b).
3.2. Carboxymethylation and conjugation of maltodextrin to the DSPE-PEG molecule
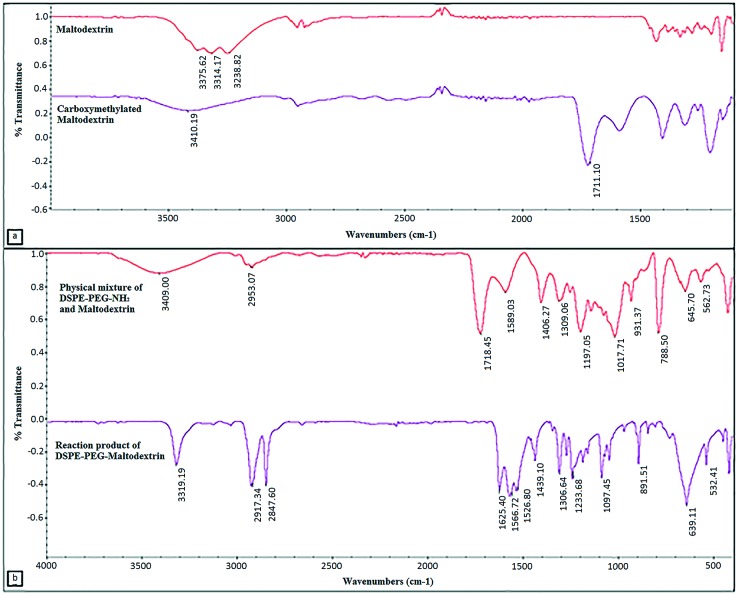
The FTIR spectra of unreacted maltodextrin and carboxymethylated maltodextrin reveal the modification of hydroxyl groups with carboxymethyl groups. The intensity of hydroxyl group peaks (3200–3550 cm–1) was reduced by modification and the carboxyl bond (1649–1780 cm–1) peak appeared, thus showing the carboxymethylation of maltodextrin (Fig. 3a). The amount of carboxymethylation was estimated as the ratio of modified hydroxyl groups to unmodified hydroxyl groups. Roughly, 62.68% of the hydroxyl groups were found to be carboxymethylated. The spectra of the physical mixture and reaction product of maltodextrin and DSPE-PEG(2000) amine are given in Fig. 3b. The decrease in the intensity of amine bond (3180–3500 cm–1) and carboxyl bond (1649–1780 cm–1) bands and the increase in intensity of the amide bond (1600–1640 cm–1) confirmed the conjugation. The conjugation efficiency was calculated from the intensity decrease of amine bonds; it was found that 44.76% of the amine groups disappeared due to lipid conjugation.
Fig. 3. ATR-FTIR spectra of a) maltodextrin and carboxymethylated maltodextrin (3200–3550 cm–1: hydroxyl bond (–OH), 1649–1780 cm–1: carboxyl bond (–COOH)). b) ATR-FTIR spectra of the physical mixture of DSPE-PEG(2000) amine & carboxymethylated maltodextrin and reaction product DSPE-PEG–maltodextrin (3180–3500 cm–1: amine bond (–NH2), 1649–1780 cm–1: carboxyl bond (–COOH), and 1600–1640 cm–1: amide bond (N–C O)).
3.3. Particle size distribution and morphology of liposomes
Liposomes were prepared with DPPC : Chol; 8 : 2, 7 : 3, and 6 : 4 molar ratios at 38, 40, 42 and 44 °C by considering that levodopa is not stable above 45 °C. It was also difficult to obtain liposomes in the desired size range through the extrusion process below 38 °C. Liposomes were prepared in the 100–150 nm size range which sustains a longer circulation time in the bloodstream.21,22
Liposomes had a monodisperse size distribution, (PdI ≤ 0.1) (Table 1), indicating that changing the lipid composition or drug loading does not alter the particle size distribution. Unilamellar morphology and size distribution were shown by TEM images (Fig. S1‡).
Table 1. Size distribution of levodopa loaded liposome groups prepared at 40 °C.
| Types of liposome | Liposome formulation | z-average diameter | PdI |
| Conventional liposome | DPPC : Chol 8 : 2 | 117.7 nm | 0.018 |
| DPPC : Chol 7 : 3 | 123.9 nm | 0.018 | |
| DPPC : Chol 6 : 4 | 138.1 nm | 0.109 | |
| PEGylated liposome | (2%) PEG/LUV | 137.0 nm | 0.035 |
| (4%) PEG/LUV | 129.2 nm | 0.030 | |
| Targeted liposome | (0.35%) MD-(4%) PEG/LUV | 130.8 nm | 0.054 |
| (0.7%) MD-(4%) PEG/LUV | 124.8 nm | 0.049 | |
| (20 μM) GSH-(0.7%) MD-(4%) PEG/LUV | 129.4 nm | 0.045 | |
| (40 μM) GSH-(0.7%) MD-(4%) PEG/LUV | 128.9 nm | 0.070 |
3.4. Encapsulation efficiency, loading and lipid recovery
The levodopa encapsulation efficiency and loading were between 50–80% and 22–45% (Table 2). Lipid recovery was low (40 to 57%), probably due to low extrusion temperatures. Among the conventional liposome groups, DPPC : Chol (7 : 3) prepared at 40 °C had the highest drug encapsulation efficiency and loading. That is why the DPPC : Chol (7 : 3) lipid composition and 40 °C preparation temperature were used to develop PEGylated and targeted liposomes. Although PEGylation resulted in a significant difference in terms of drug encapsulation efficiency, lipid recovery, and drug loading (Tables 2 and 3), when the PEGylation degree increased, there was only a slight increase in encapsulation efficiency. The increase in lipid recovery was related to the enhanced stability of PEGylated liposomes compared to conventional liposomes.23 The levodopa encapsulation efficiency and loading of the 0.7% maltodextrin (MD) conjugated (4%) PEG/LUV group were significantly higher than those of unconjugated and (0.35%) MD conjugated (4%) PEG/LUV.
Table 2. Levodopa encapsulation efficiencies (EE), percent lipid recoveries, and percent levodopa loadings of PEGylated and targeted liposome groups prepared at 40 °C.
| Liposome groups | % EE | % lipid recovery | % drug loading |
| (2%) PEG/LUV | 71.60 ± 0.65 | 47.77 ± 0.37 | 36.92 ± 0.33 |
| (4%) PEG/LUV | 74.57 ± 1.04 | 49.05 ± 0.18 | 38.01 ± 0.63 |
| (0.35%) MD-(4%) PEG/LUV | 71.38 ± 0.21 | 52.46 ± 0.19 | 33.68 ± 0.49 |
| (0.7%) MD-(4%) PEG/LUV | 92.47 ± 2.70 | 52.24 ± 0.19 | 44.25 ± 0.33 |
| (20 μM) GSH-(0.7%) MD-(4%) PEG/LUV | 72.88 ± 0.60 | 50.13 ± 0.17 | 36.34 ± 0.17 |
| (40 μM) GSH-(0.7%) MD-(4%) PEG/LUV | 83.76 ± 2.57 | 51.16 ± 0.17 | 40.93 ± 1.39 |
Table 3. Drug encapsulation efficiencies, percent lipid recoveries, and percent drug loadings of levodopa loaded conventional liposomes prepared at different temperatures.
| T (°C) | Liposome compositions | % drug EE | % lipid recovery | % drug loading |
| 38 °C | DPPC : Cho 8 : 2 | 60.38 ± 1.88 | 40.76 ± 0.15 | 31.95 ± 2.10 |
| DPPC : Cho 7 : 3 | 63.72 ± 4.18 | 42.27 ± 0.16 | 37.68 ± 2.35 | |
| DPPC : Cho 6 : 4 | 61.95 ± 1.32 | 48.62 ± 0.69 | 35.79 ± 0.25 | |
| 40 °C | DPPC : Cho 8 : 2 | 62.09 ± 1.17 | 41.99 ± 0.63 | 31.60 ± 1.08 |
| DPPC : Cho 7 : 3 | 79.83 ± 0.95 | 43.54 ± 0.15 | 45.16 ± 0.70 | |
| DPPC : Cho 6 : 4 | 75.37 ± 4.49 | 51.18 ± 0.18 | 41.84 ± 2.36 | |
| 42 °C | DPPC : Cho 8 : 2 | 50.68 ± 0.62 | 48.32 ± 0.19 | 22.03 ± 0.18 |
| DPPC : Cho 7 : 3 | 53.01 ± 3.67 | 50.10 ± 0.30 | 25.68 ± 1.32 | |
| DPPC : Cho 6 : 4 | 50.04 ± 3.12 | 57.60 ± 0.22 | 24.82 ± 0.98 | |
| 44 °C | DPPC : Cho 8 : 2 | 69.24 ± 3.67 | 42.67 ± 0.14 | 34.97 ± 1.73 |
| DPPC : Cho 7 : 3 | 60.44 ± 0.02 | 40.51 ± 0.14 | 37.30 ± 0.14 | |
| DPPC : Cho 6 : 4 | 66.30 ± 3.64 | 49.46 ± 0.19 | 37.65 ± 1.93 |
Different maltodextrin conjugation amounts did not result in any significant difference in terms of lipid recovery. Levodopa and GSH loaded targeted liposomes had lower levodopa encapsulation efficiency and loading than only levodopa loaded targeted liposomes probably due to partitioning for encapsulation in the aqueous core (Table 2). Yet, the encapsulation efficiency values of GSH were high (82.95–86.98%) probably due to its smaller size (Table 4).
Table 4. GSH encapsulation efficiencies of targeted levodopa loaded (LD) liposomes with two different initial GSH loadings.
| Liposome groups | % GSH EE |
| LD-(20 μM) GSH-(0.7%) MD-(4%) PEG/LUV | 82.95 ± 1.99 |
| LD-(40 μM) GSH-(0.7%) MD-(4%) PEG/LUV | 86.98 ± 3.28 |
3.5. In vitro release profiles
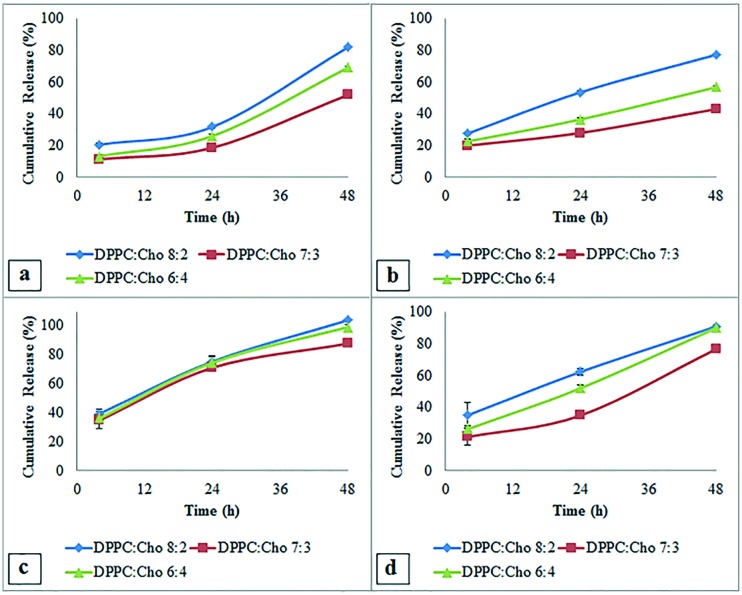
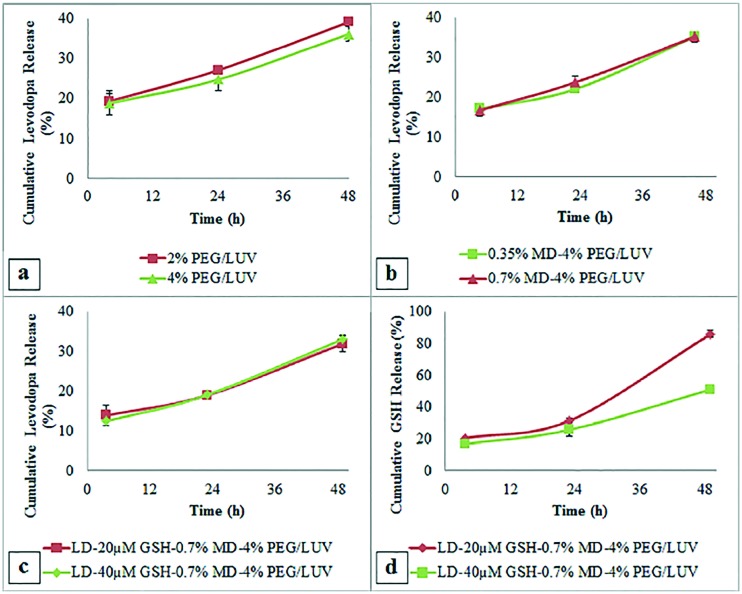
Liposome formulations had similar drug release profiles with a small burst release after 4 hours. Among conventional LUVs, those prepared at 38 °C and 40 °C had slower drug release profiles (Fig. 4a and b) and the group with a DPPC : Chol ratio of 7 : 3 prepared at 40 °C had the slowest cumulative drug release (29.99 ± 0.81% and 44.98 ± 1.63% at 24 and 48 hours, respectively).
Fig. 4. Effect of extrusion temperature on the release of levodopa from DPPC : Chol (8 : 2, 7 : 3, and 6 : 4 m : m) liposomes prepared at a) 38 °C, b) 40 °C, c) 42 °C and d) 44 °C.
The rate of levodopa release from PEGylated liposomes was slightly decreased compared to that of the unPEGylated and also when the PEGylation degree increased from 2% to 4% (Fig. 5a). The group (4%) PEG/LUV was found to be optimal, having the slowest drug release. PEGylated liposomes were shown to have prolonged drug release, avoiding fluctuations in plasma concentration.24 The cumulative drug release of MD targeted liposomes was similar to the untargeted (4%) PEG/LUV formulation (Fig. 5b); addition of MD showed no significant effect on drug release.
Fig. 5. In vitro release profile of levodopa from a) PEGylated liposomes with 2 and 4% PEG ratios, b) targeted liposomes with 0.35 and 7% of maltodextrin conjugation and c) 0.7% maltodextrin modified targeted liposomes with 20 and 40 μM GSH co-loadings. d) In vitro release profile of GSH from 0.7% maltodextrin modified targeted liposomes with 20 and 40 μM GSH co-loadings.
Considering these results, the 0.7% MD group was chosen for GSH co-loading studies. Of the two different initial loadings of GSH, the 40 μM loaded group had the slowest cumulative levodopa release (19.12 ± 0.97% and 31.07 ± 1.98% at 24 and 48 hours, respectively) (Fig. 5c). This group also had a slower GSH release profile with 26% and 50% release after 24 and 48 hours (Fig. 5d).
In Parkinson's disease therapy, controlled release of levodopa needs to be sustained in order to increase drug bioavailability and decrease drug side effects. Studies revealed that brain targeted liposomes are able to reach the brain in the following 8 hours after intravenous administration.25 In the case of the developed maltodextrin targeted system, after the accumulation of liposomes in the brain occurred, release would continue at the site and sustain increased deposition of levodopa in the cells. Thus, a longer term treatment efficacy could be expected. Besides that, neurodegenerative diseases were reported to be associated with oxidative damage on neurons due to deficiency of antioxidants.16,26 The aim of encapsulating GSH was to maintain both levodopa and liposome stability while delivering an antioxidant to the cells.
3.6. In vitro cytotoxicity results
In cytotoxicity experiments, 3T3 cells were used as a standard fibroblast cell line,27 whereas the SH-SY5Y cell line was specifically studied for brain cytotoxicity experiments as a model neuronal cell line due to its similar biochemical characteristics to human dopaminergic neurons.28 Viabilities of both 3T3 and SH-SY5Y cells were decreased with increasing levodopa treatment time and concentration, in agreement with the literature.29,30 The decrease in viability at high levodopa concentrations was due to auto-oxidation of cells by quinone formation.31 However, the cellular toxicity of levodopa is considered to be moderate up to 100 μM.30 The relative viabilities of 3T3 and SH-SY5Y cells after 48 hours of incubation with 100 μM levodopa were 82.60 ± 5.35% and 85.84 ± 3.93% (Fig. 6a and b). However, the viabilities increased with addition of GSH; after 48 h of incubation with 100 μM levodopa and 0.06 μM GSH, the 3T3 and SH-SY5Y cell viabilities were 93.14 ± 2.81% and 92.85 ± 1.27% (Fig. 6c and d). GSH is able to protect cells from oxidation as a reducing agent with the thiol group in its cysteine moiety which led to the increase in viability.32 When treated with liposomes, the viability of 3T3 cells was slightly higher than those of SH-SY5Y cells (Fig. 6e and f). 3T3 cells also had slightly higher viability when incubated with empty liposomes than loaded liposomes at 24 hour incubation periods. Yet, all the viabilities were approximately 90%, suggesting a very low level of toxicity. The viability values of SH-SY5Y cells were not significantly lower than that of 3T3 cells. The lower viability of human neuroblastoma (SH-SY5Y) cells was also observed in other studies due to the sensitivity of this cell line to oxidative stress leading to simultaneous apoptotic and necrotic cell death.33 Unlike free drug and antioxidant experiments, drug loaded and drug and antioxidant loaded liposomes had similar cytotoxicity on the same cell lines at the same incubation periods.
Fig. 6. Percent cell viabilities were calculated by accepting only cell wells as the control with 100% cell viability. Cellular viability of 3T3 cells after a) 24 hours and b) 48 hours of treatment with levodopa or levodopa and GSH (0.06 μM), α: statistically significant difference between different dose groups (p < 0.05), β: statistically significant difference between 100 μM levodopa and other different dose groups (p < 0.05); cellular viability of SH-SY5Y cells showed after c) 24 hours and d) 48 hours of treatment with levodopa or levodopa and GSH (0.06 μM); cellular viability of e) 3T3 cells and f) SH-SY5Y cells after 24 hours (1st bars) and 48 hours (2nd bars) of treatment with liposomes.
The protective effect of the antioxidant on cells was not clearly observed probably due to controlled release of GSH from liposomes as compared to the high concentration free GSH experiment. However, both cells were quite viable after 48 hours of incubation with liposomes. In the literature, 85% in vitro viability was reported safe for in vivo studies.34
3.7. In vitro BBB delivery of liposomes
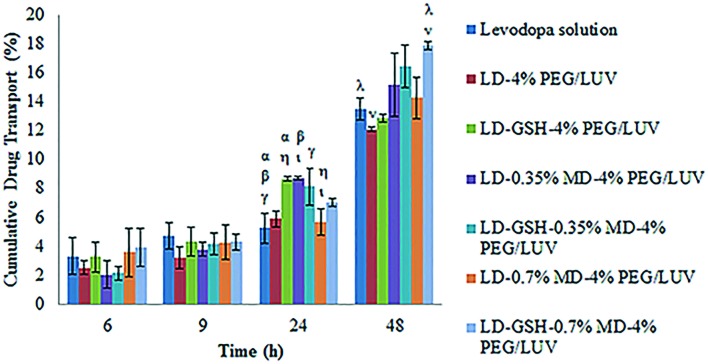
In order to evaluate the levodopa delivery of liposomes across the BBB, the PAMPA-BBB model was used. No significant difference was observed among groups after 6 and 9 hours of incubation (Fig. 7). After 24 and 48 hours of incubation, targeted liposomal formulations had higher amounts of drug passage than free levodopa solution. Liposome encapsulation would not only increase the bioavailability of levodopa but also enhance the drug transport through the BBB. Drug and antioxidant loaded liposomes had higher amounts of drug delivery than only drug loaded liposome, revealing that addition of GSH increased the stability of levodopa. After 48 hours of incubation, drug and antioxidant loaded targeted and untargeted liposomes had 14.44 ± 0.15%, 17.89 ± 0.28% and 12.85 ± 0.28% drug passage, respectively. These data show that the conjugation of the targeting molecule, maltodextrin, and the increased maltodextrin ratio enhanced the PAMPA-BBB penetration of liposomes.
Fig. 7. In vitro passive transport of levodopa solution and levodopa loaded liposomal formulations through the PAMPA-BBB model. α, β, γ, η, ι: statistically significant differences between different experimental groups after 24 hours of incubation (p < 0.05), λ, ν: statistically significant differences between different experimental groups after 48 hours of incubation (p < 0.05).
In accordance with levodopa transport, phospholipid delivery through the membrane was increased with the addition of GSH (Fig. 8), revealing that addition of antioxidant increased the bioavailability of both drug and liposome. After 48 hours of incubation, the most significant difference was observed between LD-(4%) PEG/LUV and LD-GSH-(0.7%) MD-(4%) PEG/LUV groups (p = 0.001).
Fig. 8. Comparison of in vitro passive phospholipid transport of drug loaded liposomes through the PAMPA-BBB model after 48 hours of incubation. α, β, γ, δ, ε: statistically significant differences between different experimental groups after 48 hours of incubation (p < 0.05).
One of the parameters that can affect passive membrane permeability is the charge of the particle and passive membrane permeability was reported to increase with decreasing charge.35 In order to comment on the PAMPA-BBB diffusion of liposome groups, the zeta potential values (Table S1‡) were analysed. After 48 hours of incubation, the LD-(4%) PEG/LUV group that has a high negative charge (–5.94 mV) showed the lowest levodopa and phospholipid transport. The incorporation of DSPE-PEG–maltodextrin molecules into the structure has decreased the negative charge which improved the transport through PAMPA-BBB. The liposome group with the lowest charge (–0.46 mV) was the LD-GSH-(0.7%) MD-(4%) PEG/LUV which had the highest PAMPA-BBB permeability.
Transport by liposome is desirable to preserve bioactivity and increase bioavailability of the levodopa since it has a very low plasma half-life (i.e. 0.75–1.50 hours).36 In the literature for drug targeting to the brain, various polysaccharides such as mannose,37 pullulan,38 dextran and amylopectin39 were conjugated to the liposome surface for brain transport via receptor mediated endocytosis. Polysaccharide coated liposomes were reported to be advantageous in targeting specific organs and cells with good physical and biochemical stability.40 In this study maltodextrin conjugated liposomes were developed for brain drug delivery since maltodextrin was shown to increase brain transport of drugs.41
3.8. Cellular association of liposomes
MDCK cells were used in this study because MDCK cells have a high number of glucose42 and galectin43 receptors as in natural cells of the BBB. MDCK cells were treated with fluorescently labelled PEGylated and targeted liposomes for 3 and 6 hours in order to observe cellular binding with respect to time.
Targeted liposomes had higher cellular association, yielding higher fluorescence intensity around the cells. After 6 hours of incubation, a statistically significant difference was obtained between untargeted and targeted liposomes (Fig. 9a). The merged LSCM images reveal that the targeted liposomes had more homogenous cellular binding throughout the cell population when compared with the untargeted PEGylated liposomes, (4%) PEG/LUV (Fig. 9b–e). Therefore, the targeted liposomal formulation (0.7%) MD-(4%) PEG/LUV is thought to be promising for brain drug delivery via receptor-mediated endocytosis.
Fig. 9. a) Corrected fluorescence intensity of the MDCK cells after 3 and 6 hours of treatment with untargeted, (4%) PEG/LUV, and targeted, (0.7%) MD-(4%) PEG/LUV, liposomal formulations. α, β, γ: statistically significant difference between different experimental groups (p < 0.05). LSCM images of the MDCK cells treated with (b and c) Rhodamine labelled untargeted PEGylated liposome, (4%) PEG/LUV, and (d and e) Rhodamine labelled targeted liposome, (0.7%) MD-(4%) PEG/LUV (×40).
3.9. Stability of liposomes
The final liposomal formulation, LD and 40 μM GSH loaded (0.7%) MD attached (4%) PEG/LUV was tested for stability. The particle size of the liposomes stored at 4 °C increased slightly in the first 5 months (Table 5). Aggregation of liposomes was revealed by the sharp increase in average size and PdI after the 5th month. On the other hand, the increase in particle size and PdI started from the 1st week when stored at 25 °C. The increase in PdI values indicates instability due to aggregation, fusion or precipitation.
Table 5. The particle size distribution and zeta potential values of the developed liposomal system (maltodextrin conjugated (7%), levodopa and GSH (40 μM) co-loaded liposome) stored at 4 °C and 25 °C for 6 months.
| Month | Liposomes at 4 °C |
Liposomes at 25 °C |
||||
| z-average (nm) | PdI | Zeta potential (mV) | z-average (nm) | PdI | Zeta potential (mV) | |
| 0 | 128.9 | 0.070 | –0.46 | 128.9 | 0.070 | –0.46 |
| 1 | 126.4 | 0.064 | –4.79 | 142.4 | 0.116 | –3.79 |
| 2 | 125.8 | 0.058 | –8.87 | 158.1 | 0.127 | –8.51 |
| 3 | 139.2 | 0.076 | –17.60 | 160.2 | 0.148 | –16.00 |
| 4 | 131.0 | 0.101 | –27.10 | 161.6 | 0.164 | –19.60 |
| 5 | 138.2 | 0.126 | –29.20 | 159.2 | 0.171 | –21.80 |
| 6 | 155.6 | 0.158 | –34.4 | 182.0 | 0.175 | –24.70 |
Initially, liposomes had nearly neutral surface charges. Liposomes stored at 4 °C and 25 °C had similar zeta potential values at the same time points. Liposomes were less stable at 25 °C. The liposomes stored at 4 °C were tested for drug release after 6 months of incubation. Only 15.6% of the initially encapsulated levodopa was found to be released. This concludes that the liposome formulation was quite stable at 4 °C for 5 to 6 months.
Conclusions
A new treatment system for Parkinson's disease was designed with dual loading of levodopa and GSH into liposomes which were further modified with maltodextrin for brain targeting. The final formulation of levodopa and GSH co-loaded targeted liposomes (LD-GSH-(0.7%) MD-(4%) PEG/LUV) was found promising for the brain drug delivery with controlled and sustained drug release properties, lesser cellular cytotoxicity, good BBB transport, and improved cellular binding. Hence, it may be suggested for further investigations to show the increased efficacy of levodopa treatment in Parkinson's disease with decreased drug side effects.
Supplementary Material
Acknowledgments
This project was financially supported by the Middle East Technical University (Project BAP-03-10-2013-002).
Footnotes
†The authors declare no competing interests.
‡Electronic supplementary information (ESI) available. See DOI: 10.1039/c7md00045f
References
- Schapira A. H. Trends Pharmacol. Sci. 2009;30:41–47. doi: 10.1016/j.tips.2008.10.005. [DOI] [PubMed] [Google Scholar]
- Jorg M., Kaczor A. A., Mak F. S., Lee K. C. K., Poso A., Miller N. D., Scammells P. J., Capuano B. Med. Chem. Commun. 2014;5:891–898. [Google Scholar]
- Thanvi B. R., Loi T. Postgrad. Med. J. 2004;80:452–458. doi: 10.1136/pgmj.2003.013912. [DOI] [PMC free article] [PubMed] [Google Scholar]
- Chao O. Y., Mattern C., Silva A. M., Wessler J., Ruocco L. A., Nikolaus S., Huston J. P., Pum M. E. Brain Res. Bull. 2012;87:340–345. doi: 10.1016/j.brainresbull.2011.11.004. [DOI] [PubMed] [Google Scholar]
- Huang L., Deng M., He Y., Lu S., Ma R., Fang Y. Clin. Exp. Pharmacol. Physiol. 2016;43:634–643. doi: 10.1111/1440-1681.12570. [DOI] [PubMed] [Google Scholar]
- Torchilin V. P. Nat. Rev. Drug Discovery. 2005;4:145–160. doi: 10.1038/nrd1632. [DOI] [PubMed] [Google Scholar]
- Ponka P., Lok C. N. Int. J. Biochem. Cell Biol. 1999;31:1111–1137. doi: 10.1016/s1357-2725(99)00070-9. [DOI] [PubMed] [Google Scholar]
- Gosk S., Vermehren C., Storm G., Moos T. J. Cereb. Blood Flow Metab. 2004;24:1193–1204. doi: 10.1097/01.WCB.0000135592.28823.47. [DOI] [PubMed] [Google Scholar]
- Qin Y., Fan W., Chen H., Yao N., Tang W., Tang J., Yuan W., Kuai R., Zhang Z., Wu Y., He Q. J. Drug Targeting. 2010;18:536–549. doi: 10.3109/10611861003587235. [DOI] [PubMed] [Google Scholar]
- Garnero C., Chattah A. K., Longhi M. Carbohydr. Polym. 2013;94:292–300. doi: 10.1016/j.carbpol.2013.01.055. [DOI] [PubMed] [Google Scholar]
- Jallouli Y., Paillard A., Chang J., Sevin E., Betbeder D. Int. J. Pharm. 2007;344:103–109. doi: 10.1016/j.ijpharm.2007.06.023. [DOI] [PubMed] [Google Scholar]
- Hofman D. L., Van Buul V. J., Brouns F. J. P. H. Crit. Rev. Food Sci. Nutr. 2016;56:2091–2100. doi: 10.1080/10408398.2014.940415. [DOI] [PMC free article] [PubMed] [Google Scholar]
- Senior J. H. Crit. Rev. Ther. Drug Carrier Syst. 1987;3:123–193. [PubMed] [Google Scholar]
- Sies H. Biol. Med. 1999;27:916–921. doi: 10.1016/s0891-5849(99)00177-x. [DOI] [PubMed] [Google Scholar]
- Shrestha J. P., Subedi Y. P., Chen L., Chang C. W. T. Med. Chem. Commun. 2015;6:2012–2022. [Google Scholar]
- Sian J., Dexter D. T., Lees A. J., Daniel S., Agid Y., Javoy-Agid F., Jenner P., Marsden C. D. Ann. Neurol. 1994;36:348–355. doi: 10.1002/ana.410360305. [DOI] [PubMed] [Google Scholar]
- Dodi G., Hritcu D., Popa M. I. Cellul. Chem. Technol. 2011;45:171–176. [Google Scholar]
- Stewart J. C. M. Anal. Biochem. 1980;104:10–14. doi: 10.1016/0003-2697(80)90269-9. [DOI] [PubMed] [Google Scholar]
- Abramoff M. D., Magalhaes P. J., Ram S. J. Biophotonics Intern. 2004;11:36–42. [Google Scholar]
- Bai Y., Shi Y. C. Carbohydr. Polym. 2011;83:520–527. [Google Scholar]
- Lopes-de-Araújo J., Neves A. R., Gouveia V. M., Moura C. C., Nunes C., Reis S. Pharm. Res. 2016;33(2):301–314. doi: 10.1007/s11095-015-1788-x. [DOI] [PubMed] [Google Scholar]
- Gabathuler R. Neurobiol. Dis. 2010;37:48–57. doi: 10.1016/j.nbd.2009.07.028. [DOI] [PubMed] [Google Scholar]
- Yang T., Cui F. D., Choi M. K., Cho J. W., Chung S. J., Shim C. K., Kim D. D. Int. J. Pharm. 2007;338:317–326. doi: 10.1016/j.ijpharm.2007.02.011. [DOI] [PubMed] [Google Scholar]
- Reddy K. R. Ann. Pharmacother. 2000;34:915–923. doi: 10.1345/aph.10054. [DOI] [PubMed] [Google Scholar]
- Gaillard P. J., Appeldoorn C. C. M., Rip J., Dorland R., Pol S. M. A., Kooij G., Vries H., Reijerkerk A. J. Controlled Release. 2012;164:364–369. doi: 10.1016/j.jconrel.2012.06.022. [DOI] [PubMed] [Google Scholar]
- Perry T. L., Godin D. V., Hansen S. Neurosci. Lett. 1982;33:305–310. doi: 10.1016/0304-3940(82)90390-1. [DOI] [PubMed] [Google Scholar]
- Tsuchiya T., Ikarashi Y., Hata H., Toyoda K., Takahashi M., Uchima T., Tanaka N., Sasaki T., Nakamura A. J. Appl. Biomater. 1993;4:153–156. doi: 10.1002/jab.770040206. [DOI] [PubMed] [Google Scholar]
- Xie H. R., Hu L. S., Li G. Y. Chin. Med. J. 2010;123:1086–1092. [PubMed] [Google Scholar]
- Mytilineou C., Han S. K., Cohen G. J. Neurochem. 1993;61:1470–1478. doi: 10.1111/j.1471-4159.1993.tb13642.x. [DOI] [PubMed] [Google Scholar]
- Jin C. M., Yang Y. J., Huang H. S., Kai M., Lee M. K. Neuroscience. 2010;170:390–398. doi: 10.1016/j.neuroscience.2010.07.039. [DOI] [PubMed] [Google Scholar]
- Raffray M., Gerald M. C. Pharmacol. Ther. 1997;75:153–177. doi: 10.1016/s0163-7258(97)00037-5. [DOI] [PubMed] [Google Scholar]
- Wang X. J., Xu J. X. Neurosci. Lett. 2005;376:127–132. doi: 10.1016/j.neulet.2004.11.041. [DOI] [PubMed] [Google Scholar]
- Yu Z., Li W., Hillman J., Brunk U. T. Brain Res. 2004;1016:163–169. doi: 10.1016/j.brainres.2004.04.075. [DOI] [PubMed] [Google Scholar]
- Katayama K., Sunamoto J., Takada M. and Yuzuriha T., U.S. Pat., 4636381, 1987.
- Leung S. S. F., Mijalkovic J., Borrelli K., Jacobson M. P. J. Chem. Inf. Model. 2012;52:1621–1636. doi: 10.1021/ci200583t. [DOI] [PMC free article] [PubMed] [Google Scholar]
- Contin M., Riva R., Martinelli P., Cortelli P., Albani F., Baruzzi A. Neurology. 1994;44:1287–1292. doi: 10.1212/wnl.44.7.1287. [DOI] [PubMed] [Google Scholar]
- Umezawa F., Eto Y. Biochem. Biophys. Res. Commun. 1998;153:1038–1044. doi: 10.1016/s0006-291x(88)81333-0. [DOI] [PubMed] [Google Scholar]
- Ochi A., Shibata S., Mori K., Sato T., Sunamoto J. Drug Delivery Syst. 1990;5:261–271. [Google Scholar]
- Cheng N., Maeda T., Kume T. Brain Res. 1996;743:278–283. doi: 10.1016/s0006-8993(96)01056-6. [DOI] [PubMed] [Google Scholar]
- Sihorkar V., Vyas S. P. J. Pharm. Pharm. Sci. 2001;4:138–158. [PubMed] [Google Scholar]
- Merli V., Adrienne P. and Aronhime K. J., U.S. Pat., 7462743, 2008.
- Hasegawa T., Matsuzaki T., Tajika Y., Ablimit A., Suzuki T., Aoki T., Hagiwara H., Takata K. Histochem. Cell Biol. 2007;127:233–241. doi: 10.1007/s00418-006-0264-4. [DOI] [PubMed] [Google Scholar]
- Poland P. A., Rondanino C., Kinlough C. L., Heimburg-Molinaro J., Arthur C. M., Stowell S. R., Smith D. F., Hughey R. P. J. Biol. Chem. 2011;286:6780–6790. doi: 10.1074/jbc.M110.179002. [DOI] [PMC free article] [PubMed] [Google Scholar]
Associated Data
This section collects any data citations, data availability statements, or supplementary materials included in this article.


