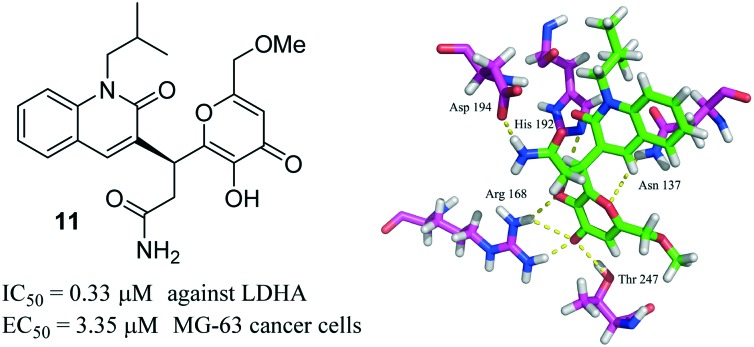
 A novel inhibitor with good inhibitory potency (IC50 = 0.33 μM) against LDHA, which reduces the growth of MG-63 cancer cells (EC50 = 3.35 μM), was reported herein.
Abstract
Human lactate dehydrogenase A (LDHA) has been identified as a potential therapeutic target in the area of cancer metabolism. Herein, we report the discovery of novel LDHA inhibitors through docking-based virtual screening and biological assays. The primary enzymatic assay suggested that compound 11 targeted LDHA with an IC50 value of 0.33 μM. The in vitro cytotoxic assay demonstrated that compound 11 reduced the growth of MG-63 cancer cells with an EC50 value of 3.35 μM. Finally, we found that compound 11 induced the apoptosis of MG-63 cancer cells in a dose dependent manner, upregulated the oxygen consumption rate (OCR), and decreased the lactate formation and extracellular acidification rate (ECAR) in MG-63 cancer cells. Collectively, our data suggested that compound 11 could be a promising lead for the development of potent LDHA inhibitors.
1. Introduction
Tumor cells frequently show a metabolic alteration as compared to normal cells.1 Instead of mitochondrial oxidative phosphorylation (OXPHOS) utilized by healthy cells, most tumor cells rely more on glycolysis for ATP production, even in the presence of normal oxygen levels.2,3 This metabolic alteration has been recognized as an emerging hallmark of cancer; the selective disruption of the altered metabolic processes could offer therapeutic opportunities for cancer treatment.
Among the enzymes involved in glycolysis, LDHA catalyzes the conversion of pyruvate to lactate in the final step of glycolysis.4 It has been reported that LDHA was overexpressed in many types of cancer cells5 and correlated with tumor size and poor prognosis.6 The elevated expression of LDHA could cause higher lactate formation, resulting in a low pH and facilitating tumor invasion and metastasis.7 In addition, the depletion of LDHA by shRNA in tumor cells induced a reduction in tumor growth and markedly delayed tumor migration and in vivo tumorigenesis.8 Together, these facts indicated that LDHA could be an attractive target for the treatment of cancer.
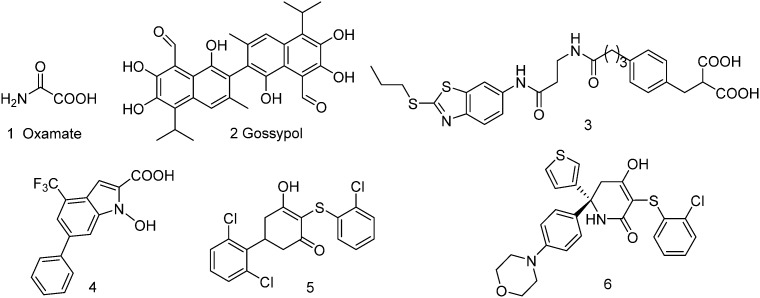
To date, a number of LDHA inhibitors have been reported in the scientific literature (compounds 1–6, Fig. 1). The earliest reported LDHA inhibitor is oxamate (Fig. 1), which inhibits LDHA activity by targeting its pyruvate binding pocket, but oxamate is a weak LDHA inhibitor and lacks selectivity, with a Ki value of 136.0 μM against LDHA and 94.4 μM against human lactate dehydrogenase B (LDHB).9 Gossypol (2) is a natural polyphenol dialdehyde, which could inhibit the growth of many types of cancer cells (mean EC50 = 20 μM)10 and showed an ability to inhibit LDHA (Ki = 1.9 μM) activity, but there is a serious concern about toxicity because of its highly reactive chemical structure. The catechol hydroxyl and aldehyde groups are highly sensitive and generate toxic metabolites, which could interact with several cellular components in biological systems and disturbed many cellular functions.11 Diacid malonate scaffold-based 3 displayed an IC50 value of 0.27 μM and a Kd value of 8 nM (BIAcore binding affinity assay) against LDHA, but lacked cellular activity.12N-Hydroxyindole 4 was demonstrated as a promising LDHA inhibitor, which also showed inhibitory potency toward tumor cells.13 Another LDHA inhibitor is 5, with an IC50 value of 0.87 μM against LDHA in vitro. Unfortunately, this compound is inactive in cell-based assays.14 Recently, Purkey et al. reported the optimization of an analog of compound 5, from which a cell active molecule 6 (MiaPaca2 EC50 = 0.67 μM) with potent LDHA inhibitory activity (IC50 = 3 nM) was discovered.15
Fig. 1. Chemical structures of the representative human LDHA inhibitors.
Though a large amount of LDHA inhibitors has been reported, only a few of them were pushed into clinical trials or successfully entered into the market. Therefore, the discovery of potent LDHA inhibitors with good pharmacokinetics is urgently needed. Herein, we report the use of docking-based virtual screening and biological assays for the discovery of novel LDHA inhibitors with good antiproliferative activity against MG-63 cancer cells.
2. Results and discussion
2.1. Identified LDHA inhibitors through a docking-based virtual screening method
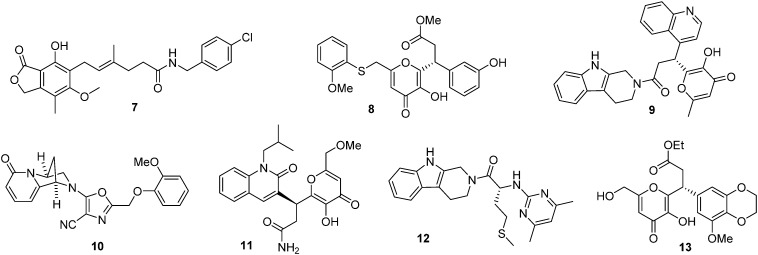
Firstly, the crystal file of a human LDHA–compound 5 complex (PDB entry ; 4QO8) was chosen as a template for molecular docking. The complex was downloaded from the protein data bank (; http://www.rcsb.org/pdb), and was then analyzed and optimized by the Sybyl-X 2.0 software package.16 Secondly, a commercially available small molecule library with 20 000 compounds was downloaded from the ZINC database (; http://zinc.docking.org), which was filtered to discard some compounds with unfavorable drug-like properties (350 < molecule weight < 500, –2 < clog p < 5, 0 < rotational bonds < 10, 0 < hydrogen bond donor < 5, 0 < hydrogen bond acceptor < 10, 20 < polar surface area < 140); the remaining 8415 compounds were then optimized by the ligand structure preparation procedure in the software. The polar H of the compounds was added, their energy was optimized with a TRIPOS force field, and their charge was optimized with the Gasteiger–Huckel method. Thirdly, the optimized compounds were docked into the binding pocket of compound 5 in LDHA, and the top-ranked 200 compounds with the highest total binding scores were selected. Potential compounds were chosen if two criteria were satisfied: one was that the compounds should have a total binding score higher than 7.3, which was calculated from the docking between compound 5 and LDHA (PDB entry ; 4QO8). The other one was that the compounds should form no less than two hydrogen bonds with residues of Arg 168, Asn 137, and His 192 in LDHA. Following the two criteria, 7 candidates were identified and purchased from a local supplier for further biological validation (Fig. 2).
Fig. 2. Chemical structures of the LDHA inhibitors identified by virtual screening.
2.2. The identified inhibitors displayed an LDHA inhibitory potency
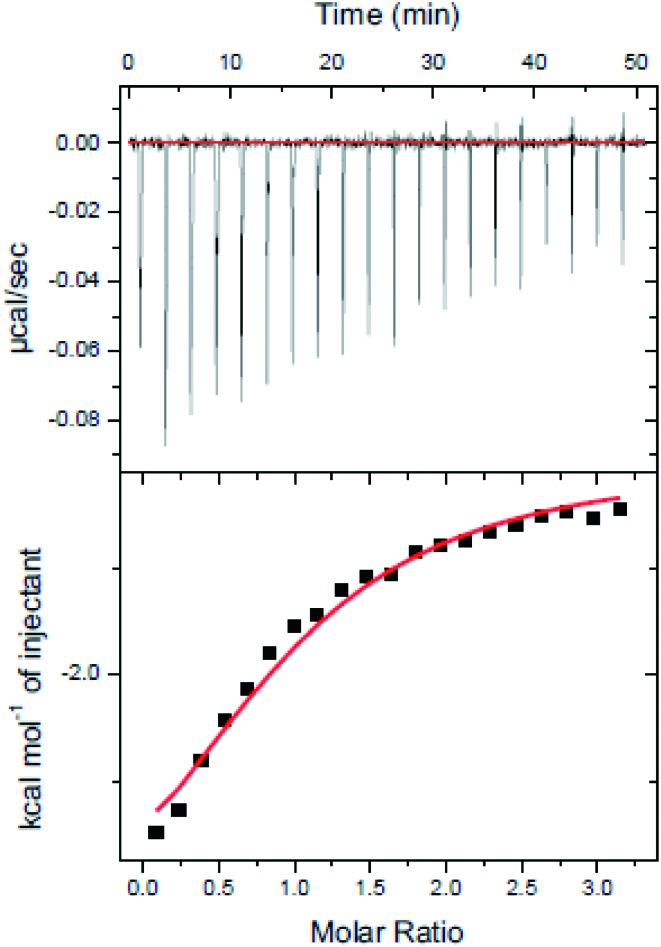
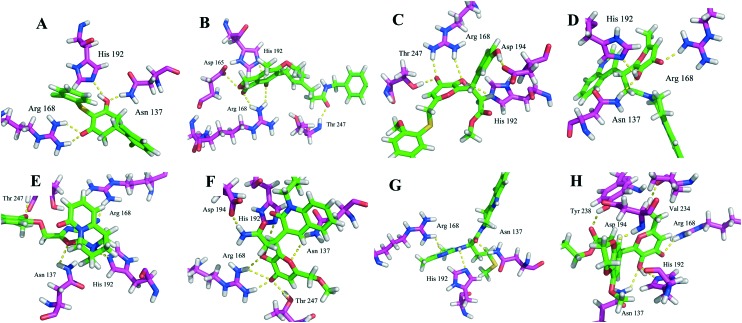
The identified compounds were then tested for their LDHA inhibitory activity by monitoring the disappearance of NADH during the conversion of pyruvate to lactate. As shown in Fig. 3A, most of the identified compounds gave satisfactory LDHA inhibitory activities at 2 μM, and the inhibition rates (%) were 69, 94, and 71 for compounds 10, 11, 13, respectively, which clearly outperformed compound 5 at the same concentration. Since compound 11 displayed the strongest LDHA inhibitory potency, we then pushed forward to test the dose-response behaviour of 11 against LDHA. For comparison purposes, the IC50 value of the reference compound 5 was also measured under the same experimental conditions. As shown in Fig. 3B, the IC50 value was 0.33 μM for compound 11, but for compound 5, the IC50 value was 2.37 μM, which was consistent with the reported data in the literature.14 Then, the LDHA solution was titrated with compound 11 in an isothermal titration calorimetry (ITC) experiment; a Kd value of 0.95 μM was derived (Fig. 5), indicating the direct interaction of compound 11 with LDHA. The elevated inhibitory potency of compound 11 against LDHA could partially be explained by the evidence obtained from our docking experiment. As shown in Fig. 4F, compound 11 maintained the same hydrogen bond interactions as compound 5 (Fig. 4A) in the binding model. Additionally, it picked up extra hydrogen bond interactions with the residues of Asp 194 and Thr 247 in LDHA, which could give rise to its inhibitory activity against LDHA.
Fig. 3. A: The primary enzymatic assay of the LDHA inhibition rates (%) in the presence of 2 μM of the identified inhibitors 7–13 and 5. Values were reported as mean ± SD of three independent experiments. B and C: Dose-response curves of compounds 11 and 5 against human LDHA.
Fig. 5. ITC analysis of compound 11 bound to LDHA. Compound 11 (100 μM) was titrated into the LDHA (10 μM) solution.
Fig. 4. Binding models of the identified inhibitors 7–13 and 5 in the binding pocket of LDHA. (A) Compound 5 was docked into the binding pocket of LDHA. (B–H) Compounds 7–13 were docked into the active site of LDHA. The amino acid residues and the inhibitors were shown as stick models, and H-bonds were shown as yellow dashed lines.
2.3. The identified inhibitors reduced MG-63 cancer cells proliferation
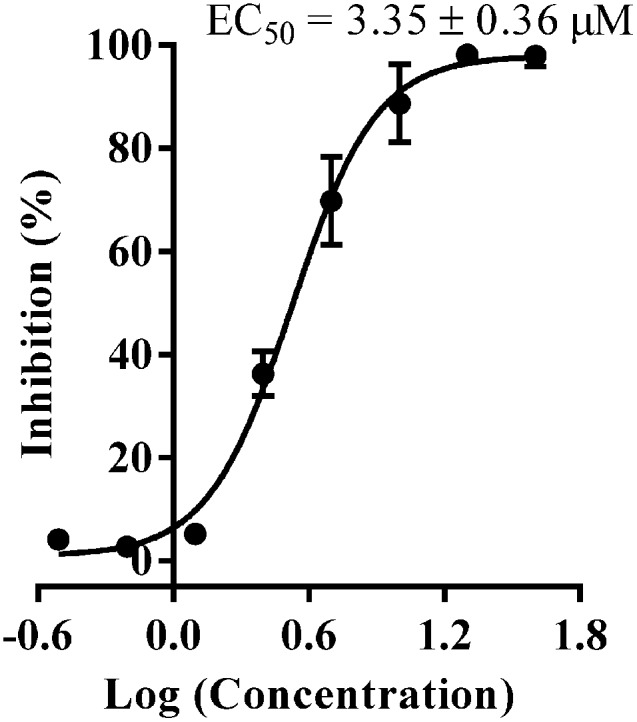
With the compounds displaying promising LDHA inhibitory potencies, next we want to address the question whether the identified compounds reduced the growth of cancer cells. So, we tested the anticancer activity of all identified compounds against the MG-63 cancer cells by an MTT assay. As shown in Table 1, compounds 8–11 and 13 displayed good antiproliferative activity at 10 μM, with the inhibition rates to be 68.9%, 48.7%, 50.2%, 88.7%, and 67.8%, respectively, which strongly inhibited the growth of MG-63 cancer cells. Notably, compound 11 showed the most potent antiproliferative activity with an EC50 value of 3.35 μM (Fig. 6), while compound 5 was inactive against MG-63 cells at the same concentration, which was consistent with the reported data in the literature.14
Table 1. The identified compounds were tested for their growth inhibition rate (%) for the MG-63 cancer cells at 10 μM by an MTT assay.
| Compounds ID | 7 | 8 | 9 | 10 | 11 | 12 | 13 | 5 | Cisplatin b |
| Inhibition rate (%) | NI a | 68.9 ± 7.8 | 48.7 ± 5.9 | 50.2 ± 3.1 | 88.7 ± 8.9 | NH | 67.8 ± 8.9 | NI | 79.5 ± 4.3 |
aNI: No inhibition.
bCisplatin was used as positive control, and the EC50 is 5.42 μM, which was in line with the reference data.17
Fig. 6. Dose-response curve of compound 11 against the MG-63 cancer cells measured by an MTT assay.
To explore the mode of cell death for MG-63 cancer cells, compound 11 was used to induce MG-63 cancer cell apoptosis, which was then examined by the Annexin V-FITC/PI FACS assay. As shown in Fig. 7, the percentages of apoptosis for MG-63 cells treated with compound 11 at 2, 5, and 10 μM for 24 hours were 5.4, 10.0, and 15.9%, respectively. This indicated that compound 11 induced the apoptosis of MG-63 cancer cells in a dose dependent manner.
Fig. 7. Flow cytometry analysis of MG-63 cancer cell apoptosis after being treated with compound 11. The cells were treated with compounds 11 for 24 hours, then stained with FITC Annexin V/PI. Cells in the lower right quadrant indicate PI positive/Annexin V negative, late apoptotic, or necrotic cells. The cells in the upper right quadrant indicate Annexin V-positive/PI positive, early apoptotic cells. *P < 0.05, versus the control group (treated with 1% DMSO PBS).
2.4. The identified inhibitor induced apoptosis, upregulated the OCR, and decreased the lactate formation and ECAR in MG-63 cancer cells
Inhibition of LDHA results in the switch of pyruvate consumption from lactate production to OXPHOS in the mitochondrion; consequently, this switch will lead to the change of the lactate formation, OCR, and ECAR values in cancer cells. To check whether compound 11 could lead to the changes as we mention above, MG-63 cancer cells were treated with compounds 11 and 5 for 4 hours, and then the lactate formation in the cancer cells was monitored using a Nova Bioprofile Flex analyzer (Nova Biomedical). As shown in Fig. 8A, the lactate formation in MG-63 cancer cells significantly decreased with the increase in the concentrations of compound 11, while compound 5 at 10 μM barely altered the lactate formation in MG-63 cancer cells. The dose–response behaviour of compound 11 against the lactate formation in MG-63 cancer cells was also measured, and the IC50 value is 7.19 μM; under the same conditions, the IC50 value of compound 5 was undetectable. The OCR value increased with the treatment of various concentrations of compound 11 (Fig. 8B), suggesting the increase in the level of mitochondrial respiration for MG-63 cancer cells after being treated with compound 11. ECAR decreased, which was consistent with the change of lactate production (Fig. 8C).
Fig. 8. Effect of compounds 5 and 11 on MG-63 cancer cell glycolysis. A: Lactate formation decreased with the treatment of compound 11 for 4 hours. B: OCR increased with the treatment of compound 11 for 6 hours. C: ECAR was significantly decreased using compound 11 for 6 hours. *P < 0.05, versus the control group.
3. Conclusions
In summary, we have discovered a potent LDHA inhibitor through docking-based virtual screening and biological assays. The in vitro primary enzymatic and cytotoxic assays suggested that the candidate compound 11 targeted LDHA with cellular activity. In addition, compound 11 could serve as a modulator to reprogram MG-63 cancer cell metabolism from glycolysis to mitochondrial respiration. Other related experiments of modifying the candidate compound 11 to further improve its LDHA inhibitory potency and anticancer activity will be reported in due course.
4. Methods and materials
4.1. Materials and cell culture
The osteosarcoma cell line MG-63 was bought from ATCC and cultured in DMEM containing 10% fetal bovine serum in 5% CO2 at 37 °C. Cells at exponentially growing stage were used for all biological experiments. The identified compounds 7–13 were purchased from a local agent supplier with purities of no less than 95.0%. Compound 5 was synthesized in our collaborator's lab, and the procedures followed were from a previously reported study.14
4.2. Anti-proliferative activity measurement
The anticancer activity was tested by the MTT assay. A suspension of 90 μL MG-63 cancer cells (2500 per well) was seeded in 96-well plates and cultured overnight. Then, the positive control drug cisplatin and working compound solutions (100 μM) were prepared by diluting the 40 mM compound stock solutions in a PBS buffer. The working compound solutions (100 μM) were added to their corresponding plates (10 μL per well), in which cells were incubated for 72 hours. Then, 10 μL of MTT solution (10×) was added to each well. After 4 hours of incubation, the solvent was removed, and 100 μL DMSO was added to each well. The OD570nM values were read in the Microplate Reader. After the most potent compound 11 was identified, dose–response studies were undertaken to determine its EC50 values. Eight different concentrations of 11 and the positive control drug cisplatin (400, 200, 100, 50, 25, 12.5, 6.25, and 3.1 μM) were added into the 96-well plates. The protocols were used as above mentioned. Lastly, the absorbance of each well was read, and the results were expressed as EC50 values, which were the mean values derived from three independent experiments.
4.3. Lactate measurement
A suspension of MG-63 cancer cells (3 × 10⁵ per well) was seeded in 6-well plates and cultured overnight. Compounds 11 (2, 5, 8, 10, and 12 μM) and 5 (10 μM) were added to their corresponding wells, and the plates were incubated for 4 hours. Then, the medium was transferred into an Eppendorf tube for centrifugation for 5 min (10 000 r min–1). Lastly, 1 mL medium was collected, and the lactate production was evaluated using a Nova Bioprofile Flex analyzer.
4.4. Seahorse XF24 experiment
The XF24 extracellular flux analyzer was used to measure the oxygen consumption rate (OCR) and extracellular acidification rate (ECAR). In this experiment, MG-63 cells (30 000 per well) were first pretreated with different concentrations of the compounds for 6 hours, and then the cells were subjected to the XF24 extracellular flux analyzer for the measurement of OCR and ECAR values.
4.5. Apoptosis detection by flow cytometry
MG-63 cancer cells were seeded at a density of 5 × 10⁵ cells per mL on 6-well plates and were allowed to grow overnight. Then, the cells were treated with compound 11 (2, 5, and 10 μM) for 24 hours at 37 °C. The cells were then trypsinized, repeatedly washed with cold PBS twice, and centrifuged at 800 rpm for 5 min; the supernatants were discarded. The cells were resuspended in a 1× Annexin binding buffer at ∼5 × 10⁵ cells per mL, preparing a sufficient volume of 100 μL per assay. To 100 μL of the cell suspension, 10 μL of Annexin V and 5 μL of PI were added and incubated for 15 min at room temperature. After incubation, 400 μL of PBS was added to each sample and was gently mixed and analyzed immediately using a flow cytometer.
4.6. Human purified LDHA enzymatic assay
The human purified LDHA primary enzymatic assay was performed following the procedures as described from a previous study.14
4.7. ITC analysis
The concentration of LDHA was diluted to 10 μM solution in a buffer solution containing 50 mM Hepes, pH 7.2, 100 mM NaCl, 2 mM DTT, and 1% DMSO. The working solution of compound 11 (100 μM in buffer solution) was prepared by diluting the stock solution of compound 11. NADH was dissolved in double-distilled water. ITC experiments were accomplished using a Microcal iTC200 microcalorimeter (GE Healthcare). The reaction cell contained 250 μL LDHA. Titrations were performed with the injection of 2.5 μL titrant(s) for every increment into the reaction cell, which maintained at 25 °C. All ITC data were initially analyzed using Origin 8, then followed by curve-fitting to a one-site model to obtain binding parameters.
4.8. Molecular docking
Molecular docking was conducted using a Surflex Dock program in the Sybyl-X 2.0 package. The crystal structure of LDHA was obtained from the Protein Data Bank (PDB ID: 4qo8). The crystal structure of LDHA was prepared with all H added and charge added by the AMBER7 FF99 method. The structures of small molecules were downloaded from Zinc database (; http://zinc.docking.org/). Firstly, the commercially available database compounds were filtered, and the remaining compounds were subjected to polar H addition, with their energy being optimized with a TRIPOS force field and their charge being optimized with the Gasteiger–Huckel method. Protomol was generated in ligand mode with the threshold kept at 0.50 and the bloat 0. Ring flexibility was considered, and other parameters during the docking program were determined through a number of attempts.
4.9. Statistical analysis
Data are reported as mean ± SD. Statistical analysis was performed using GraphPad Prism version 6.0 for Windows. *p < 0.05 is considered to be statistically significant.
Conflicts of interest
The authors declare no conflict of interest.
References
- Galluzzi L., Kepp O., Vander Heiden M. G., Kroemer G. Nat. Rev. Drug Discovery. 2013;12:829. doi: 10.1038/nrd4145. [DOI] [PubMed] [Google Scholar]
- (a) Vander Heiden M. G., Cantley L. C., Thompson C. B. Science. 2009;324:1029. doi: 10.1126/science.1160809. [DOI] [PMC free article] [PubMed] [Google Scholar]; (b) Tennant D. A., Duran R. V., Gottlieb E. Nat. Rev. Cancer. 2010;10:267. doi: 10.1038/nrc2817. [DOI] [PubMed] [Google Scholar]
- Warburg O. Science. 1956;123:309. doi: 10.1126/science.123.3191.309. [DOI] [PubMed] [Google Scholar]
- (a) Augoff K., Hryniewicz-Jankowska A., Tabola R. Cancer Lett. 2015;358:1. doi: 10.1016/j.canlet.2014.12.035. [DOI] [PubMed] [Google Scholar]; (b) Ramanathan R., Mancini R. A., Suman S. P., Beach C. M. J. Agric. Food Chem. 2014;62:2112. doi: 10.1021/jf404900y. [DOI] [PubMed] [Google Scholar]; (c) Rani R., Kumar V. J. Med. Chem. 2016;59:487. doi: 10.1021/acs.jmedchem.5b00168. [DOI] [PubMed] [Google Scholar]
- (a) Xie H., Hanai J.-I., Ren J.-G., Kats L., Burgess K., Bhargava P., Signoretti S., Billiard J., Duffy K. J., Grant A., Wang X., Lorkiewicz P. K., Schatzman S., Bousamra M., Lane A. N., Higashi R. M., Fan T. W. M., Pandolfi P. P., Sukhatme V. P., Seth P. Cell Metab. 2014;19:795. doi: 10.1016/j.cmet.2014.03.003. [DOI] [PMC free article] [PubMed] [Google Scholar]; (b) Fantin V. R., St-Pierre J., Leder P. Cancer Cell. 2006;9:425. doi: 10.1016/j.ccr.2006.04.023. [DOI] [PubMed] [Google Scholar]; (c) Koukourakis M. I., Giatromanolaki A., Sivridis E. Tumor Biol. 2003;24:199. doi: 10.1159/000074430. [DOI] [PubMed] [Google Scholar]
- Sheng S. L., Liu J. J., Dai Y. H., Sun X. G., Xiong X. P., Huang G. FEBS J. 2012;279:3898. doi: 10.1111/j.1742-4658.2012.08748.x. [DOI] [PubMed] [Google Scholar]
- Neri D., Supuran C. T. Nat. Rev. Drug Discovery. 2011;10:767. doi: 10.1038/nrd3554. [DOI] [PubMed] [Google Scholar]
- (a) Wang Z. Y., Loo T. Y., Shen J. G., Wang N., Wang D. M., Yang D. P., Mo S. L., Guan X. Y., Chen J. P. Breast Cancer Res. Treat. 2012;131:791. doi: 10.1007/s10549-011-1466-6. [DOI] [PubMed] [Google Scholar]; (b) Le A., Cooper C. R., Gouw A. M., Dinavahi R., Maitra A., Deck L. M., Royer R. E., Vander J. D. L., Semenza G. L., Dang C. V. Proc. Natl. Acad. Sci. U. S. A. 2010;107:2037. doi: 10.1073/pnas.0914433107. [DOI] [PMC free article] [PubMed] [Google Scholar]
- (a) Novoa W. B., Winer A. D., Glaid A. J., Schwert G. W. J. Biol. Chem. 1959;234:1143. [PubMed] [Google Scholar]; (b) Busch H., Nair P. V. J. Biol. Chem. 1957;229:377. [PubMed] [Google Scholar]; (c) Choi S. R., Beeler A. B., Pradhan A., Watkins E. B., Rimoldi J. M., Tekwani B., Avery M. A. J. Comb. Chem. 2007;9:292. doi: 10.1021/cc060110n. [DOI] [PubMed] [Google Scholar]
- Shelley M. D., Hartley L., Fish R. G., Groundwater P., Morgan J. J. G., Mort D., Mason M., Evans A. Cancer Lett. 1999;135:171. doi: 10.1016/s0304-3835(98)00302-4. [DOI] [PubMed] [Google Scholar]
- (a) Tuszynski G. P., Cossu G. Cancer Res. 1984;44:768. [PubMed] [Google Scholar]; (b) Jaroszewski J. W., Kaplan O., Cohen J. S. Cancer Res. 1990;50:6936. [PubMed] [Google Scholar]
- Ward R. A., Brassington C., Breeze A. L., Caputo A., Critchlow S., Davies G., Goodwin L., Hassall G., Greenwood R., Holdgate G. A., Mrosek M., Norman R. A., Pearson S., Tart J., Tucker J. A., Vogtherr M., Whittaker D., Wingfield J., Winter J., Hudson K. J. Med. Chem. 2012;55:3285. doi: 10.1021/jm201734r. [DOI] [PubMed] [Google Scholar]
- Granchi C., Roy S., Giacomelli C., Macchia M., Tuccinardi T., Martinelli A., Lanza M., Betti L., Giannaccini G., Lucacchini A., Funel N., León L. G., Giovannetti E., Peters G. J., Palchaudhuri R., Calvaresi E. C., Hergenrother P. J., Minutolo F. J. Med. Chem. 2011;54:1599. doi: 10.1021/jm101007q. [DOI] [PubMed] [Google Scholar]
- Dragovich P. S., Fauber B. P., Boggs J., Chen J. H., Corson L. B., Ding C. Z., Eigenbrot C., Ge H. X., Giannetti A. M., Hunsaker T., Labadie S., Li C., Liu Y., Ma S., Malek S., Peterson D., Pitts K. E., Purkey H. E., Robarge K., Salphati L., Sideris S., Ultsch M., VanderPorten E., Wang J., Wei B. Q., Xu Q., Yen I., Yue Q., Zhang H. H., Zhang X. Y., Zhou A. H. Bioorg. Med. Chem. Lett. 2014;24:3764. doi: 10.1016/j.bmcl.2014.06.076. [DOI] [PubMed] [Google Scholar]
- (a) Purkey H. E., Robarge K., Chen J. H., Chen Z. G., Corson L. B., Ding C. Z., DiPasquale A. G., Dragovich P. S., Eigenbrot C., Evangelista M., Fauber B. P., Gao Z. T., Ge H. X., Hitz A., Ho Q., Labadie S. S., Lai K. W., Liu W. F., Liu Y. J., Li C., Ma S. G., Malek S., O'Brien T., Pang J., Peterson D., Salphati L., Sideris S., Ultsch M., Wei B. Q., Yen I., Yue Q., Zhang H. H., Zhou A. H. ACS Med. Chem. Lett. 2016;7:896. doi: 10.1021/acsmedchemlett.6b00190. [DOI] [PMC free article] [PubMed] [Google Scholar]; (b) Boudreau A., EPurkey H., Hitz A., Robarge K., Peterson D., Labadie S., Kwong M., Hong R., Gao M., Nagro C. D., Pusapati R., Ma S. G., Salphati L., Pang J., Zhou A. H., Lai T., Li Y. J., Chen Z. G., Wei B. Q., Yen I., Sideris S., McCleland M., Firestein R., Corson L., Vanderbilt A., Williams S., Daemen A., Belvin M., Eigenbrot C., Jackson P. K., Malek S., Hatzivassiliou G., Sampath D., Evangelista M., O'Brien T. Nat. Chem. Biol. 2016;12:779. doi: 10.1038/nchembio.2143. [DOI] [PubMed] [Google Scholar]
- (a) Chen C. Y., Feng Y., Chen J. Y., Deng H. Bioorg. Med. Chem. Lett. 2016;26:72. doi: 10.1016/j.bmcl.2015.11.025. [DOI] [PubMed] [Google Scholar]; (b) Cui W., Lv W., Qu Y., Ma R., Wang Y. W., Xu Y. J., Wu D., Chen X. H. Bioorg. Med. Chem.Bioorg. Med. Chem. Lett.Lett. 2016;26:3984. doi: 10.1016/j.bmcl.2016.06.083. [DOI] [PubMed] [Google Scholar]
- Xu H. Q. J. Cancer Res. Ther. 2016;12:1261. doi: 10.4103/0973-1482.158035. [DOI] [PubMed] [Google Scholar]


