Abstract
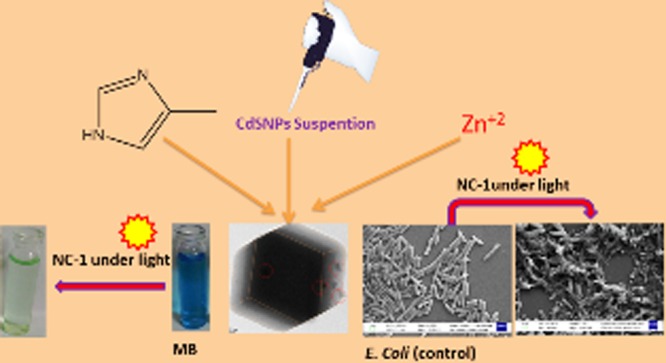
Multifunctional novel core–shell composites, CdSNPs@ZIF-8, have been synthesized by in situ encapsulation of different amounts of CdSNPs (150, 300, and 500 μL suspension of CdSNPs in methanol) in ZIF-8 at room temperature. These composites have been characterized by powder X-ray diffraction, X-ray photoelectron spectroscopy (XPS), field emission scanning electron microscopy, high-resolution transmission electron microscopy (HRTEM), and diffuse reflectance spectroscopy techniques and Brunauer–Emmett–Teller surface analysis. XPS and HRTEM indicate the encapsulation of CdSNPs within ZIF-8 crystal without disturbing the crystal order of ZIF-8. The average size of embedded CdSNPs (determined by the particle size distribution from HRTEM) is found to be 16.34 nm. CdSNPs@ZIF-8 showed potential to be used as an antibacterial agent against the broad spectrum of bacterial strains such as Gram-positive Staphylococcus aureus and Gram-negative green fluorescent protein-expressing Escherichia coli in aqueous medium, as evident by various biophysical experiments, viz., 3-(4,5-dimethylthiazol-2-yl)-2,5-diphenyltetrazolium bromide assay, optical density and fluorescence spectroscopic studies, fluorescence and optical microscopic image analysis, disk diffusion assay, field emission scanning electron microscopy, and flow cytometry for reactive oxygen species induction assay. Further, the composite has been used as an efficient photocatalyst for the degradation of organic pollutants, such as methylene blue dye, in aqueous medium and found that the core–shell composite, CdSNPs@ZIF-8 (150 μL) (abbreviated as NC-1) (5 mg), exhibited higher photocatalytic activity (≈1.8 times) than CdSNPs for degradation of 90% of methylene blue (10 mL of 10 ppm) at pH ≥ 7 due to the synergetic effect. Therefore, in situ encapsulation of CdSNPs in ZIF-8 provides an easy executable measure for purification of wastewater effluents for the effective photocatalytic degradation of organic pollutants as well as to remove the bacterial contamination under sunlight.
Introduction
Microporous metal-organic frameworks (MOFs), a class of newly developed inorganic–organic hybrid materials, which consist of metal-containing nodes connected by organic linkers, have attracted significant research interest in recent years due to their diverse and easily tailorable structures as well as many attractive applications in gas storage, catalysis, selective adsorption and separation, carbon dioxide capture, and drug delivery.1 MOFs can be synthesized under mild conditions and have tunable pore size, high pore volume, high specific surface area, and highly ordered crystalline porous networks, which allow systemic engineering of different physical and chemical properties by modification of their counterparts.1 Recently, there has been a significant research interest to explore new applications of MOFs as potential photocatalysts when exposed to light because it is easy to modify MOFs with tailorable functionality having capacity to absorb light, thereby inducing desirable photocatalytic activity for degradation of organic pollutants.2−10
In recent years, much effort has been devoted to encapsulate nanoparticles (NPs) of metals,11−14 metal oxides,15−22 metal oxide composites,23−26 organic polymers,27,28 polyoxometalates,29,30 and MOFs31,32 into MOFs to form hybrid core–shell composites/structures. These hybrid core–shell materials possess not only the intrinsic properties of the NPs and MOFs but also synergistic properties that explore their more new applications (Table 1) in various fields, such as selective photocatalysis/catalysis,12−16,18,19,29,33,34 therapy,35,36 and gas storage and sensing37,38 and as supercapacitors and carriers for electrode materials.17,21 NPs@MOFs core–shell composites have been prepared either by using MOFs as templates to generate and embed nanoparticles within their cavities39−41 or by encapsulating presynthesized nanoparticles stabilized with certain surfactants, capping agents, or even ions,11,15,19,42−44 and usually it has been observed that nanoparticles do not occupy the MOF cavities (because their hydrodynamic radius is much larger than the size of cavity of MOFs), but instead are surrounded by grown MOF particles. Despite a significant amount of research on NPs@MOFs have been reported, many challenges still remain, such as control of size, composition, dispersed nature, spatial distribution, and confinement of the incorporated nanoparticles within the matrices of MOFs. Therefore, new encapsulation strategies will be developed, but as yet are not well developed and understood. Further, to preserve the catalytic and optical properties of encapsulated nanoparticles in MOFs matrices, their agglomeration should be controlled and minimized. The agglomeration of nanoparticles is a commonly observed42−44 phenomenon during the encapsulation of NPs within MOFs.
Table 1. List of MOF-Based Core–Shell Composites.
| s. r. | material | advantage/application | disadvantage | ref |
|---|---|---|---|---|
| 1. | MIL-53 (Fe, Cr, Al) | used for photocatalytic degradation of methylene blue (MB) | carboxylate-based MOFs are unstable in aqueous medium, and release of Cr in water may cause health problem | (9) |
| 2. | Au@ZIF-8, Pt@ZIF-8, and Fe3O4@ZIF-8 | used for N2 uptake, hydrogenation, and study of magnetic properties, respectively | PVP surfactant was needed | (11) |
| 3. | single-/multi-core–shell Au@ZIF-8 | used for photocatalytic oxidation of benzyl alcohol | CTAB used in the synthesis of Au NPs, which may not be completely replaced by PVP | (12) |
| 4. | AgPd@ZIF-8 | dehydrogenation of formic acid | (14) | |
| 5. | TiO2@ZIF-8 | simple method of preparation; highly recyclable efficient catalyst for photodegradation of methylene blue | (15, 45) | |
| 6. | ZnO@ZIF-8 | used for photocatalytic degradation of methylene blue | additional oxidant, H2O2 was added to methylene blue. Size of ZnO core is large (300 nm) | (16) |
| 7. | SnO2 quantum dots@ZIF-8 | higher supercapacitance (931 F/g) compared to either SnO2 QD or ZIF-8 | its characterization and other applications were not carried out | (17) |
| 8. | Fe3O4@MOF magnetic microspheres | cheap and green catalyst for Claisen–Schmidt condensation reaction | (18) | |
| 9. | Fe3O4@MIL-100 (Fe) | magnetically separable photocatalyst for decolorization of methylene blue | H2O2 is required for higher degradation efficiency. Fe3O4@MIL-100 (Fe) and MIL-100 (Fe) have almost same efficiency | (19) |
| 10. | Keggin-type polyoxometalate (POM), [CuPW11O39]5– in the pores of MOF-199 | increased stability of both POM and MOF due to synergistic effect. Conversion of TICs (H2S, mercaptans) to non-TICs (S8, H2O, disulfides) | (29) | |
| 11. | IRMOF-3 (shell/core)-@MOF-5 (core/shell) | novel structures | no specific application was discussed | (32) |
| 12. | Zn/Co ZIF particles | semihydrogenation of acetylene | (33) | |
| 13. | hollow ZIF-8 nanospheres and Pd nanocubes@ZIF-8 | size-selective hydrogenation reactions of 1-hexene, trans-stilbene, and teteraphenyl-ethylene | (34) | |
| 14. | g-C3N4 nanosheets@ZIF-8; (DOX) loaded on ZIF-8 of g-C3N4 nanosheets@ZIF-8 | dual-color imaging, red fluorescence of doxorubicin hydrochloride (DOX), and blue fluorescence of g-C3N4 nanosheets provide the additional function for monitoring the drug release behavior | (35) | |
| 15. | Fe3O4/ZIF-8-Au25 | Fe3O4 produced hyperthermal effect and also had targeting and MRI imaging capabilities. Au25(SR18)-produced singlet oxygen (1O2), which further causes photodynamic effect. This nanoplatform exhibits high biocompatibility and an enhanced synergistic therapeutic effect superior to any single therapy | (36) | |
| 16. | Au@MOF-5 | highly selective sensing for CO2 | (37) | |
| 17. | bio-MOF-11/14 mixed core@bio-MOF-14 | selective for CO2 capture. Core–shell composite exhibits 30% higher CO2 uptake than bio-MOF-14 and less N2 uptake than core | (38) | |
| 18. | CdS@ZIF-8 | photocatalytic H2 generation from formic acid | its characterization was not thoroughly carried out and other photocatalytic and biocidal applications were not studied | (46) |
With growing concerns worldwide about a green and clean environment, water bodies, and human health, immense efforts have been made to develop new high-efficiency and cost-effective technologies for the degradation and removal of the organic pollutants of wastewater. The major pollutants in wastewater include organic dyes, phenol and its various derivatives, fertilizers, pesticides, polyaromatic hydrocarbon (PAH), detergents, carbohydrates, etc. The organic dyes are widely used as coloring agents in various industries, particularly, textiles, leather, food, plastics, cosmetics, and other industries, and they are usually toxic, carcinogenic, mutagenic, and have low biodegradability.1 Their discharge into water bodies misbalances the aquatic ecosystem. Therefore, their efficient removal prior to the discharge of wastewater has become a hot research area due to its ecological and environmental pollution points of view. Traditional common physiochemical and biological methods fail to completely destroy them, and are slow and thus can lead to secondary pollution. Therefore, other alternative technologies with more efficiency and less energy consumption have been developed, such as advanced oxidation processes based on the generation of hydroxyl radicals using photocatalysts that oxidize a broad range of organic pollutants quickly and selectively. To date, several semiconductor nanoparticles based on transition-metal oxides and sulfides (e.g., ZnO, Fe2O3, TiO2, SnO2, CdS, ZnS, GaP, etc.) due to their size (quantum size effect)-dependent optical and electronic properties have been extensively used in heterogeneous photocatalysis processes for this purpose.1 These processes have some advantages, such as ambient operating temperature and pressure, complete mineralization, and low operating cost. But semiconductor photocatalysts used are not very stable under light in aqueous medium and thus can lead to corrosion, thereby causing metal toxicity, and the typical examples are low-band-gap transition-metal sulfides.1
Among transition-metal sulfides, CdS is an excellent semiconductor material with a direct band gap of 2.42 eV with many outstanding physical and chemical properties, as well as diverse applications in multiple technical fields, including photochemical catalysis, gas sensor, detectors for laser and infrared, solar cells, nonlinear optical materials, various luminescence devices, and optoelectronic devices.47−51 However, the difficulties due to postseparation, agglomeration, and low solar energy conversion efficiency due to high recombination rate of photogenerated electron–hole pairs of CdS nanoparticles have limited the large-scale applications of CdS nanoparticles. Therefore, to overcome these problems, CdS nanoparticles are immobilized on different types of matrix, e.g., cellulose, polymers, zeolites, porous alumina, carbon materials, and microporous MOFs.52−57 However, there is a plenty of scope to explore the fabrication strategy and multiple potential applications of CdS-based photocatalysts. So far, there has been no report to describe the antibacterial and photocatalytic activities (for degradation of methylene blue) of CdSNPs@MOF hybrid structures. Herein, we report, for the first time, an encapsulation strategy that allows CdS bare nanoparticles (average size ≈ 16.34 nm) without any capping agent to be incorporated within matrices of a readily synthesized zeolitic imidazolate framework material ZIF-8 by in situ successive addition of the suspension of CdS nanoparticles in methanol during continuous formation of surfaces of the growing ZIF-8 crystals. ZIF-8 has been chosen as a host to encapsulate semiconductor CdS nanoparticles due to its known chemical robustness and thermal stability,11,15 and it has sodalite zeolite-type structure with large cavities (11.6 A°) and small apertures (3.4 A°). However, core–shell CdS@ZIF-8 structures have been very recently prepared46 by a two-step method, in which poly(vinylpyrrolidone) (PVP)-stabilized CdSNPs (average size ≈70–210 nm) were presynthesized and ZIF-8 shells were grown on the surfaces of the CdS cores, and ZIF-8 has been selectively used for photocatalytic H2 generation from formic acid. The main limitation of this report is that it does not deal with many important parameters of composite, such as optical band gap, thermal and chemical stabilities, surface area and binding energy of various constituents by X-ray photoelectron spectroscopy (XPS) studies, and other potential applications of ZIF-8 in the biological field, where none of such type of core–shell composites has been tested against microbes so far (Table 1).
The present study provides a simple and efficient route for the preparation of CdSNPs@ZIF-8 multi-core–shell nanocomposites by in situ encapsulation of different amounts of CdS nanoparticles within ZIF-8. These nanocomposites have been characterized by Fourier transform infrared (FTIR) spectroscopy, powder X-ray diffraction (PXRD), X-ray photoelectron spectroscopy (XPS), field emission scanning electron microscopy (FE-SEM), high-resolution transmission electron microscopy (HRTEM), and UV diffuse reflectance spectroscopy (DRS). For the first time, we report herein photoinduced antibacterial activity against green fluorescent protein (GFP)-expressing Escherichia coli and Staphylococcus aureus and the photocatalytic efficiency of CdSNPs@ZIF-8 against methylene blue (organic dye) at different conditions by varying parameters such as pH, initial dye concentration, and photocatalyst amount under UV–visible light irradiation.
Results and Discussion
Characterization of CdSNPs, ZIF-8, and CdSNPs@ZIF-8 Composites
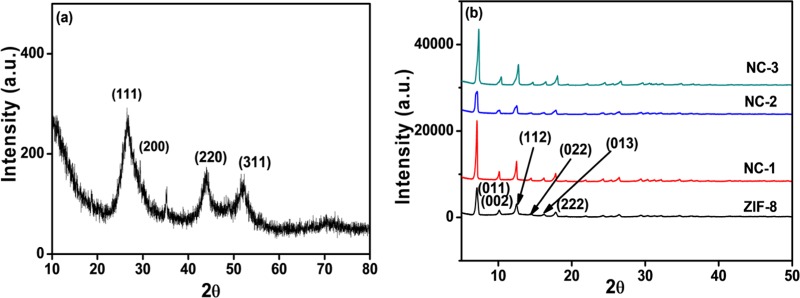
Three core–shell composites have been synthesized by in situ encapsulation of different amounts of CdSNPs (NC-1: 150 μL suspension; NC-2: 300 μL suspension; NC-3: 500 μL suspension) in ZIF-8 matrices at room temperature. All of the composites are chemically stable as well as in air, as evident in Figure S1 in the Supporting Information. These composites have been characterized by PXRD, FTIR, FE-SEM, HRTEM, and diffuse reflectance spectrophotometric techniques. Since NC-1 (prepared by using 150 μL suspension of CdSNPs) exhibited maximum photocatalytic efficiency, its XPS image was recorded and analyzed, and NC-1 was also used to study the effects of all parameters for photodegradation of methylene blue dye. The crystalline phase of the as-synthesized CdSNPs was examined by PXRD (Figure 1a). The PXRD pattern of CdSNPs having major peaks at 2θ = 26.69° (111), 44.03° (220), and 51.82° (311) was indexed with CdS cubic with space group F4̅3m (JCPDS No. 00-042-1411). The mean particle size of CdSNPs was calculated using the Scherrer equation (eq 1) to be 3.4 nm.
| 1 |
where τ is the mean particle size, λ is the X-ray wavelength, β is the full width at half-maximum intensity in radians, and θ is the Bragg angle in degrees.
Figure 1.
PXRD patterns of (a) CdSNPs and (b) ZIF-8, NC-1 (CdSNPs@ZIF-8 (150 μL)), NC-2 (CdSNPs@ZIF-8 (300 μL)), and NC-3 (CdSNPs@ZIF-8 (500 μL)).
The PXRD patterns of synthesized ZIF-8 and multi-core–shell composites prepared by in situ encapsulation of 150, 300, and 500 μL suspensions of CdSNPs are shown in Figure 1b. The peaks in the diffraction patterns of ZIF-8 and all three composites at 7.08, 10.15, 12.49, 14.48, 16.25, and 17.77° correspond to the planes (011), (022), (112), (022), (013), and (222).46 It was observed that the crystallinity of ZIF-8 remains unchanged in the composites and characteristic peaks of CdS nanoparticles are not observed in their PXRD patterns, which indicates the proper encapsulation of CdS nanoparticles within the ZIF-8 matrix. Further, the PXRD pattern of the composite prepared by 150 μL suspension of CdSNPs after its use (say five cycles) also remains unchanged, indicating its remarkable stability and reusability (Figure S1).
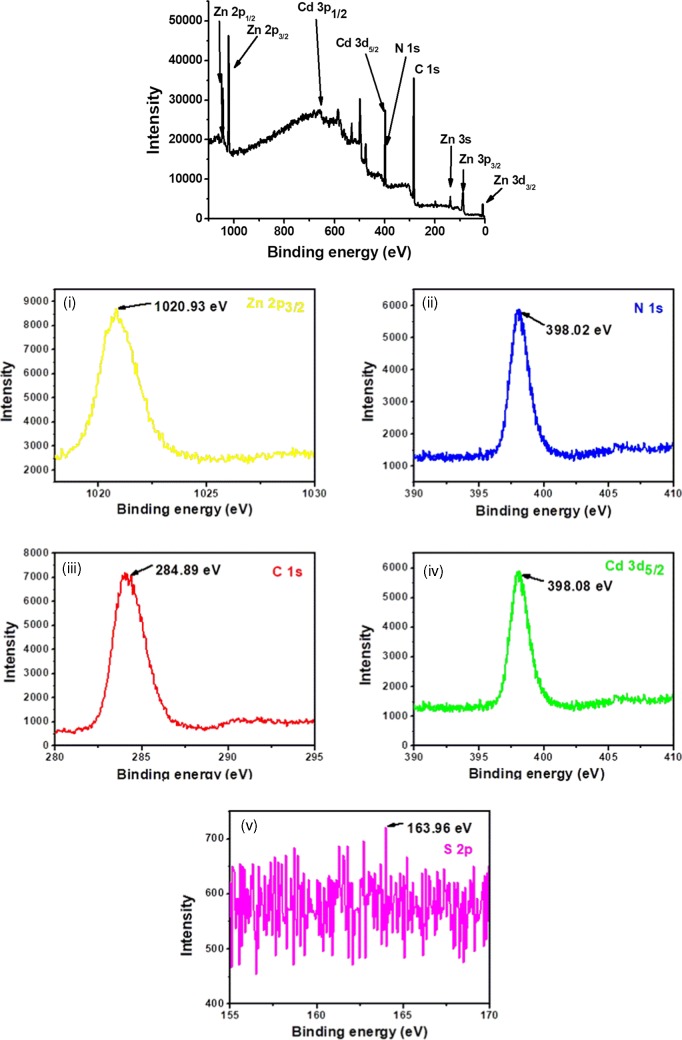
Analysis of the XPS image of CdSNPs@ZIF-8 (150 μL) (NC-1: prepared by using 150 μL suspension of CdSNPs) indicates the presence of electronic states of constituents58 (Figure 2a). The expanded XPS images of the close fitting of each metal with their orbital position, viz., Cd 3d5/2, Zn 2p3/2, C 1s, N 1s, and S 2p, are shown in Figure 2b. The XPS peaks of Zn 2p3/2 and Zn 2p1/2 are very intense and narrow, having binding energies of 1020.82 and 1043.95 eV, respectively, whereas Zn 3s, Zn 3p3/2, and Zn 3d3/2 or Zn 3d5/2 peaks are less intense and narrow, having low binding energies of 138.6, 88.08, and 9.62 eV, respectively. The XPS peaks of Cd 3d5/2 and N 1s are narrow, having very close binding energies of 398.08 and 398.02 eV, respectively. But Cd 3p1/2 with binding energy of 652.0 eV is broad and very less intense. The C 1s and S 2p1/2 XPS peaks correspond to binding energies of 284.89 and 163.96 eV (with respect to metal sulfide).58
Figure 2.
(a) XPS image of CdSNPs@ZIF-8 (150 μL) (NC-1). (b) Expanded XPS images corresponding to Zn 2p3/2 (i), N 1s (ii), C 1s (iii), Cd 3d5/2 (iv), and S 2p1/2 (v) of NC-1.
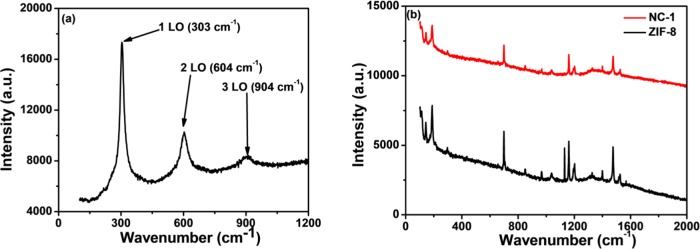
Almost similar stretching frequency characteristics of the imidazole ring are observed in the FTIR spectra of ZIF-8 and CdSNPs@ZIF-8 composites (Figure S2).59,45 The FTIR spectrum of CdSNPs shows stretching bands at 600–750, 750–1000, 1430, and 1620 cm–1 corresponding to C–C, C–O, C–H (O–H bending), and CO2. The hydrogen-bonded stretching at 3200–3600 cm–1 is due to intermolecular hydrogen bonds of water due to moisture. The Cd–S stretching vibration should be found at 410 cm–1 but could not be observed here. The encapsulation of CdSNPs within ZIF-8 did not shift any of the ZIF-8 peaks in notable extent from its position. In the Raman spectrum of CdSNPs (Figure 3a), peaks with decreasing order of intensity at 303, 604, and 904 cm–1 are observed due to the first-, second-, and third-order longitudinal optical phonon vibrational modes, respectively. But these are not observed in NC-1 due to the very small amount of encapsulated CdSNPs within ZIF-8, which may affect the phonon spectra due to confinement of both optical phonons and acoustic phonons.60 The probable coupling of phonon vibrational modes of CdS with those of ZIF-8 may be assumed to be another important reason of its nonexistence in the spectrum.
Figure 3.
Raman spectra of (a) CdSNPs and (b) ZIF-8 and NC-1.
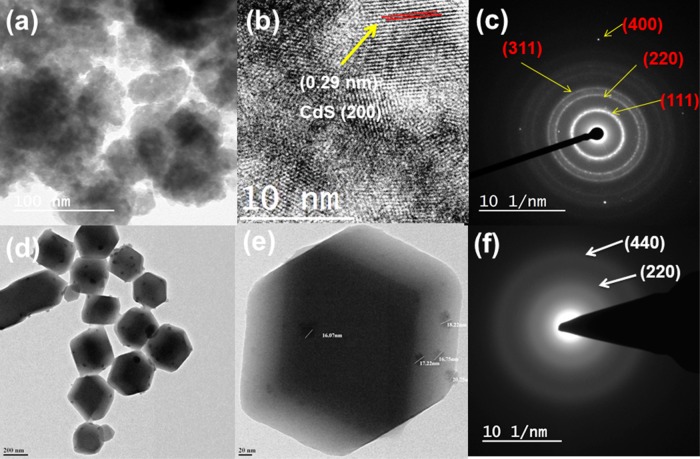
The morphological investigations of CdSNPs, ZIF-8, and NC-1 were carried out by FE-SEM (Figure S3) and HRTEM (Figure 4). Smooth and round-shaped agglomerated nanoparticles of CdS can be seen from its FE-SEM and TEM images (Figures S3a and 4a). The average particle size of CdS calculated using ImageJ software from HRTEM images was 7.2 ± 1.59 nm (particle size distribution plot is shown in Figure S4a). The crystals of ZIF-8 and NC-1 have hexagonal morphology. It is observed that the morphology of ZIF-8 crystal is not affected by the encapsulation of CdS nanoparticles and also that there is no CdS nanoparticle on the surface of ZIF-8, which suggests the proper encapsulation of CdSNPs within the ZIF-8 matrix. Further, encapsulated CdSNPs are clearly evidenced as dark spots within the ZIF-8 crystal in HRTEM images. Selected area electron diffraction (SAED) pattern of NC-1 (Figure 4f) indicates polycrystalline rings, which correspond to the planes of CdSNPs (Figure 4c) and further support the encapsulation of CdSNPs within the ZIF-8 matrix/crystal. Elemental mapping of NC-1 (Figure S5) shows the concentration and distribution of elements indicating multicores of CdS into ZIF-8. The average particle size of encapsulated core CdS nanoparticles into the ZIF-8 matrix calculated using ImageJ software from HRTEM images was 16.34 nm (plot is shown in Figure S4b). FE-SEM (Figure S6a) and HRTEM (Figure S6b) images of NC-1 after its use in photocatalytic reaction remain unchanged, which further indicates its remarkable stability and reusability.
Figure 4.
(a) TEM image, (b) HRTEM image, and (c) SAED pattern of CdSNPs. (d, e) TEM images of NC-1 at different magnifications and (f) SAED pattern of NC-1.
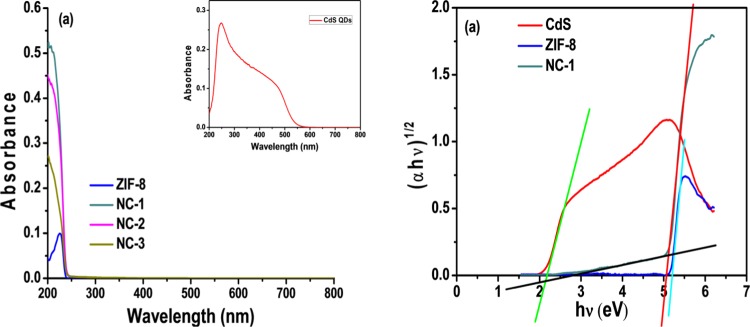
The energy band gap plays a key role in determining the optical properties of materials, which was determined by the UV-DRS spectra of CdSNPs, ZIF-8, NC-1, NC-2, and NC-3 (Figure 5a). The indirect band gap values of CdSNPs, ZIF-8 and NC-1 were determined by the Tauc method (Figure 5b) to be 2.20 and 5.24 eV for CdSNPs and ZIF-8, respectively. Further, the Tauc plot of NC-1 showed two band gaps, one at 2.95 eV due to encapsulated CdSNPs in ZIF-8 and the other at 5.10 eV of shell material (ZIF-8). Furthermore, in the case of NC-1, the absorption of light was also increased in the visible range. Reflectance spectra of CdSNPs, ZIF-8, NC-1, NC-2, and NC-3 are also shown in Figure S7.
Figure 5.
(a) UV–visible DRS spectra of CdSNPs (inset), ZIF-8, NC-1, NC-2, and NC-3. (b) Typical Tauc plots of CdSNPs, ZIF-8, and NC-1 (CdS@ZIF-8 (150 μL)) by indirect method.
Thermal stabilities of ZIF-8 and NC-1 are compared by thermogravimetric analysis (Figure S8a,b). Both compounds were found to be highly stable in nitrogen up to 450 °C and decompose to give a plateau at 700–800 °C (wt % remained at 35.10–34.96 and 36.30–35.62%, respectively). The slightly higher wt % in NC-1 is due to encapsulated CdSNPs. On the other hand, both were found to be comparatively less stable under air, and decomposition started at 350 °C (wt % remained at 96.92 and 95.82%, respectively). Further, NC-1 decomposed slightly faster than ZIF-8 and both reached a plateau at 635 °C (wt % remained at 35.87 and 35.22%, respectively) (Figure S8b). The faster decomposition of composite may be due to CdS cores, which may oxidize to CdO at lower temperature than the breakdown temperature of ZIF-8.
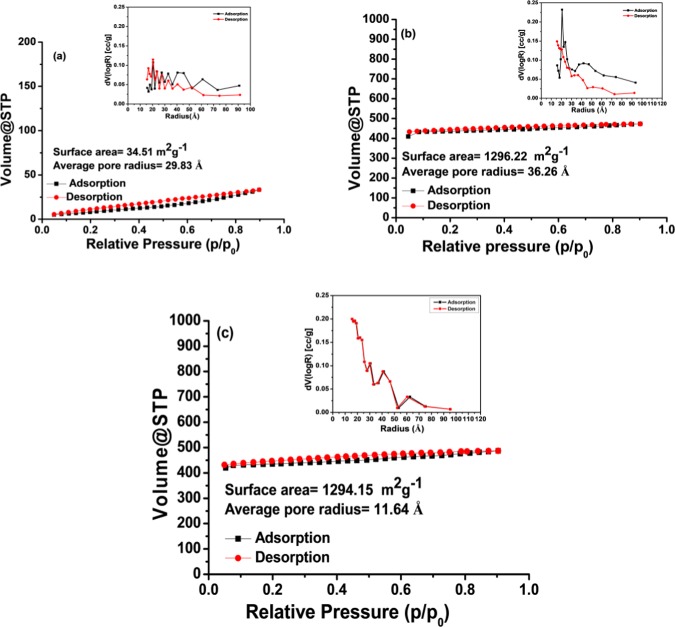
Surface analysis was performed by Brunauer–Emmett–Teller (BET) N2 adsorption–desorption studies (Figure 6). It is observed that as-synthesized CdSNPs have surface area of 34.51 m2/g, pore volume of 0.005 cm3/g, and average pore size of 29.83 Å. Further, it is evident that both ZIF-8 and NC-1 have an almost same surface area, which suggests that CdS nanoparticles are not actually inside the pores of the ZIF-8 framework but ZIF-8 shell is grown over the CdSNPs core. There is a large decrease in the pore size of NC-1 (11.62 Å) compared to ZIF-8 (36.27 Å), but a slight increase in pore volume in NC-1 is observed (Table S1 in the Supporting Information).
Figure 6.
BET surface area and average pore size distribution of (a) CdSNPs, (b) ZIF-8, and (c) NC-1.
Photodegradation Studies of Methylene Blue
Effect of CdSNPs Encapsulation
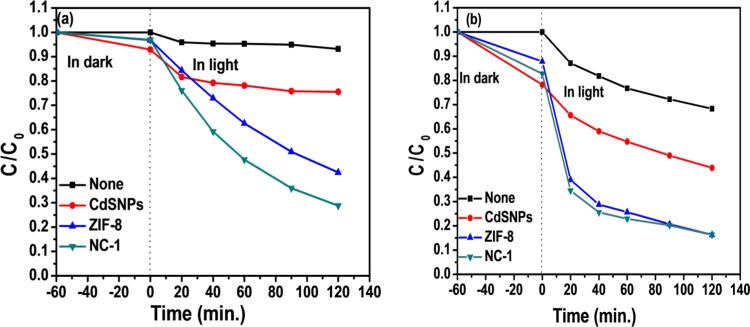
The photocatalytic performance of the catalysts, including CdSNPs, ZIF-8, and all three composites, i.e., NC-1, NC-2, and NC-3, for degradation of methylene blue (MB) (10 ppm) at pH 6.85, has been investigated spectrophotometrically, and the results (% adsorption for time length: 60 min and % photodegradation after 120 min and total dye removal) are given in Table S2, and the plot of (C/C0) versus time is shown in Figure 7. There is no major difference in % photodegradation of MB using three different composites, which indicates that the amount of encapsulated CdSNPs in the ZIF-8 matrix has not a significant effect on its photodegradation efficiency. There is ca. 2–3% decrease with an increase in the encapsulated amount of CdSNPs, which may be attributed to a small degree of agglomeration of CdSNPs. At higher CdS concentration, deactivation of CdSNPs may also occur through collision to some extent, which may also decrease degradation rate (CdS* + CdS → CdS# + CdS, where CdS* and CdS# are activated and deactivated species, respectively).45 Further, % adsorption remains almost unchanged with an increase in the amount of encapsulated CdSNPs within ZIF-8. Detailed studies by varying the amount of photocatalysts, pH, and the initial concentration of MB were carried out using the composite prepared by adding 150 μL suspension of CdSNPs (NC-1), which are discussed in the following subsections.
Figure 7.
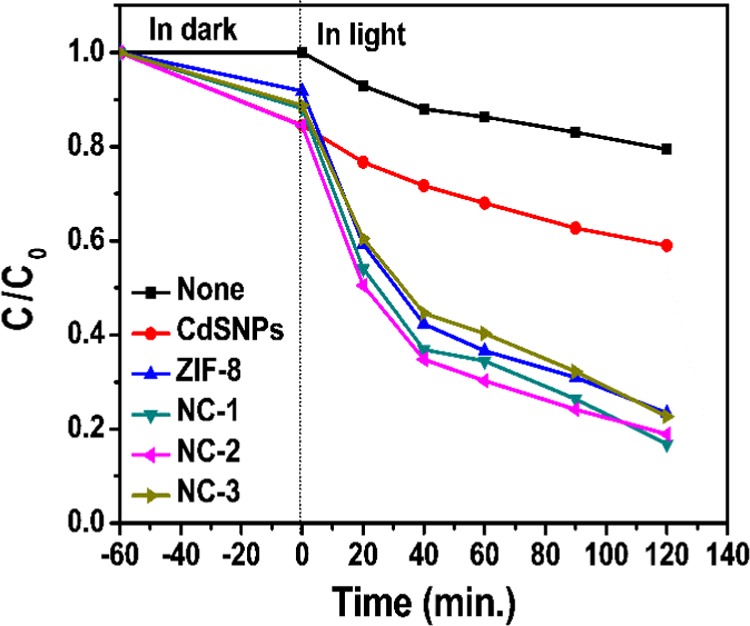
Photocatalytic performance of all catalysts, i.e., CdSNPs, ZIF-8, NC-1, NC-2, and NC-3; [MB] = 10 ppm; pH, 6.85; photocatalyst amount, 10 mg.
Effect of Initial pH
To study the effect of variation of pH, the photocatalytic degradation experiment was carried out at pHs 3.0, 6.85 (already reported in the previous section), and 11.0 (Figure 8), and the results are reported in Table S3. The initial pH of the dye is an important factor that influences its adsorption and photodegradation reactions due to change in the surface charge properties of the photocatalyst, size of aggregates formed, and also the ions formed, which are responsible for photodegradation.45 It can be clearly seen that as the initial pH of dye solution increases, both adsorption and total % of dye removal increase. It is well established that hydroxyl radical (•OH) is the major reactive species in oxidative degradation of MB.2 Therefore, at higher pH (say 11.0), the increased OH– concentration is the possible reason for higher degradation efficiency of all of the catalysts studied. Further, there is a marginal difference in the total % of dye removal at pH 11 using ZIF-8 and NC-1, but at pH 6.85, NC-1 (83.2%) is a better photocatalyst than ZIF-8 (76.6%), whereas no change is observed using NC-1 at pHs 6.85 and 11.0.
Figure 8.
Effect of pH for adsorption and photodegradation of [MB] = 10 ppm: (a) at pH 3.0 and (b) at pH 11.0.
Effect of Catalyst Amount
The influence of catalyst dosage on the degradation of methylene blue at pH 11.0 is shown in Figure 9, and the results are depicted in Table S4. The total % degradation of MB is almost same for 5 mg (83%) and 10 mg (84%) of the catalyst and then it decreases to 78% for 15 mg of the catalyst. This decrease may occur due to the interaction between the particles (agglomeration and sedimentation), which can form clusters of catalyst particles, thus reducing the overall surface area and number of active sites for catalytic performance. This study concludes that 5 mg of photocatalyst (NC-1) is optimum for degradation of 10 mL of MB (10 ppm) at pH 11.0.
Figure 9.
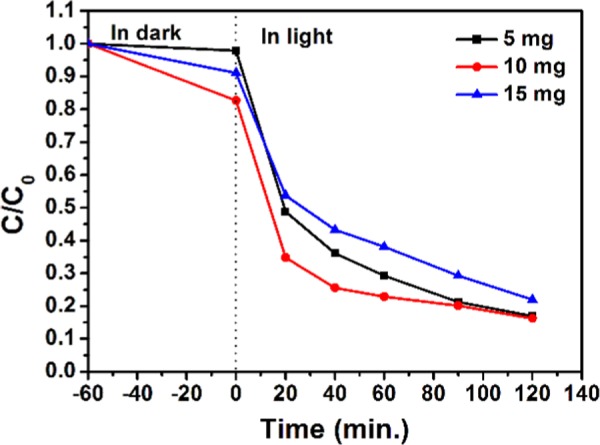
Effect of catalyst (NC-1) amount on photodegradation of [MB] = 10 ppm at pH 11.0.
Effect of Initial Concentration of MB
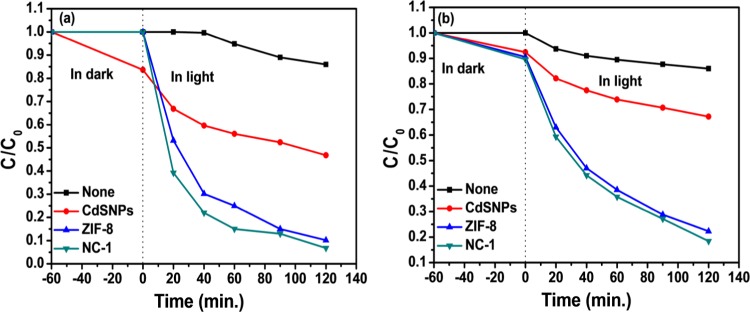
The initial dye concentration is another important parameter in the degradation study of MB. The corresponding results are presented in Table S5 and Figure 10. It was observed that the color disappeared and photocatalytic degradation was 93.2% for the initial concentration of MB = 5 ppm by using NC-1, and the % dye degradation decreased as the initial dye concentration increased to 10 and 15 ppm. This can be attributed to the fact that at higher concentration, the dye molecules are adsorbed on the surface of the catalyst, which hinders the direct interaction of light with photocatalyst to generate comparatively less reactive oxygen species (ROS) and hence decreases the efficiency of the photocatalyst. UV–visible spectra for various experiments are shown in Figures S9.1–S9.6.
Figure 10.
Effect of initial concentration of MB: (a) [MB] = 5 ppm and (b) [MB] = 15 ppm; catalyst amount = 5 mg.
Mechanism of Photodegradation of MB
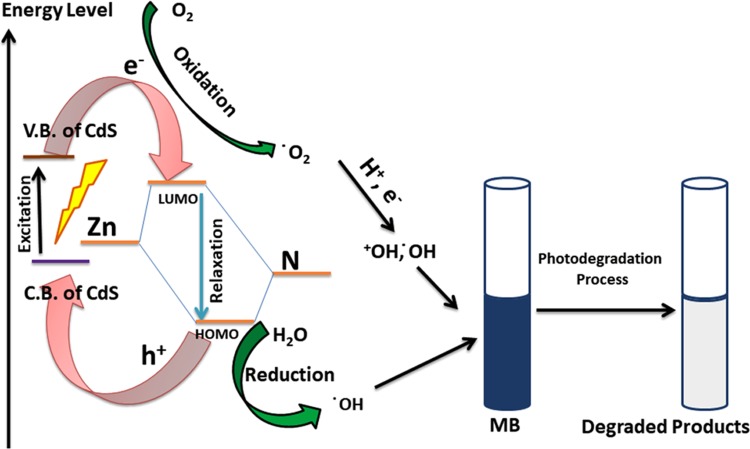
The mechanism of photocatalysis of multi-core–shell composite NC-1 comprises the synergetic effect of CdSNPs core and microporous ZIF-8 shell. Upon the absorption of visible light, e– and h+ pairs are generated in the conduction band (CB) and valance band (VB) of CdSNPs, which can either recombine or undergo interfacial electron-transfer processes. CdSNPs are good visible-light absorbents, but rapid recombination of e– and h+ is a problem, which is solved here by encapsulating them within the ZIF-8 matrix, which acts as a co-catalyst. The e– can transfer to the surface of the ZIF-8 shell, thus reducing the recombination rate. Further, the e– and h+ combine with O2 and OH–, respectively, giving rise to reactive oxygen species (ROS), such as •OH, •O2–, and H2O2, for degradation of MB. Photoluminescence (PL) spectra of ZIF-8, NC-1, NC-2, and NC-3 were obtained with an excitation wavelength of 240 nm. All of the compounds show broad emission spectra (456–506 nm) with maximum intensity around 482 nm (Figure 11). It is a well-established fact that PL intensity is a gauge of electron–hole recombination rate. A high PL intensity indicates higher recombination rate, causing electron–hole separation for less time, and a lower intensity suggests low recombination rate, i.e., higher electron–hole separation time, which is a major factor for photocatalytic reactions. As it can be seen from Figure 11, NC-2 has the highest PL intensity, suggesting higher electron–hole recombination rate and the corresponding values of ZIF-8 and NC-3 are comparable and quite higher than that of NC-1, which shows the lowest PL intensity, indicating longer electron–hole separation time, which provides evidence for its higher photocatalytic efficiency.
Figure 11.
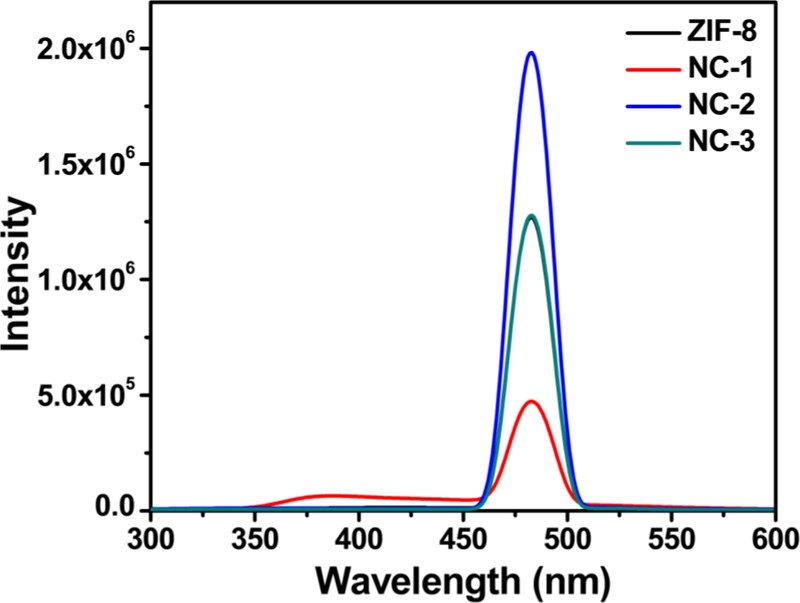
Photoluminescence spectra of ZIF-8, NC-1, NC-2, and NC-3 at room temperature (excitation wavelength, 240 nm).
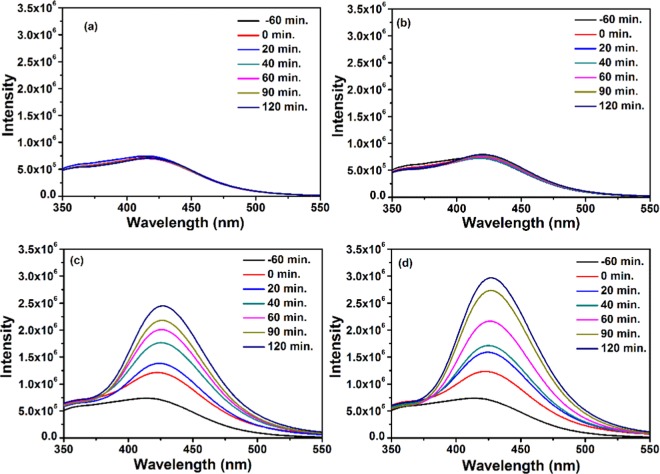
At pH ≥ 7, the active species responsible for degradation of MB are the hydroxyl radicals (•OH), which mainly influence the efficiency of photocatalysts and can be determined by fluorescence intensity measurements of terephthalic acid (0.5 mM) excited at 315 nm. The fluorescence spectral changes have been recorded in the presence and absence of photocatalysts under visible light (Figure 12). It has been observed that ZIF-8 and NC-1 favor the formation of •OH because there is a sharp increase in the fluorescence intensity with time, whereas there is almost negligible change when CdSNPs are used. It can clearly be seen that NC-1 produced •OH more effectively, suggesting its greater photocatalytic efficiency compared to ZIF-8. The probable photodegradation mechanism of MB is shown in Figure 13.
Figure 12.
Fluorescence spectral changes of terephthalic acid (0.5 mM; NaOH 2 mM) (a) without catalyst; (b) in the presence of CdSNPs; (c) in the presence of ZIF-8; and (d) in the presence of NC-1 (excitation at 315 nm, under visible light).
Figure 13.
Mechanism of photocatalytic activity of CdSNPs@ZIF-8 composite for degradation of MB.
A scavenger study was performed to investigate the role of active oxygen species, which further leads to evaluation of possible degradation pathway of MB. p-Benzoquinone (BQ, 2 mL of 2 mM solution), ethylenediaminetetraacetate (EDTA) (33 mg), and t-BuOH (500 μL) were added to the photocatalytic system at pH 7 for trapping the active species •O2–, h+, and •OH, respectively (Figure S10). The photodegradation of MB significantly decreased in case of EDTA and t-BuOH, whereas the addition of p-benzoquinone had apparently no effect, suggesting that •O2– radical is readily reduced by H+ and e– to •OH free radicals. This experiment concluded that h+ and •OH free radicals played major role in photocatalysis.61
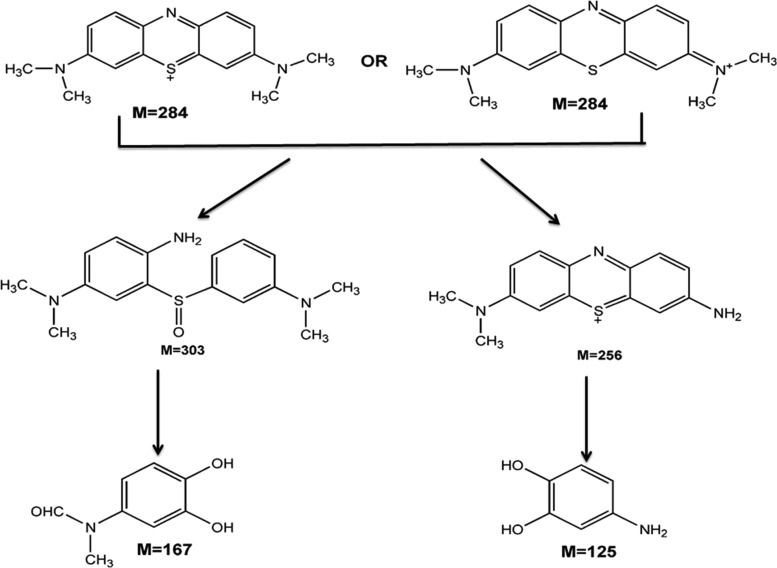
After the photodegradation experiment, the byproducts and their potential fragments were separated and analyzed by gas chromatography (GC)–mass spectrometry (MS). The molecular ion peaks of degraded intermediates are very small, indicating that their very small fraction remained (after an irradiation period of 120 min) as they further degraded into simpler molecules. Four major intermediates (Table S6 and Figures S11.1–S11.4) were detected and analyzed, and the possible degradation pathway of MB using NC-1 is depicted in Scheme 1. MB remained in ionized form in solution, and in the next step, breaking of N–CH3 bonds occurs owing to its low dissociation energy, and the methyl group is oxidized to HCHO and HCOOH. Further, C–S and C–N bonds are dissociated during the action of reactive oxygen species (O3, •OH, •O2).62 However, the complete mineralization of organic dye into inorganic ions (CO2, NO3–, SO42–, and NH4+ as ultimate end products) could take place after a long period of irradiation as reported (say 1000 min).
Scheme 1. Proposed Photocatalytic Degradation Pathway of MB Using NC-1.
Antibacterial Studies
Optical Density (OD) Study
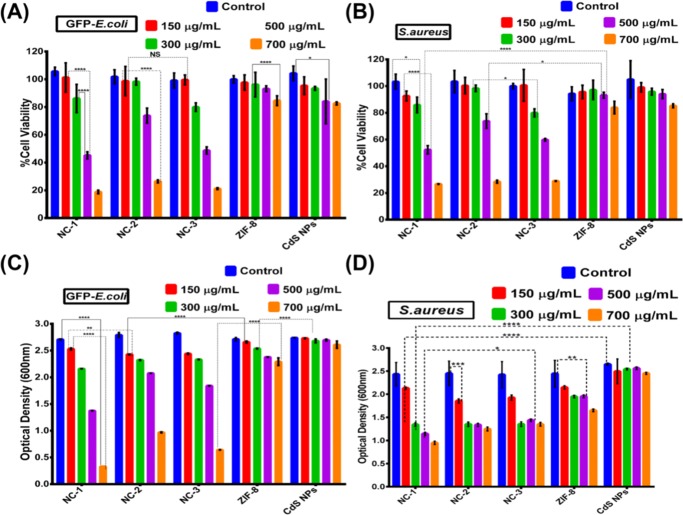
The growth rate and cell division upon the incubation of NC-1, NC-2, NC-3, ZIF-8, and CdSNPs were readily revealed by optical density measurement at 600 nm for both Gram-negative (GFP-expressing ampicillin resistant GFP) E. coli and Gram-positive S. aureus. Decreased viability was found in the NC-1 formulation-treated GFP E. coli cells compared to its contender. The lowest concentration (150 μg/mL) of NC-1 showed 2.53 optical density (OD), whereas its highest concentration of 700 μg/mL gave OD 0.3298 (Figure 14C) upon its cellular uptake. The results indicate that the photocatalytic activity of the NC-1 resulted in its bactericidal activity. The mechanistic antibacterial potency of NC-1 may be due to the light-excited CdSNPs, which eventually generate electrons and holes in the conduction band (CB) and valence band (VB), respectively,63 and these activated holes and electrons react with intracellular water molecules generating reactive oxygen species (ROS). This overproduced intracellular ROS can detrimentally affect the cellular metabolism and growth by increasing the oxidative stress, thereby affecting the normal physiological functions of the cells. With 700 μg/mL treatment of NC-2 and NC-3, we found the decrement in the OD up to 0.9696 and 0.6414, respectively. This clearly indicates that CdSNPs addition above 150 μL within the ZIF-8 matrix does not increase the efficiency. This might be due to the saturation of MOF against CdS addition or the aggregation of CdSNPs to bigger ones, thereby reducing effective surface area, and probably the molecular sieves were well occupied upon 150 μL addition. Furthermore, the resulting core–shell formulation reduces the dose of the CdS in the antibacterial application. The optical density after incubation of the core–shell composite resulted in less viability of Gram-negative GFP E. coli compared to Gram-positive S. aureus (Figure 14D). To determine that the cytotoxicity of the core–shell composite is due to the light-illuminated CdS photocatalysis, we performed a parallel set of both bacterial strains with the same concentration of all composites and limited the light illumination by providing a dark environment. This yields insignificant cytotoxicity and even higher concentration of composites, which showed the same viability as untreated control (data not shown).
Figure 14.
3-(4,5-Dimethylthiazol-2-yl)-2,5-diphenyltetrazolium bromide (MTT)-based cytotoxicity assessment of (A) GFP E. coli and (B) S. aureus. Optical density measurement of (C) GFP E. coli and (D) S. aureus against different concentrations of NC-1, NC-2, NC-3, ZIF-8, and CdSNPs cells treated for 10 h. Tukey’s multiple comparisons were used to analyze the statistical significance between the groups (*p < 0.05, **p < 0.005, ***p < 0.001; NS, nonsignificant). The values are represented as mean ± standard error of the mean (S.E.M.) (n = 3).
MTT Assay
To critically evaluate the cytotoxicity of composites quantitatively, MTT-based cytotoxic examination of both GFP E. coli and S. aureus was carried out. The actively respiring cells after the treatment provide viable results for the assay. As a result of optical density measurements, significant cytotoxicity of the GFP E. coli was fairly found with NC-1. The IC50 values of NC-1, NC-2, and NC-3 were obtained as 450, 600, and 550 μg/mL, respectively (Figure 14A). The light-induced bactericidal properties of all three composites were quantitatively determined by this assay, which indicates that NC-1 exhibits the best efficacy compared to the other two. Furthermore, the MOF carrier (ZIF-8) shows insignificant toxicity in the GFP E. coli because around 88% of the cells were viable after higher-concentration (700 μg/mL) treatment. The high biocompatibility of the MOF carrier (ZIF-8) suggests that good characteristic carrier features are found in ZIF-8 for delivering CdSNPs intracellularly. On the other hand, the CdS nanoparticles alone cannot induce any mechanistic photodynamic bactericidal activity with an 85% viability of the GFP E. coli in 700 μg/mL treatment. This is due to the poor aqueous solubility of CdS nanoparticles (Figure S12 as reference) and hence reduces its bare uses in the bacterial system directly. The encapsulation of CdS nanoparticles within the ZIF-8 matrix increases the efficacy of the antibacterial approach. The cytotoxicity was found to be higher in Gram-negative GFP E. coli compared to Gram-positive S. aureus (Figure 14B). This might be due to the Gram-negative bacteria holding a thin peptidoglycan layer (7–8 nm thickness), whereas Gram-positive bacteria composed of a thick peptidoglycan layer (20–80 nm)64 allow considerably better cellular uptake of the nanoparticles into Gram-negative cells.
Fluorescence Spectroscopic Analysis
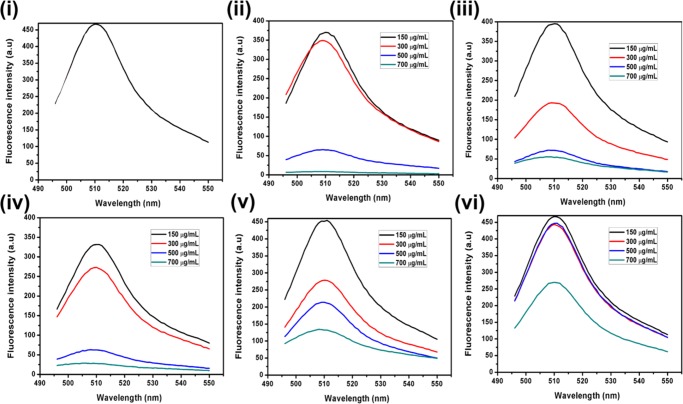
Since the better antibacterial activity of the composites was found in the GFP E. coli system, we further evaluated the GFP expression by fluorescence spectroscopic studies. With the incubation of NC-1, NC-2, and NC-3, a concentration-dependent decrement in the fluorescence intensity of the GFP fluorescence clearly indicates the direct effect of the photocatalysis of CdSNPs on cellular metabolism and division (Figure 15ii–iv, respectively) compared to untreated control (Figure 15i). Among all of the composites, NC-1 possesses better activity by reduced GFP fluorescence. In the limelight of the previous report,65 green fluorescent protein (GFP) expression will be directly proportional to the number of healthy and viable cells,66 and the assay further confirms the photocatalytic activity of the composites. Again, the carrier and bare CdSNPs do not significantly influence reduction in the toxicity (Figure 15v,vi, respectively).
Figure 15.
Fluorescence intensity estimation of GFP in GFP E. coli cells after 10 h incubation of (i) untreated control; (ii–iv) NC-1, NC-2, and NC-3, respectively; (v) ZIF-8; and (vi) CdSNPs with varying concentration.
Fluorescence and Optical Microscopic Imaging
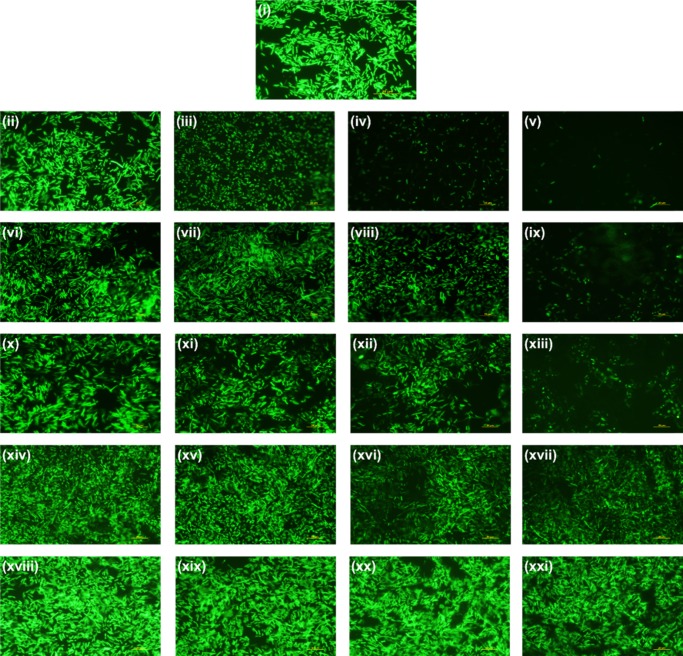
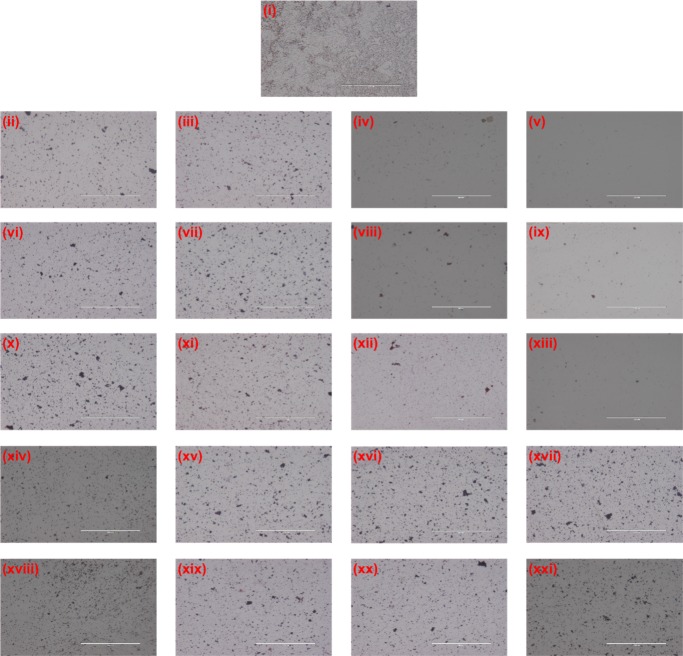
Since the cytotoxic activity of light-illuminated core–shell composites was quantitatively depicted by optical density and MTT assay, the qualitative antibacterial efficacy of the same on the GFP E. coli was measured by fluorescence microscopy of GFP. On the counterpart, a Gram-stained optical microscopic study was conducted on pretreated S. aureus (Figure S13). In the course of treatment, considerable growth inhibition was microscopically evaluated by GFP fluorescence and reduction in the number of cells. Figure 16 shows the untreated control with bright green fluorescence of GFP, which gets reduced in a concentration-dependent manner with NC-1, NC-2, and NC-3 incubation. But, ZIF-8 and bare CdSNPs showed less or insignificant reduction in the GFP fluorescence and cell number. According to our previous reports,67,68 reduction in GFP fluorescence and cell number indicates the cytotoxicity upon treatment of the composites. In the Gram-staining of S. aureus, similar results during intersample comparison (Figure 17) were obtained, which further confirmed that cytotoxicity occurs in both Gram-positive and Gram-negative bacteria, which indicates the broad spectrum of antibacterial activity of the composites.
Figure 16.
Fluorescence micrographs of GFP E. coli after 10 h treatment of (i) untreated control; (ii–v) NC-1; (vi–ix) NC-2; (x–xiii) NC-3; (xiv–xvii) ZIF-8; and (xviii–xxi) CdSNPs with different concentrations of 150, 300, 500, and 700 mg/mL. The scale bar is 20 μm.
Figure 17.
Gram-stained S. aureus cells after 10 h treatment of (i) untreated control; (ii–v) NC-1; (vi–ix) NC-2; (x–xiii) NC-3; (xiv–xvii) ZIF-8; and (xviii–xxi) CdSNPs with different concentrations of 150, 300, 500, and 700 mg/mL. The scale bar is 200 μm.
Disk Diffusion Assay
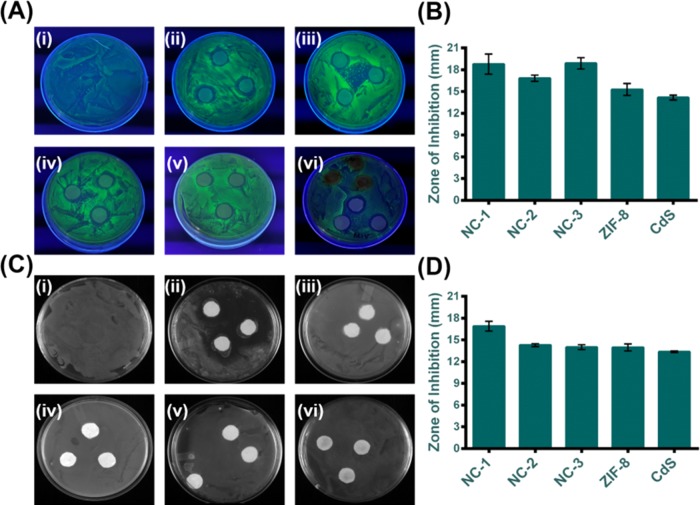
For the qualitative determination of the antibacterial activity of the as-prepared composites against the actively growing lawn of Gram-negative GFP E. coli and Gram-positive S. aureus bacteria, disk diffusion assay was followed. Figure 18A shows that the GFP expression under the UV illumination was found to be inhibited around the zone where the composite diffuses circularly. NC-1 and NC-3 showed zones of inhibition of 18.8 and 18.9 mm, respectively (Figure 18B), which correspondingly reestablish the initial data of MTT and OD analysis. Lower zones of inhibition were found for CdSNPs and ZIF-8. However, with S. aureus, we found lesser activity as expected. Figure 18C shows the zones of inhibition upon the treatment of NC-1, NC-2, and NC-3 along with bare CdSNPs and carrier ZIF-8 on S. aureus. Figure 18D reveals that the disk diffusion results of S. aureus are the same as those of GFP E. coli bacteria. While comparing the activities of GFP E. coli and S. aureus, GFP E. coli showed maximum activity on NC-1. The more zone of inhibition was considered as a better antibacterial strategic inference.69
Figure 18.
(A) UV-illuminated GFP E. coli cells and (C) digital photograph of S. aureus cells in agar plate after 10 h incubation of (i) untreated control; (ii–iv) NC-1, NC-2, and NC-3, respectively; (v) ZIF-8; and (vi) CdSNPs and their respective zone of inhibition diameters of (B) GFP E. coli and (D) S. aureus cells. The values are represented as mean ± S.E.M. (n = 3).
Field Emission Scanning Electron Microscopy (FE-SEM) Analysis
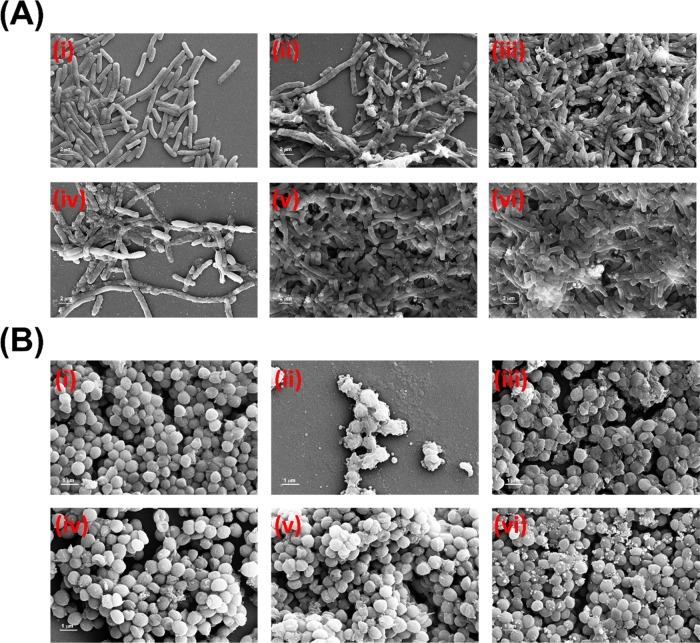
The damage of bacterial cell membrane after the progression of all of the samples was micrographed by FE-SEM to extend the proof for material-induced bacterial killing. This assay enables us to understand the cellular uptake and the interactions of composite particles with GFP E. coli and S. aureus cells. Figure 19A indicates that after the exposure of all three composites, ZIF-8, CdSNPs, and most of GFP E. coli cells lost their cellular integrity and achieved a burst structure, which dictates the cellular death upon treatment70 with respect to control. The irreversible destruction found on bacterial cells due to direct interaction with NC-1, NC-2, and NC-3 relates material-induced toxicity,71 whereas CdSNPs and ZIF-8 carriers showed no such characteristic changes. With S. aureus cells, less cytotoxicity compared to GFP E. coli was obtained, similar to previous results. Furthermore, elemental analysis through energy-dispersive X-ray analysis (EDAX) of FE-SEM revealed the presence of cadmium (Cd) and sulfur (S) in GFP E. coli and S. aureus cell surfaces (Figure S14).
Figure 19.
Field emission scanning electron micrograph of (A) GFP E. coli cells and (B) S. aureus cells with 10 h incubation of (i) untreated control; (ii–iv) NC-1, NC-2, and NC-3, respectively; (e) ZIF-8; and (f) CdSNPs. The scale bar is 1 μM.
Flow Cytometry for ROS Induction Assay
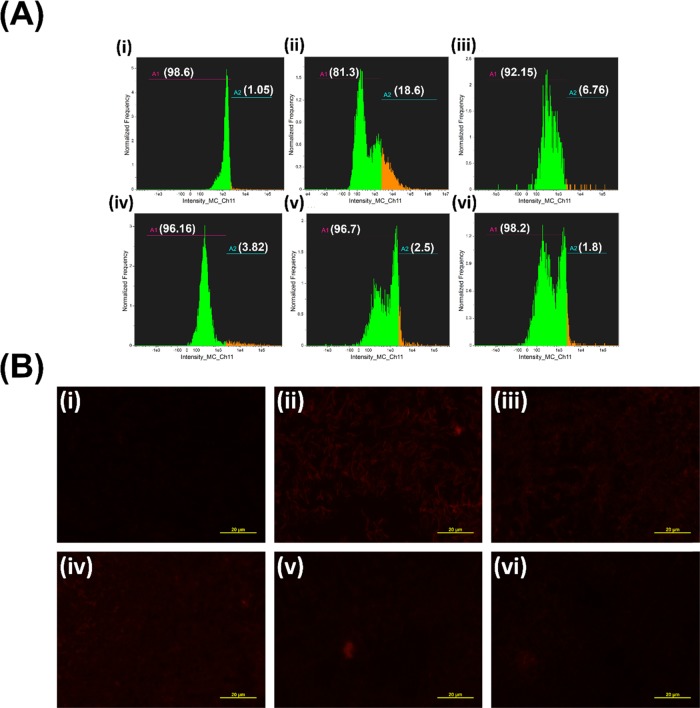
Intracellular reactive oxygen species (ROS) induction was considered as the main mechanistic cytotoxicity evaluating factor in the light-induced photocatalysis of the composites.72 Upon light excitation, the band gap of CdS resulted in the generation of holes/electrons, which further react with intracellular water and oxygen molecules to yield highly dynamic reactive oxygen species (•OH, •O2–).73 The latter induce offense to the bacterial cells by interfering with the genomic and plasmid DNA replication, protein interaction, cell membrane disintegration, and so on.74 The intracellular generation of ROS upon treatment with all three composites was determined quantitatively by CellROX Deep Red fluorescence intensity in a flow cytometer and qualitatively by fluorescent microscopy. Also, we conducted a same study on the carrier (ZIF-8) and CdSNPs alone to evaluate the ROS induction upon incubation of both. Initially, CellROX Deep Red will result in no or insignificant fluorescence in the reduced state. During the ROS generation, the CellROX Deep Red will eventually be oxidized by the ROS molecules, which result in the increased red fluorescence of the same.
So, more fluorescence can eventually confirm more ROS production.74Figure 20A-i,B-i shows the flow cytometry data and red fluorescence microscopic image, respectively, for the untreated control. Less red fluorescence undoubtedly suggests no significant ROS generation during the culture condition. Furthermore, flow cytometry data revealed only 1.05% of the ROS generated population, which can be negated due to some intracellular oxidizing agents as a noise. Figure 20A-ii suggests an increment of 17.62 times with respect to the control in the fluorescence intensity using NC-1, while Figure 20B-ii indicates the ROS generated by NC-1 with bright red fluorescence of oxidized CellROX Deep Red. Likewise, Figure 20A-iii,B-iii dictates ROS generated by NC-2, showing a 6.44 times increment, while Figure 20A-iv,B-iv shows 3.64 times increment in fluorescence intensity using NC-3. ZIF-8 displayed around 2.38 (Figure 20A-v,B-v) and finally 1.71 times escalation in the fluorescence intensity (Figure 20A-vi,B-vi) for CdSNPs alone. The results readily confirm that the ROS induction occurred by CdS photocatalysis.
Figure 20.
(A) CellROX Deep Red Fluorescence quantification by flow cytometer and (B) fluorescence microscopic images of (i) untreated control; (ii–iv) NC-1, NC-2, and NC-3, respectively; (e) ZIF-8; and (f) CdSNP-treated samples. The scale bar is 20 μm.
Conclusions
Multifunctional core–shell composites CdSPNs@ZIF-8 prepared by in situ encapsulation of different amounts of CdSNPs are thermally and chemically stable and retained the same crystal structure and morphology of ZIF-8. The composite (NC-1) prepared using 150 μL suspension of CdSNPs in methanol exhibits higher photocatalytic activity for the degradation of methylene blue under UV–visible light irradiations and can be reused successfully after five cycles. Further, NC-1, NC-2, and NC-3 showed a broad spectrum of photoinduced bactericidal activity against both GFP E. coli and S. aureus, as evident by various biophysical methods. It has been found that NC-1 exhibited the highest antibacterial activity compared to NC-2 and NC-3, and also, it is more effective in killing the GFP E. coli than S. aureus. Further, ZIF-8 and CdSNPs alone do not exhibit significant antibacterial activity, which clearly suggests that photoinduced bactericidal activity of the core–shell composite is due to the synergetic effect. These results emphasized the potential use of CdSPNs@ZIF-8 for the removal/degradation of organic pollutants and the decontamination of wastewater contaminated by Gram-positive and Gram-negative bacteria utilizing UV–visible irradiations. And it can provide a better solution to environmental problems by industries, especially water pollution.
Experimental Section
Materials
Cadmium nitrate tetrahydrate, sodium hydroxide, methanol, sodium sulfide, acetone, 2-methylimidazole, anhydrous zinc chloride, and methylene blue were purchased from Sigma-Aldrich and used without further purification. Bacterial culture media including Luria–Bertani (LB) and nutrient broth were procured from HiMedia (India). Ampicillin was obtained from SRL (India). CellROX Deep Red was obtained from Invitrogen. All other chemicals used were of analytical grade and dissolved in Milli-Q water unless otherwise stated.
Synthesis of CdS Nanoparticles
A mixture of aqueous solution of sodium hydroxide (50 mL, 0.1 M) and methanol (50 mL) was added dropwise to an aqueous solution of Cd(NO3)2·4H2O (0.085 M in 50 mL) with stirring, which was continued for 3 h. To this, an aqueous solution of sodium sulfide (0.1 M, 100 mL) was added dropwise with vigorous stirring, and the solution was stirred for additional 5 h to obtain a yellowish-green solution. It was kept overnight, and the yellow precipitate thus obtained was washed three to four times with water and acetone and dried in an oven at 70 °C for 4 h.75
Synthesis of ZIF-8 and CdSNPs@ZIF-8 Composites by Encapsulation of Different Amounts of CdSNPs
ZIF-8 was synthesized at room temperature using the previously reported method15,59 by interacting zinc chloride (anhydrous) and 2-methylimidazole. Zinc chloride (anhydrous: 0.341 g; 2.5 mmol) and 2-methylimidazole (1.642 g; 20 mmol) were dissolved separately in methanol (20 mL). The solution of 2-methylimidazole was taken in a narrow stationary reaction vial, to which zinc chloride solution was added very slowly without disturbing the interface. The reaction mixture was allowed to stand for 24 h and then centrifuged, washed several times with methanol, and dried in vacuo at 70 °C. A white crystalline product was collected and stored in an air-tight glass container.
A similar protocol was followed for the synthesis of three different CdSNPs@ZIF-8 core–shell composites by in situ encapsulation of different amounts of as-synthesized CdSNPs during the formation of ZIF-8. During careful mixing of methanol solutions of zinc chloride anhydrous (0.341 g, 2.5 mmol) and 2-methylimidazole (1.642 g, 20 mmol) at room temperature, 150 μL of the suspension of CdSNPs (10 mg), sonicated in 10 mL of methanol for 1 h, was added to the above reaction mixture at certain intervals of time in smaller volume. A white turbidity appeared instantly, and the reaction mixture was allowed to stand for 24 h without disturbing the interface. The solution was centrifuged, washed with methanol several times, and dried in vacuo at 70 °C for 6 h. The composite was collected and stored in an air-tight container. A similar procedure was adopted for the encapsulation of different amounts of CdSNPs using 300 and 500 μL suspensions of CdS nanoparticles.
Characterization of CdSNPs, ZIF-8, and CdSNPs@ZIF-8 Composites
Infrared spectra were recorded in the range of 400–4000 cm–1 on an FTIR Nicolet 6700 Nexus spectrometer using KBr disks. The thermal behaviors of ZIF-8 and CdSNPs@ZIF-8 were studied using a PerkinElmer Pyris Diamond TGA/DTA 6300 instrument. First, 5–10 mg of sample was heated under nitrogen and air separately with a flow rate of 200 mL/min, in the temperature range of 30–1000 °C, and at a heating rate of 10 °C/min. Powder X-ray diffraction patterns of CdS, ZIF-8, and CdSNPs@ZIF-8 were obtained using Bruker D8 Advance with Cu Kα (λ = 1.54056 A°) between 2θ values of 5 and 80° at a scan rate of 1°/min. A Carl Zeiss ULTRA Plus field emission scanning electron microscope operating at 15 kV was used for the morphological analysis of the samples. The samples were prepared by sonicating in methanol for 2 h. Then, 20 μL of the suspension was taken on a very small and well-cleaned glass slide. The slide was dried in vacuum for 30 min at 50 °C. TEM analysis was carried out on a FEI Tecnai G2 20S-TWIN electron microscope operating at an acceleration voltage of 200 kV. A very small amount of sample (1 mg) was dispersed in ethanol by sonication for 30 min. A drop of each of the suspensions was put on carbon-coated copper grid and dried in air. The crystalline nature of the samples was analyzed by selected area electron diffraction (SAED). The optical properties of the samples were analyzed by UV–vis diffuse reflectance spectroscopy (DRS). The DRS spectra were recorded on a Shimadzu UV-2450 UV–vis spectrophotometer in the wavelength range of 200–800 nm with powder samples, and BaSO4 was used as a reference. Electronic absorbance spectra for the study of the photocatalytic degradation of methylene blue aqueous solution were recorded on a Shimadzu 2450 UV–vis spectrophotometer in the wavelength range of 200–800 nm. The surface area, pore size, and pore volume of the samples were analyzed by a Nova Station A instrument at 77 K using liquid N2 as the coolant. The surface area of the samples was calculated by observing BET adsorption and desorption isotherms. The fluorescence and photoluminescence studies were performed on a HORIBA Scientific FluoroMax-4 spectrofluorometer.
Adsorption and Photocatalytic Degradation of Methylene Blue
To study the adsorption and photodegradation of aqueous solution of methylene blue (10 mL; 10 ppm), 10 mg of CdS, ZIF-8, or CdSNPs@ZIF-8 composite was added to the dye solution, which was first kept and sonicated in the dark for 1 h to establish the adsorption–desorption equilibrium and then exposed to constant UV–visible radiations emitted from a 500 W halogen discharge lamp at room temperature. During the photodegradation reaction, stirring was continued to keep the catalyst in suspension, which was kept at a distance of 20 cm from the light source. At regular intervals, a small aliquot of solution was taken out and centrifuged at 14 000 rpm for 10 min, followed by recording of the absorbance of MB at 663 nm. The percentage degradation of the dye was calculated using the following equation (eq 2)
| 2 |
where C is the concentration at a given interval of time and C0 is the initial concentration of the dye.
To investigate the effects of various parameters, such as the initial pH of the dye solution, photocatalyst amount, amount of CdSNPs encapsulated within ZIF-8, and the initial concentration of the dye, only one parameter was varied at a time in the experiments while keeping others constant.
Fluorescence Study and Role of •OH
Hydroxyl radicals (•OH) are very important and crucial active species for degradation of organic pollutants (dyes, PAH, etc.) generated by light in the aqueous medium. Terephthalic acid can be used as •OH quencher, which effectively and selectively combines with •OH, yielding 2-hydroxy terephthalic acid (35%), which produces fluorescence at 425 nm when excited at 315 nm. Thus, the yield of generated •OH can be determined by fluorescence spectral changes.45 The experimental procedures were similar to those used for the measurement of the above photocatalytic experiments. An aqueous solution containing 0.5 mM terephthalic acid and 2 mM NaOH in 100 mL of double-distilled water was prepared and used instead of MB solution. A small aliquot was extracted every 20 min up to 2 h, and fluorescence spectra were recorded using a HORIBA Scientific FluoroMax-4 fluorescence spectrophotometer in the wavelength range of 200–800 nm using excitation wavelength of 315 nm.
Antibacterial Study: Bacterial Culture
For the antibacterial study, green fluorescent protein (GFP)-integrated recombinant strain of E. coli was developed as described76 and cultured in ampicillin-controlled LB medium. Also, S. aureus (MTCC 737) was procured from IMTECH, India. All of the bacterial assays were performed at exponential phase only. The bacterial suspensions were grown in an incubator provided with 37 °C and 220 rpm. During the nanoformulation treatment procedure, two external light-emitting diode lamps (825 lumens each) were provided for photocatalytic reaction to take place.
Optical Density (OD) Studies
In vitro evaluation of light-induced antibacterial activity of the nanoformulations (typically, CdSNPs@ZIF-8 (150 μL) (abbreviated as NC-1), CdSNPs@ ZIF-8 (300 μL) (abbreviated as NC-2), CdSNPs@ZIF-8 (500 μL) (abbreviated as NC-3), ZIF-8, and CdSNPs) after a course of 10 h incubation was conducted in Gram-positive S. aureus and Gram-negative GFP-expressing E. coli and the optical density (OD) was measured at 600 nm. Briefly, the secondary culture of the bacterial cells was treated with the nanoformulations at various concentrations (150, 300, 500, and 700 μg/mL) along with an untreated control for 10 h. The OD was measured in a UV–visible spectrophotometer (Lasany double-beam L1 2800) at 600 nm.
MTT Assay
The cytotoxicity due to nanoformulations treatment was colorimetrically quantified with mitochondrial probe MTT on bacterial cells.77 In a typical reaction, 50 μL of different concentrations of nanoformulations preincubated with bacteria was transferred into a 96-well plate. This was followed by addition of 10 μL of yellow MTT and incubation for 3 h. The formation of purple formazan was confirmed by microscopic visualization. Later, 100 μL of dimethyl sulfoxide was added to each well to solubilize the crystals. The absorbance at 570 nm was measured in a multimode microplate reader (BioTek, Cytation 3). The cell viability was calculated by the following equation (eq 3)
| 3 |
Fluorescence Spectroscopic Analysis
The GFP fluorescence of E. coli was quantified using a fluorescence spectrophotometer (Hitachi F-4600) with an excitation wavelength of 410 nm, emission wavelength range of 465–800 nm, and a scan speed of 240 nm/min.
Fluorescence and Optical Microscopic Image Analyses
Concentration-dependent cytotoxicity upon treatment with nanoformulations was qualitatively determined by fluorescence microscopy. Typically, 5 μL of the nanoformulation (NC-1, NC-2, NC-3, ZIF-8, and CdSNPs) and treated and untreated control GFP E. coli bacteria were taken and smeared over microscopic glass slides. This smear was later visualized under a fluorescence microscope (Nikon Eclipse LV100) having B-2A filter for GFP excitation at a wavelength of 450–490 nm. Similarly, S. aureus was heat-fixed and Gram-stained to capture the image under bright field.
Disk Diffusion Assay
The antibacterial potential of nanoformulations was further qualitatively determined by the Kirby–Bauer disk diffusion method. Initially, overnight-grown agar culture lawn of both GFP E. coli (ampicillin-positive) and S. aureus was prepared. This was incubated with 500 μg of nanoformulations impregnated in a sterile Whatman No. 1 filter paper with a disk diameter of 13 mm over the culture lawn. After 10 h incubation, the plates were UV-illuminated for GFP fluorescence of GFP E. coli and photographed by Bio-Rad Gel Doc XR+ apparatus. On the other hand, direct digital imaging was done for S. aureus. These photographs were used for measuring the zone of inhibition.
Field Emission Scanning Electron Microscopy (FE-SEM) Analysis
The morphological changes after the course of incubation of nanoformulations on the bacterial cells were visualized by field emission microscopy. After treatment, 10 μL of different nanoformulations-treated and GFP E. coli and S. aureus cells were drawn on a square-shaped glass slide. Further, gold was sputtered in a Denton gold sputtering unit and visualized by a Carl Zeiss ULTRA Plus field emission scanning electron microscope (FE-SEM) operating at 10 kV.
Flow Cytometry for Reactive Oxygen Species (ROS) Induction Assay
Intracellular ROS induction upon incubation with nanoformulations was quantitatively estimated by flow cytometry of CellROX Deep Red fluorescence intensity. First, the preincubated cells of E. coli and S. aureus were resuspended in phosphate-buffered saline and allowed for incubation of CellROX Deep Red following the manufacturer’s protocol (5 μM working concentration of CellROX Deep Red). This was followed by fixation of cells with 3% paraformaldehyde. Flow cytometry was performed in Amnis FlowSight. The obtained results were analyzed using IDEAS software.
Acknowledgments
A.M. and S.M. acknowledge the Ministry of Human Resource Development, Government of India, for financial support (Grant number: MHR-02-23-104-429).
Supporting Information Available
The Supporting Information is available free of charge on the ACS Publications website at DOI: 10.1021/acsomega.8b00664.
PXRD patterns of ZIF-8 and NC-1 after five cycles of photocatalysis and NC-1 after keeping it in water for 1 year; FTIR spectra of CdS, ZIF-8, NC-1, NC-2, NC-3, and NC-1 after photocatalysis; FE-SEM images of CdSNPs, ZIF-8, and NC-1; particle size distribution plot; elemental mapping of NC-1; FE-SEM and TEM images of NC-1 after photocatalysis; reflectance spectra; TGA plots; UV–visible spectra for photodegradation of methylene blue (MB) by varying various parameters; scavenger study; GC–MS spectra of possible fragments of MB after its photodegradation; visual image for the aqueous dispersibilty of nanoformulations; UV-illuminated GFP fluorescence photograph and digital photograph of GFP E. coli cells and S. aureus, respectively, treated with NC-1, NC-2, NC-3, CdSNPs, and ZIF-8; scanning electron micrograph of NC-1-treated GFP E. coli cells and S. aureus along with EDAX; surface area, pore volume, and average pore size (Table S1); effect of the amount of CdSNPs encapsulated in ZIF-8 for adsorption and photodegradation of MB (Table S2); effect of pH (Table S3); effect of catalyst (NC-1) amount (Table S4); effect of initial dye concentration (Table S5); and GC–MS analysis of possible fragments of MB after its degradation (Table S6) (PDF)
The authors declare no competing financial interest.
Supplementary Material
References
- Wang C.-C.; Li J.-R.; Lv X.-L.; Zhang Y.-Q.; Guo G. Photocatalytic organic pollutants degradation in metal–organic frameworks. Energy Environ. Sci. 2014, 7, 2831–2867. 10.1039/C4EE01299B. [DOI] [Google Scholar]
- Jing H.-P.; Wang C.-C.; Zhang Y.-W.; Wang P.; Li R. Photocatalytic degradation of methylene blue in ZIF-8. RSC Adv. 2014, 4, 54454–54462. 10.1039/C4RA08820D. [DOI] [Google Scholar]
- Zhang T.; Lin W. Metal–organic frameworks for artificial photosynthesis and photocatalysis. Chem. Soc. Rev. 2014, 43, 5982–5993. 10.1039/C4CS00103F. [DOI] [PubMed] [Google Scholar]
- Li S.-L.; Xu Q. Metal-organic frameworks as platforms for clean energy. Energy Environ. Sci. 2013, 6, 1656–1683. 10.1039/c3ee40507a. [DOI] [Google Scholar]
- Horiuchi Y.; Toyao T.; Takeuchi M.; Matsuoka M.; Anpo M. Recent advances in visible-light-responsive photocatalysts for hydrogen production and solar energy conversion – from semiconducting TiO2 to MOF/PCP photocatalysts. Phys. Chem. Chem. Phys. 2013, 15, 13243–13253. 10.1039/c3cp51427g. [DOI] [PubMed] [Google Scholar]
- Laurier K. G. M.; Vermoortele F.; Ameloot R.; De Vos D. E.; Hofkens J.; Roeffaers M. B. J. Iron(III)-based metal-organic frameworks as visible light photocatalysts. J. Am. Chem. Soc. 2013, 135, 14488–14491. 10.1021/ja405086e. [DOI] [PubMed] [Google Scholar]
- Horiuchi Y.; Toyao T.; Saito M.; Mochizuki K.; Iwata M.; Higashimura H.; Anpo M.; Matsuoka M. Visible-light-promoted photocatalytic hydrogen production by using an amino-functionalized Ti(IV) metal-organic framework. J. Phys. Chem. C 2012, 116, 20848–20853. 10.1021/jp3046005. [DOI] [Google Scholar]
- Long J.; Wang S.; Ding Z.; Wang S.; Zhou Y.; Huang L.; Wang X. Amine-functionalized zirconium metal–organic framework as efficient visible-light photocatalyst for aerobic organic transformations. Chem. Commun. 2012, 48, 11656–11658. 10.1039/c2cc34620f. [DOI] [PubMed] [Google Scholar]
- Du J. J.; Yuan Y. P.; Sun J. X.; Peng F. M.; Jiang X.; Qiu L. G.; Xie A. J.; Shen Y. H.; Zhu J. F. New photocatalysts based on MIL-53 metal–organic frameworks for the decolorization of methylene blue dye. J. Hazard. Mater. 2011, 190, 945–951. 10.1016/j.jhazmat.2011.04.029. [DOI] [PubMed] [Google Scholar]
- Silva C. G.; Corma A.; García H. Metal–organic frameworks as semiconductors. J. Mater. Chem. 2010, 20, 3141–3156. 10.1039/b924937k. [DOI] [Google Scholar]
- Lu G.; Li S.; Guo Z.; Farha O. K.; Hauser B. G.; Qi X.; Wang Y.; Wang X.; Han S.; Liu X.; Duchene J. S.; Zhang H.; Zhang Q.; Chen X.; Ma J.; Loo S. C. J.; Wei W. D.; Yang Y.; Hupp J. T.; Huo F. Imparting functionality to a metal-organic framework material by controlled nanoparticle encapsulation. Nat. Chem. 2012, 4, 310–316. 10.1038/nchem.1272. [DOI] [PubMed] [Google Scholar]
- Chen L. Y.; Peng Y.; Wang H.; Gu Z. Z.; Duan C. Y. Synthesis of Au@ZIF-8 single- or multi-core–shell structures for photocatalysis. Chem. Commun. 2014, 50, 8651–8654. 10.1039/C4CC02818J. [DOI] [PubMed] [Google Scholar]
- Li S.; Huo F. Hybrid crystals comprising metal-organic frameworks and functional particles: synthesis and applications. Small 2014, 10, 4371–4378. 10.1002/smll.201303564. [DOI] [PubMed] [Google Scholar]
- Dai H. M.; Xia B. Q.; Wen L.; Du C.; Su J.; Luo W.; Cheng G. Z. Synergistic catalysis of AgPd@ZIF-8 on dehydrogenation of formic acid. Appl. Catal., B 2015, 165, 57–62. 10.1016/j.apcatb.2014.09.065. [DOI] [Google Scholar]
- Chandra R.; Mukhopadhyay S.; Nath M. TiO2@ZIF-8: A novel approach of modifying micro-environment for enhanced photo-catalytic dye degradation and high usability of TiO2 nanoparticles. Mater. Lett. 2016, 164, 571–574. 10.1016/j.matlet.2015.11.018. [DOI] [Google Scholar]
- Yu B.; Wang F.; Dong W.; Hou J.; Lu P.; Gong J. Self-template synthesis of core-shell ZnO@ZIF-8 nanospheres and the photocatalysis under UV irradiation. Mater. Lett. 2015, 156, 50–53. 10.1016/j.matlet.2015.04.142. [DOI] [Google Scholar]
- Gao Y.; Wu J.; Zhang W.; Tan Y.; Zhao J.; Tang B. The electrochemical performance of SnO2 quantum dots@zeolitic imidazolate frameworks-8 (ZIF-8) composite material for supercapacitors. Mater. Lett. 2014, 128, 208–211. 10.1016/j.matlet.2014.04.175. [DOI] [Google Scholar]
- Ke F.; Qiu L.-G.; Zhu J. F. Fe3O4@MOF Core–shell magnetic microspheres as excellent catalysts for the Claisen–Schmidt condensation reaction. Nanoscale 2014, 6, 1596–1601. 10.1039/C3NR05051C. [DOI] [PubMed] [Google Scholar]
- Zhang C.-F.; Qiu L.-G.; Ke F.; Zhu Y.-J.; Yuan Y.-P.; Xu G.-S.; Jiang X. A novel magnetic recyclable photocatalyst based on a core–shell metal–organic framework Fe3O4@MIL-100(Fe) for the decolorization of methylene blue dye. J. Mater. Chem. A 2013, 1, 14329–14334. 10.1039/c3ta13030d. [DOI] [Google Scholar]
- Zhang T.; Zhang X.; Yan X.; Kong L.; Zhang G.; Liu H.; Qiu J.; Yeung K. L. Synthesis of Fe3O4@ZIF-8 magnetic core-shell microspheres and their potential application in a capillary microreactor. Chem. Eng. J. 2013, 228, 398–404. 10.1016/j.cej.2013.05.020. [DOI] [Google Scholar]
- Zhan W. W.; Kuang Q.; Zhou J. Z.; Kong X. J.; Xie Z. X.; Zheng L. S. Semi-conductor@metal-organic framework core-shell heterostructures: a case of ZnO@ZIF-8 nanorods with selective photoelectrochemical response. J. Am. Chem. Soc. 2013, 135, 1926–1933. 10.1021/ja311085e. [DOI] [PubMed] [Google Scholar]
- Ke F.; Qiu L.-G.; Yuan Y.-P.; Jiang X.; Zhu J.-F. Fe3O4@MOF core–shell magnetic microspheres with a designable metal–organic framework shell. J. Mater. Chem. 2012, 22, 9497–9500. 10.1039/c2jm31167d. [DOI] [Google Scholar]
- Momeni M. M.; Mirhosseini M.; Chavoshi M. Growth and characterization of Ta2O5 nanorod and WTa2O5 nanowire films on the tantalum substrates by a facile one-step hydrothermal method. Ceram. Int. 2016, 42, 9133–9138. 10.1016/j.ceramint.2016.03.002. [DOI] [Google Scholar]
- Momeni M. M.; Mozafari A. A. The effect of number of silar cycles on morphological, optical and photocatalytic properties of cadmium sulfide–titania films. J. Mater. Sci.: Mater. Electron. 2016, 27, 10658–10666. 10.1007/s10854-016-5163-4. [DOI] [Google Scholar]
- Momeni M. M.; Ghayeb Y.; Davarzadeh M. Electrochemica construction of different titania–tungsten trioxide nanotubular composite and their photocatalytic activity for pollutant degradation: a recyclable photocatalysts. J. Mater. Sci.: Mater. Electron. 2015, 26, 1560–1567. 10.1007/s10854-014-2575-x. [DOI] [Google Scholar]
- Momeni M. M.; Ghayeb Y.; Gheibee S. Silver nanoparticles decorated titanium dioxide-tungsten trioxide nanotube films with enhanced visible light photocatalytic activity. Ceram. Int. 2017, 43, 564–570. 10.1016/j.ceramint.2016.09.195. [DOI] [Google Scholar]
- Li A.-L.; Ke F.; Qiu L.-G.; Jiang X.; Wang Y.-M.; Tian X.-Y. Controllable synthesis of metal–organic framework hollow nanospheres by a versatile step-by-step assembly strategy. Cryst. Eng. Commun. 2013, 15, 3554–3559. 10.1039/c2ce26636a. [DOI] [Google Scholar]
- Lee H. J.; Cho W.; Oh M. Advanced fabrication of metal–organic frameworks: template-directed formation of polystyrene@ZIF-8 core–shell and hollow ZIF-8 microspheres. Chem. Commun. 2012, 48, 221–223. 10.1039/C1CC16213F. [DOI] [PubMed] [Google Scholar]
- Song J.; Luo Z.; Britt D. K.; Furukawa H.; Yaghi O. M.; Hardcastle K. I.; Hill C. L. A multiunit catalyst with synergistic stability and reactivity: a polyoxometalate-metal organic framework for aerobic decontamination. J. Am. Chem. Soc. 2011, 133, 16839–16846. 10.1021/ja203695h. [DOI] [PubMed] [Google Scholar]
- Sun C.-Y.; Liu S.-X.; Liang D.-D.; Shao K.-Z.; Ren Y.-H.; Su Z.-M. Highly stable crystalline catalysts based on a microporous metal-organic framework and polyoxometalates. J. Am. Chem. Soc. 2009, 131, 1883–1888. 10.1021/ja807357r. [DOI] [PubMed] [Google Scholar]
- Zhuang J.; Chou L. Y.; Sneed B. T.; Cao Y.; Hu P.; Feng L.; Tsung C. K. Surfactant-mediated conformal overgrowth of core-shell metal-organic framework materials with mismatched topologies. Small 2015, 11, 5551–5555. 10.1002/smll.201501710. [DOI] [PubMed] [Google Scholar]
- Koh K.; Wong-Foy A. G.; Matzger A. J. MOF@MOF: microporous core–shell architectures. Chem. Commun. 2009, 6162–6164. 10.1039/b904526k. [DOI] [PubMed] [Google Scholar]
- Yang J.; Zhang F. J.; Lu H. Y.; Hong X.; Jiang H.; Wu Y.; Li Y. D. Hollow Zn/Co ZIF particles derived from core–shell ZIF-67@ZIF-8 as selective catalyst for the semi-hydrogenation of acetylene. Angew. Chem., Int. Ed. 2015, 54, 10889–10893. 10.1002/anie.201504242. [DOI] [PubMed] [Google Scholar]
- Yang Y.; Wang F.; Yang Q.; Hu Y.; Yan H.; Chen Y. Z.; Liu H.; Zhang G.; Lu J.; Jiang H. L.; Xu H. Hollow metal-organic framework nanospheres via emulsion-based interfacial synthesis and their application in size-selective catalysis. ACS Appl. Mater. Interfaces 2014, 6, 18163–18171. 10.1021/am505145d. [DOI] [PubMed] [Google Scholar]
- Chen R.; Zhang J. F.; Wang Y.; Chen X. F.; Zapien J. A.; Lee C.-S. Graphitic carbon nitride nanosheet@metal–organic framework core–shell nanoparticles for photo-chemo combination therapy. Nanoscale 2015, 7, 17299–17305. 10.1039/C5NR04436G. [DOI] [PubMed] [Google Scholar]
- Yang D.; Yang G. X.; Gai S. L.; He F.; An G. H.; Dai Y. L.; Lv R. C.; Yang P. P. Au25 cluster functionalized metal–organic nanostructures for magnetically targeted photodynamic/photothermal therapy triggered by single wavelength 808 nm near-infrared light. Nanoscale 2015, 7, 19568–19578. 10.1039/C5NR06192J. [DOI] [PubMed] [Google Scholar]
- He L.; Liu Y.; Liu J.; Xiong Y.; Zheng J.; Liu Y.; Tang Z. Core-shell noble-metal@metal-organic-framework nanoparticles with highly selective sensing property. Angew. Chem., Int. Ed. 2013, 52, 3741–3745. 10.1002/anie.201209903. [DOI] [PubMed] [Google Scholar]
- Li T.; Sullivan J. E.; Rosi N. L. Design and preparation of a core-shell metal-organic framework for selective CO2 capture. J. Am. Chem. Soc. 2013, 135, 9984–9987. 10.1021/ja403008j. [DOI] [PubMed] [Google Scholar]
- Gu X.; Lu Z. H.; Jiang H. L.; Akita T.; Xu Q. Synergistic catalysis of metal-organic framework-immobilized Au-Pd nanoparticles in dehydrogenation of formic acid for chemical hydrogen storage. J. Am. Chem. Soc. 2011, 133, 11822–11825. 10.1021/ja200122f. [DOI] [PubMed] [Google Scholar]
- Park T. H.; Hickman A. J.; Koh K.; Martin S.; Wong-Foy A. G.; Sanford M. S.; Matzger A. J. Highly dispersed palladium(II) in a defective metal-organic framework: application to C-H activation and functionalization. J. Am. Chem. Soc. 2011, 133, 20138–20141. 10.1021/ja2094316. [DOI] [PubMed] [Google Scholar]
- Ameloot R.; Roeffaers M. B. J.; De Cremer G.; Vermoortele F.; Hofkens J.; Sels B. F.; De Vos D. E. Metal-organic framework single crystals as photoactive matrices for the generation of metallic microstructures. Adv. Mater. 2011, 23, 1788–1791. 10.1002/adma.201100063. [DOI] [PubMed] [Google Scholar]
- Buso D.; Nairn K. M.; Gimona M.; Hill A. J.; Falcaro P. Fast synthesis of MOF-5 microcrystals using Sol-Gel SiO2 nanoparticles. Chem. Mater. 2011, 23, 929–934. 10.1021/cm101519s. [DOI] [Google Scholar]
- Sugikawa K.; Furukawa Y.; Sada K. SERS-active metal-organic frameworks embedding gold nanorods. Chem. Mater. 2011, 23, 3132–3134. 10.1021/cm200737c. [DOI] [Google Scholar]
- Tsuruoka T.; Kawasaki H.; Nawafune H.; Akamatsu K. Controlled self-assembly of metal-organic frameworks on metal nanoparticles for efficient synthesis of hybrid nanostructures. ACS Appl. Mater. Interfaces 2011, 3, 3788–3791. 10.1021/am200974t. [DOI] [PubMed] [Google Scholar]
- Chandra R.; Nath M. Multi-core-shell TiO2@ZIF-8 composite for enhanced photocatalytic degradation and adsorption of methylene blue and rhodamine-B. ChemistrySelect 2017, 2, 7711–7722. 10.1002/slct.201701195. [DOI] [Google Scholar]
- Zeng M.; Chai Z.; Deng X.; Li Q.; Feng S.; Wang J.; Xu D. Core–shell CdS@ZIF-8 structures for improved selectivity in photocatalytic H2 generation from formic acid. Nano Res. 2016, 9, 2729–2734. 10.1007/s12274-016-1161-3. [DOI] [Google Scholar]
- Li H.; Wang X.; Xu J.; Zhang Q.; Bando Y.; Golberg D.; Ma Y.; Zhai T. One-dimensional CdS nanostructures: a promising candidate for optoelectronics. Adv. Mater. 2013, 25, 3017–3037. 10.1002/adma.201300244. [DOI] [PubMed] [Google Scholar]
- Zhang Y.; Zhang N.; Tang Z.-R.; Xu Y.-J. Transforming CdS into an efficient visible light photocatalyst for selective oxidation of saturated primary C–H bonds under ambient conditions. Chem. Sci. 2012, 3, 2812–2822. 10.1039/c2sc20603j. [DOI] [Google Scholar]
- Pan Z.; Zhang H.; Cheng K.; Hou Y.; Hua J.; Zhong X. Highly efficient inverted type-I CdS/CdSe core-shell structure QD-sensitized solar cells. ACS Nano 2012, 6, 3982–3991. 10.1021/nn300278z. [DOI] [PubMed] [Google Scholar]
- Khan Z. R.; Zulfequar M.; Khan M. S. Chemical synthesis of CdS nanoparticles and their optical and dielectric studies. J. Mater. Sci. 2011, 46, 5412–5416. 10.1007/s10853-011-5481-0. [DOI] [Google Scholar]
- Wang H.; Sun Z.; Lu Q.; Zeng F.; Su D. One-pot synthesis of (Au nanorod)-(metal sulfide) core-shell nanostructures with enhanced gas-sensing property. Small 2012, 8, 1167–1172. 10.1002/smll.201102287. [DOI] [PubMed] [Google Scholar]
- Liu S.; Ke D.; Zeng J.; Zhou J.; Peng T.; Zhang L. Construction of inorganic nanoparticles by micro-nano-porous structure of cellulose matrix. Cellulose 2011, 18, 945–956. 10.1007/s10570-011-9556-5. [DOI] [Google Scholar]
- Salcher A.; Nikolic M. S.; Casado S.; Velez M.; Weller H.; Juarez B. H. CdSe/CdS nanoparticles immobilized on pNIPAm-based microspheres. J. Mater. Chem. 2010, 20, 1367–1374. 10.1039/b917022g. [DOI] [Google Scholar]
- White J. C.; Dutta P. K. Assembly of nanoparticles in zeolite Y for the photocatalytic generation of hydrogen from water. J. Phys. Chem. C 2011, 115, 2938–2947. 10.1021/jp108336a. [DOI] [Google Scholar]
- Hirai T.; Bando Y.; Komasawa I. Immobilization of CdS nanoparticles formed in reverse micelles onto alumina particles and their photocatalytic properties. J. Phys. Chem. B 2002, 106, 8967–8970. 10.1021/jp020386v. [DOI] [Google Scholar]
- Lin R.; Shen L.; Ren Z.; Wu W.; Tan Y.; Fu H.; Zhang J.; Wu L. Enhanced photocatalytic hydrogen production activity via dual modification of MOF and reduced graphene oxide on CdS. Chem. Commun. 2014, 50, 8533–8535. 10.1039/C4CC01776E. [DOI] [PubMed] [Google Scholar]
- Zhou J.-J.; Wang R.; Liu X.-L.; Peng F.-M.; Li C.-H.; Teng F.; Yuan Y.-P. In situ growth of CdS nanoparticles on UiO-66 metal-organic framework octahedrons fore enhanced photocatalytic hydrogen production under visible light irradiation. Appl. Surf. Sci. 2015, 346, 278–283. 10.1016/j.apsusc.2015.03.210. [DOI] [Google Scholar]
- Abidov A.; Allabergenov B.; Lee J.; Jeon H. W.; Jeong S. W.; Kim S. X-ray photoelectron spectroscopy characterization of Fe doped TiO2 photocatalyst. Int. J. Mater., Mech. Manuf. 2013, 3, 294–296. 10.7763/IJMMM.2013.V1.63. [DOI] [Google Scholar]
- Lai Q.; Zhao Y.; Liang Y.; He J.; Chen J. In situ confinement pyrolysis transformation of ZIF-8 to nitrogen-enriched meso-microporous carbon frameworks for oxygen reduction. Adv. Funct. Mater. 2016, 26, 8334–8344. 10.1002/adfm.201603607. [DOI] [Google Scholar]
- Mir F. A.; Chattarjee I.; Dar A. A.; Asokan K.; Bhat G. M. Preparation and characterizations of cadmium sulfide nanoparticles. Optik 2015, 126, 1240–1244. 10.1016/j.ijleo.2015.03.022. [DOI] [Google Scholar]
- Xu Y.-S.; Zhang W.-D. Monodispersed Ag3PO4 nanocrystals loaded on the surface of spherical Bi2MoO6 with enhanced photocatalytic performance. Dalton Trans. 2013, 42, 1094–1101. 10.1039/C2DT31634J. [DOI] [PubMed] [Google Scholar]
- Huang F.; Chen L.; Wang H.; Yan Z. Analysis of the degradation mechanism of methylene blue by atmospheric pressure dielectric barrier discharge plasma. Chem. Eng. J. 2010, 162, 250–256. 10.1016/j.cej.2010.05.041. [DOI] [Google Scholar]
- Yan X.; Liu K.; Shi W. Facile synthesis of CdS/MnWO4 heterojunction with enhanced visible-light-driven photocatalytic activity and mechanism investigation. Colloids Surf., A 2017, 520, 138–145. 10.1016/j.colsurfa.2017.01.065. [DOI] [Google Scholar]
- Nanda S. S.; Yi D. K.; Kim K. Study of antibacterial mechanism of graphene oxide using Raman spectroscopy. Sci. Rep. 2016, 6, 28443 10.1038/srep28443. [DOI] [PMC free article] [PubMed] [Google Scholar]
- Li W.; Houston K. D.; Houston J. P. Shifts in the fluorescence lifetime of EGFP during bacterial phagocytosis measured by phase-sensitive flow cytometry. Sci. Rep. 2017, 7, 40341 10.1038/srep40341. [DOI] [PMC free article] [PubMed] [Google Scholar]
- Matai I.; Sachdev A.; Dubey P.; Kumar S. U.; Bhushan B.; Gopinath P. Antibacterial activity and mechanism of Ag-ZnO nanocomposite on S. aureus and GFP-expressing antibiotic resistant E. coli. Colloids Surf., B 2014, 115, 359–367. 10.1016/j.colsurfb.2013.12.005. [DOI] [PubMed] [Google Scholar]
- Bhargavi G.; Matai I.; Sachdev A.; Kumar S. U.; Gopinath P. Microwave assisted synthesis of chitosan nanorods and assessment of its antibacterial activity against GFP-expressing antibiotic resistant E. coli. J. Chitin Chitosan Sci. 2013, 1, 167–172. 10.1166/jcc.2013.1027. [DOI] [Google Scholar]
- Pal N.; Dubey P.; Gopinath P.; Pal K. Combined effect of cellulose nanocrystal and reduced graphene oxide into poly-lactic acid matrix nanocomposite as a scaffold and its anti-bacterial activity. Int. J. Biol. Macromol. 2017, 95, 94–105. 10.1016/j.ijbiomac.2016.11.041. [DOI] [PubMed] [Google Scholar]
- Liu S.; Zeng T. H.; Hofmann M.; Burcombe E.; Wei J.; Jiang R.; Kong J.; Chen Y. Antibacterial activity of graphite, graphite oxide, graphene oxide, and reduced graphene oxide: membrane and oxidative stress. ACS Nano 2011, 5, 6971–6980. 10.1021/nn202451x. [DOI] [PubMed] [Google Scholar]
- Zhou Y.; Kong Y.; Kundu S.; Cirillo J. D.; Liang H. Antibacterial activities of gold and silver nanoparticles against Escherichia coli and bacillus calmette-guérin. J. Nanobiotechnol. 2012, 10, 19. 10.1186/1477-3155-10-19. [DOI] [PMC free article] [PubMed] [Google Scholar]
- Waiskopf N.; Ben-Shahar Y.; Galchenko M.; Carmel I.; Moshitzky G.; Soreq H.; Banin U. Photocatalytic reactive oxygen species formation by semiconductor-metal hybrid nanoparticles. Toward light-induced modulation of biological processes. Nano Lett. 2016, 16, 4266–4273. 10.1021/acs.nanolett.6b01298. [DOI] [PubMed] [Google Scholar]
- Jia H.; He W.; Wamer W. G.; Han X.; Zhang B.; Zhang S.; Zheng Z.; Xiang Y.; Yin J.-J. Generation of reactive oxygen species, electrons/holes, and photocatalytic degradation of rhodamine B by photoexcited CdS and Ag2S micro-nano structures. J. Phys. Chem. C 2014, 118, 21447–21456. 10.1021/jp505783y. [DOI] [Google Scholar]
- Rajavel K.; Gomathi R.; Manian S.; Kumar R. T. R. In vitro bacterial cytotoxicity of CNTs: reactive oxygen species mediate cell damage edges over direct physical puncturing. Langmuir 2014, 30, 592–601. 10.1021/la403332b. [DOI] [PubMed] [Google Scholar]
- Santos M. A.; Faryabi R. B.; Ergen A. V.; Day A. M.; Malhowski A.; Canela A.; Onozawa M.; Lee J. E.; Callen E.; Gutierrez-Martinez P.; Chen H. T.; Wong N.; Finkel N.; Deshpande A.; Sharrow S.; Rossi D. J.; Ito K.; Ge K.; Aplan P. D.; Armstrong S. A.; Nussenzweig A. DNA-damage-induced differentiation of leukaemic cells as an anti-cancer barrier. Nature 2014, 514, 107–111. 10.1038/nature13483. [DOI] [PMC free article] [PubMed] [Google Scholar]
- Qutub N.; Pirzada B. M.; Umar K.; Sabir S. Synthesis of CdS nanoparticles using different sulphide ion precursors: formation mechanism and photocatalytic degradation of acid blue-29. J. Environ. Chem. Eng. 2016, 4, 808–817. 10.1016/j.jece.2015.10.031. [DOI] [Google Scholar]
- Gogoi S. K.; Gopinath P.; Paul A.; Ramesh A.; Ghosh S. S.; Chattopadhyay A. Green fluorescent protein-expressing Escherichia coli as a model system for investigating the antimicrobial activities of silver nanoparticles. Langmuir 2006, 22, 9322–9328. 10.1021/la060661v. [DOI] [PubMed] [Google Scholar]
- Das B.; Dash S. K.; Mandal D.; Ghosh T.; Chattopadhyay S.; Tripathy S.; Das S.; Dey S. K.; Das D.; Roy S. Green synthesized silver nanoparticles destroy multidrug resistant bacteria via reactive oxygen species mediated membrane damage. Arabian J. Chem. 2017, 10, 862–876. 10.1016/j.arabjc.2015.08.008. [DOI] [Google Scholar]
Associated Data
This section collects any data citations, data availability statements, or supplementary materials included in this article.


