 Staphylococcus aureus is a commonly found pathogen cause life threatening infections and can be controlled by nanoparticles as antibiofilm candidates.
Abstract
Staphylococcus aureus is a commonly found pathogen that can cause food-spoilage and life threatening infections. However, the potential molecular effects of natural active thymol molecules and chitosan silver nanoparticles (C@AgNPs) in bacteria remain unclear. This gap in the literature has prompted us to study the effects of thymol loaded chitosan silver nanoparticles (T-C@AgNPs) against biofilm associated proteins in methicillin-resistant S. aureus (Bap-MRSA) 090 and also their toxicity, anti-cancer activity, and validation of their in silico molecular docking. The results showed excellent antibacterial activity of T-C@AgNPs against Bap-MRSA 090, having a minimum inhibitory concentration of 100 μg mL–1 and a 10.08 ± 0.06 mm zone of inhibition (ZOI). The cyclic voltammogram (CV) analysis clearly showed pore forming of T-C@AgNPs at 300 μg mL–1 concentration, and evidence of the interruption of the electron transport chain was clearly seen. The 200 μg mL–1 concentration exhibited a 52.60 ± 0.25% anti-biofilm property by T-C@AgNPs against Bap-MRSA 090. The T-C@AgNPs showed no toxicity to peripheral blood mononuclear cells (PBMC) (IC50 = 221 ± 0.71 μg mL–1) compared to the control, and anti-cancer activity against human triple negative breast cancer cell line (MDA-MB-231) (IC50 110 ± 1.0 μg mL–1) compared to the standard drug Doxorubicin (IC50 = 19 ± 1.0). The excellent properties of T-C@AgNPs were validated by in silico molecular docking studies and showed best match scoring to target proteins compared to standards. These excellent properties of T-C@AgNPs highlight for the first time its pharmacology and potential in medicinal drug development applications for future research.
Introduction
Nature has provided many methods and insights into the synthesis of advanced nanomaterials. Many microorganisms, such as bacteria, fungi, yeast and, plant extracts have acted as eco-friendly precursors for the synthesis of nanoparticles (NPs) for potential applications. Capping agents have proven to be very important in NP synthesis, where these NPs can be functionalized and stabilized using capping agents to impart useful properties by controlling morphology, size and protecting the surface, thereby preventing aggregation. Many surfactants have been reported to be used as capping agents for altering the desired shape and size of NPs, but these are difficult to remove and do not easily degrade. The biocompatibility of bio-inspired NPs offers very interesting applications in biomedicine and related fields. In medical science, nanoparticles are used in treatments, diagnosis and drug delivery for different diseases.1 They also have the capability of solving the drug resistance problem in pathogens as it possible to use various antimicrobial mechanisms and the high surface to volume ratio also hampers the development of resistance in the pathogens. These nanoparticles are able to target antimicrobial agents at the site of infection, thus higher doses of drug can be given at the infection site, which overcomes resistance.2 Therefore, there is an urgent need to use environment-friendly capping agents and design green biochemical routes in the laboratory and at the industrial level for NP synthesis.3
A biofilm producing bacterium is resistant to many antibiotics by preventing them to from penetrating into cells. More than 25% of infections are associated with biofilm formation towards medical devices. The S. aureus group of microorganisms forms a biofilm by producing an extracellular mucous substance, known as polysaccharide intercellular adhesion (PIA). These are a self-produced hydrated polymeric matrix, called a biofilms. PIA is made of glycosaminoglycan, which provides the biofilm with a stable structure and helps the bacteria to adhere to material surfaces, protecting the bacteria embedded in it from being killed by the immune system or antibiotics. Among the most common Staphylococcal species which cause problems to humans are S. aureus and S. epidermidis. The natural ability of Staphylococcus to grow within a biofilm increases its survival rate against phagocytosis, such as host defense, antibiotic therapeutics and biocide materials.4
Silver nanoparticles have numerous applications due to their unique properties and bioactivities. The basic and most common method of preparation of AgNPs is through the reaction of silver nitrite (AgNO3) with a chemical reducing agent, followed by the addition of a polymer as a stabilizing or capping agent. Recently, eco-friendly natural sources of polysaccharides have been used to replace the conventional chemical agents. These polysaccharides may act as both the reducing and stabilizing agent. The synthesis can also be accomplished in a single step. There are also many different microbial exopolysaccharides (EPS) used for the preparation of AgNPs, such as xanthan, dextran, gellan, curdlan and alginate.5
Currently, novel and innovative methods are required for the prevention of biofilm formation and the treatment of formed biofilm related infectious diseases. Recent progress in nanotechnology provides a new approach for the treatment of these diseases. Several nanoparticles with antibacterial capacity have been studied. Chitosan silver (CS) nanoparticles could inhibit the growth of various bacteria. Exposure of Salmonella choleraesuis to CS nanoparticles led to the disruption of cell membranes and the leakage of cytoplasm. In order to allow the implanted material to have antibacterial properties, coating and impregnation of these antibacterial nanomaterials has also been studied.4 The antimicrobial efficacy of silver nanoparticles (SNPs) have been demonstrated through several studies, although only a few anticancer studies have been conducted in this regard. Since the Food and Drug Administration (FDA) approved their usage in the human body, SNPs could be used as potential antimicrobial and anticancer agents, especially in emergent situations such as treating burns and the healing of wounds.
Thymol, also known as 5-methyl-2-iso-propylphenol, is a natural agent obtained from thyme and thyme oil. It shows antimicrobial properties against yeast, fungi and microbes. It exhibits significant activities against both Gram-positive and Gram-negative bacteria and it is known that the phenolics in the essential oil are able to break and disturb the membrane of the microbes. According to United States FDA, thymol is a generally recognized as safe (GRAS) food additive.6 The antimicrobial action of essential oils may be due to the impairment of a variety of enzyme systems, including those involved in energy production and structural component synthesis. In general, studies on the mechanism of action of essential oils have used a common methodology that attempts to illustrate deleterious effects on cellular membranes, permeability and proton motive force.7 The antibacterial activity of essential oils from spices has been reviewed recently, although their mechanism of action against microorganisms has not been studied in detail.
With these observations, we decided to further investigate, for the first time, the previously synthesized T-C@AgNPs against methicillin-resistant Staphylococcus aureus (Bap-MRSA) 090, to determine the biocidal mechanism and its gene expression, and to study the related bacteremia infection conditions in the homeostatic environment. The biocidal action of T-C@AgNPs was also validated by molecular docking in the present study for the first time.
Materials and methods
Chemicals and bacterial strains
Nutrient agar, broth media and chitosan were purchased from Hi-Media (Bangalore, India), Tris-buffer, AgNO3 and HCl, were obtained from Merck-Millipore (Bangalore, India), Thymol was purchased from Sigma, India, and Millipore water was used in all the experiments. The methicillin-resistant Staphylococcus aureus (MRSA) 090 is our in-house isolate, and the reference bacterial strains of Staphylococcus aureus (96) and Escherichia coli (1610) were obtained from Microbial Type Culture Collection (MTCC) and cultured as per the protocol prescribed by MTCC.
Synthesis of thymol loaded chitosan silver nanoparticles (T-C@AgNPs)
We synthesized a promising T-C@AgNPs using the following method. 0.5 g of chitosan was dissolved in 2% acetic acid solution. In addition 0.5 g of silver nitrate (AgNO3) in deionized water was prepared. Exactly 5 ml of the above described chitosan and silver nitrate solutions were mixed in the boiling tube then kept in an autoclave at 15 pound-force per square inch (PSI) pressure, at 120 °C for 1 h. The resulting clear yellow solution was mixed with 0.5 g of thymol and sonicated for 3 h at room temperature. The resulting muddy gray colored solution indicates the formation of thymol loaded chitosan-silver nanoparticles (T-C@AgNPs).1
Characterization of T-C@AgNPs
The T-C@AgNPs were prepared by vacuum drying to obtain a fine powder to study the size, shape, crystallinity, functional groups and elemental analysis by subjecting it to scanning electron microscope (SEM), X-ray diffraction (XRD), Fourier transform infrared (FTIR) spectroscopy, and electron dispersive X-ray (EDX), respectively. The size, distribution and surface charge of the T-C@AgNPs was studied through dynamic light scattering (DLS) and zeta potential analysis.1
In vitro antimicrobial efficacy of T-C@AgNPs
The bacterial strains were subjected to the disc diffusion method according to Manukumar et al.1 to deduce the T-C@AgNPs susceptibility. The isolated food-borne pathogen Bap-MRSA 090 was used for the antimicrobial study, along with the reference bacterial strains obtained from MTCC. The bacterial suspension was prepared from the overnight culture and 1 × 10⁶ CFU mL–1 cells and inoculated on to the nutrient agar, then a sterile disc (3 mm) was loaded with 5 μL of different serial dilutions of T-C@AgNPs (10, 20, 30, 40, 50 and 100 μg disc–1). The sterile distilled water and Streptomycin (10 μg disc–1) served as a negative and positive control, respectively. The plates were sealed and incubated at 37 °C for 24 h to examine the zone of inhibition (ZOI). Assays were performed in triplicate and repeated thrice.
Inhibitory effect on electron transport chain (ETC)
Bioelectrochemical measurements
Prior to determining the Bap-MRSA 090 respiration measurements, the standard working electrode was activated electrochemically in sodium phosphate buffer (0.1 M, pH 7) by measuring the cyclic scan in the range of 0.2 to 1.0 V with a rate of 50 mv S–1. The cyclic voltammogram (CV) potential was recorded in the range from 0.3 to 0.4 V with a scan rate of 5 mV S–1, at room temperature without stirring. All potentials are referred to Ag/AgCl/3 M KCl as a reference electrode.
Metabolic activation
The active metabolic state of Bap-MRSA 090 was confirmed using various carbon sources such as d-(+)-glucose, d-(+)-galactose, sodium acetate and succinate (10 g L–1 each) in different sterile solutions of phosphate buffer (0.1 M, pH 7). The metabolism of Bap-MRSA 090 cells was activated by incubating a phosphate-buffered saline (PBS) washed cell suspension in each of the carbon sources for about 30 min at 37 °C in a shaking incubator. The bioelectrical response was then determined and a supplement without carbohydrate was used as the control.
Cells with mediators(s) and substrate
Each reaction was carried out in a total volume of 20 mL incubation suspension. The standard reaction suspension comprised 15 mL of PBS containing cell suspension (OD600 = 2.5), 3 mL of ferricyanide (0.30 M in PBS) solution, 1 mL of glucose (50 mM in PBS) solution, 100 μl of DCPIP (20 mM in 96% ethanol, which was filtered sterilized and stored in a light-studies container at 4 °C) or only 100 μl of PBS and required amount of T-C@AgNPs. Finally, the reaction volume was made up to 20 mL with PBS. The cells were then incubated with substrate and mediator(s) for 2 h at 30 °C under oxygen-free nitrogen sparging. Upon completion of the reaction, the cells were centrifuged at 10 000 rpm for 5 min at 4 °C and the supernatant was used for further analysis.8 The assays were performed in triplicate and repeated thrice.
Electro analysis
Electrochemical experiments were performed using an electrochemical workstation (Biologic instruments SP-150, USA). In this study a glassy carbon electrode (GCE), platinum wire (Pt) and saturated calomel electrode (SCE) were used as working, auxiliary and reference electrodes, respectively. Prior to the experiments, the GCE was polished with 0.3–0.05 μm alumina slurry. It was then rinsed with double distilled water and the electrode was sonicated in ethanol, followed by deionized water for 2 min. The cyclic voltammograms were obtained at a scan rate of 10 mV–1 in the potential range of 0.1 to 0.5 V.9
Bacterial cell microscopy
Scanning electron microscopy was carried out to study Bap-MRSA 090 membrane damage by treating the minimum inhibitory concentration (MIC) of T-C@AgNPs for 2 h, and then cells were pelleted by centrifugation (10 000 rpm for 5 min) at 4 °C. The cells were fixed by using glutaraldehyde (2.5%) in PBS, pelleted and deposited on a glass slide followed by stepwise treatment of 30% to 100% ethanol drying. Afterwards, 2 days of drying at room temperature was performed before SEM analysis.10
Action of T-C@AgNPs on attachment of Bap-MRSA 090 biofilm
Inoculum preparation
The Bap-MRSA 090 isolate was grown in Mueller–Hinton Broth (MHB) at 35 °C for 18–20 h and cells were harvested by centrifuging at 5000 rpm at 4 °C for 8 min. The pelleted cells were washed thrice, and re-suspended in a sterile saline solution. Then, the cell density was adjusted to an optical density of 0.1 at 600 nm (OD600) using a UV-visible spectrometer having viable counts of approximately 6 log CFU mL–1.
Quantitative determination of biofilm production
The quantitative test was performed for determination of biofilm production using the microtiter plate method (MtP). The experiment was performed according to the method described by dos Santos Rodrigues et al.11 with slight modifications. The different concentrations of T-C@AgNPs and 20 μL aliquots of cell suspension were inoculated into each of a six-well polystyrene microtiter plate containing 180 μl of trypticase soy broth (TSB) supplemented with glucose (10 g/100 mL). MtP was covered and incubated at a static condition of 37 °C for 18 h aerobically to favor greater adherence of Bap-MRSA. After each well was washed thrice with a sterile saline solution, the cells were fixed with 150 μl of methanol for 20 min and the MtP was dried at room temperature. The cells were stained with crystal violet (0.5%) for 15 min then the contents discarded and washed thrice with 200 μl of saline solution. The MtP was dried using 150 μl of 95% ethanol, dye was bound to the cells and was eluted for 30 min, an absorbance at 490 nm was determined using a microplate spectrophotometer. To quantify the intensity of the biofilm, the mean OD was compared to the OD of the negative control (only TSB medium) plus three times its standard deviation. Assays were performed in triplicate and repeated thrice.
Effect of T-C@AgNPs on Bap-MRSA 090 gene regulation
RNA extraction
Overnight grown Bap-MRSA 090 cultured cells were harvested by centrifuging at 10 000 rpm for 5 min at 4 °C, cells were then washed thrice with phosphate buffer (0.05 M K2HPO4/KH2PO4, pH 7) and re-suspended in PBS (0.05 M K2HPO4/KH2PO4, 0.1 M KCl, pH 7). Cell density was adjusted to an optical density of 2.5 at 600 nm (OD600) using a UV-visible spectrometer and centrifuged to obtain a pellet for the purification of RNA using the TRIzol method. Briefly, to obtain the pelleted cells, 1 mL of TRIzol extraction buffer was added and incubated for 5 min at room temperature, then 200 μl of chloroform per mL of TRIzol was added and shaken for 10 seconds before incubating for an additional 3 min at room temperature. The sample was centrifuged at 10 000 rpm for 10 min using a micro-centrifuge and the upper 500 μl of the aqueous phase was removed to a new tube before an equal volume of phenol : chloroform : isoamyl alcohol (25 : 24 : 1) was added, this was mixed well and centrifuged at 10 000 rpm for 10 min. The aqueous phase was taken off and moved into a new tube containing an equal volume of chloroform, this was spun under the same conditions and the aqueous phase transferred to a new tube. To this, 250 μl of isopropanol and 250 μl of 1.2 M sodium citrate was added, this was mixed, incubated for 2–3 min and centrifuged at 10 000 rpm for 10 min. The supernatant was removed and the pellet was washed with 1 mL of 70% ethanol, the pellet was dried in a sterile hood, the RNA was dissolved in 50 μl of sterile water and stored in the freezer (–20 or –80 °C) until further use.
cDNA synthesis
The cDNA was synthesized by reverse transcription reaction mixtures containing 2 μg of RNA samples that were treated with RNase-free DNase (Roche), Oligo(dT)18 1 μL, 5 × reaction buffer 4 μL, Ribolock™ RNase inhibitor (1 μL), 10 mM dNTP mix 2 μL, 200 U μL–1 reverse transcriptase 1 μL, and diethylpyrocarbonate water to a final volume of 20 μL. The reaction mixtures were incubated at 65 °C for 5 min. Then, reverse transcriptase was inactivated by incubation at 42 °C for 60 min, then 70 °C for 5 min, then cooled at 4 °C and stored at –20 °C. Finally, cDNA was generated using a RevertAid™ First Strand cDNA Synthesis Kit (Fermentas; Thermo Fisher Scientific, Bangalore, India).
Primers
The primers used in this study, such as 16S rRNA as a housekeeping gene (16S rRNA), Eap, SpA and Coa gene (Table 1) to understand the regulation of extracellular adherence protein, Ig binding surface protein and the enzyme responsible for independent staphylocoagulation in blood were evaluated using T-C@AgNPs at a concentration of 500 μg mL–1. The PCR was performed in a 0.2 ml tube in a volume of 25 μL, containing 1 μL of 80–100 ng of genomic DNA, 1 μL of both forward and reverse primers (20 pmoL each), 7 μL of DreamTaq Green PCR master mix (containing 0.25 mM each of dNTP, 2 mM MgCl2 and Taq DNA polymerase) procured from Thermo Fischer Scientific, India. The PCR was performed in a master gradient thermal cycler (LABNET, NJ, USA) using the following conditions: initial denaturation at 95 °C for 5 min; 30 cycles of denaturation for 30 s at 94 °C, annealing for 30 s at 56.6 °C, extension for 45 s at 72 °C and final extension for 2 min at 72 °C followed by cooling to 4 °C until the sample was recovered. Amplified PCR products were confirmed on 1% agarose gel and the image was captured in the gel documentation system (BioRad, India).
Table 1. In the present investigation all the primers are depicted and designated with annealing temperatures.
| Sl. no. | Gene/region name | Primer designation | 5′ → 3′ | Annealing temperature (°C) |
| 1 | 16S rRNA | 16S rRNA F | TGGTAGTCCACGCCCTAAAC | 56 |
| 16S rRNA R | CTGGAAAGTTCCGTGGATGT | |||
| 2 | Coa | Coa F | AAGATGGCACAGTATCATATGG | 58 |
| Coa R | GCCATATGTCGCAGTACC | |||
| 3 | SpA | SpA F | AGCACCAAAAGAGGAAGACAAC | 58 |
| SpA R | ATGTACTCCGTTGCCGTCTT | |||
| 4 | Bap | Bap F | CCCTATATCGAAGGTGTAGAATTGCAC | 62 |
| Bap R | GCTGTTGAAGTTAATACTGTACCTGC |
Toxicology study
Cell culture
The human triple negative breast cancer cells (MDA-MB-231) and peripheral blood mononuclear cell (PBMC) were purchased from the National Center for Cell Sciences (NCCS), Pune, India. The cancer cells were maintained in Dulbecco's modified Eagle's medium (DMEM) supplemented with 2 mM l-glutamine and balanced salt solution (BSS) adjusted to contain 1.5 g L–1 Na2CO3, 0.1 mM nonessential amino acids, 1 mM sodium pyruvate, 2 mM l-glutamine, 1.5 g L–1 glucose, 10 mM (4-(2-hydroxyethyl)-1-piperazineethane sulfonic acid) (HEPES) and 10% fetal bovine serum (GIBCO, USA). Penicillin and streptomycin (100 IU/100 μg) were adjusted to 1 mL L–1. The cells were maintained at 37 °C with 5% CO2 in a humidified CO2 incubator.
Evaluation of cytotoxicity
The inhibitory concentration (IC50) value was evaluated using an MTT [3-(4,5-dimethylthiazol-2-yl)-2,5-diphenyltetrazolium bromide] assay.12 Cancer cells were grown (1 × 10 4 cells per well) in a 96-well plate for 48 h to 75% confluence. The medium was replaced with fresh medium containing serially diluted synthesized compounds, and the cells were further incubated for 48 h. The culture medium was removed, and 100 μL of the MTT [3-(4,5-dimethylthiozol-2-yl)-3,5-diphenyl tetrazolium bromide] (Hi-Media, Mumbai, India) solution was added to each well and incubated at 37 °C for 4 h. After removal of the supernatant, 50 μL of DMSO was added to each of the wells and incubated for 10 min to solubilize the formazan crystals. The optical density was measured at 620 nm in an ELISA multi-well plate reader (Thermo Multiskan EX, USA). The OD value was used to calculate the percentage of viability using the following formula.
Molecular docking studies
Molecular docking protocol was followed according to Kameshwar et al.13 Briefly, the structural drawing and geometry cleaning of novel potential leads A and B were performed in Maestro 9.3 of the Schrodinger suite 2012 platform and then subjected to other parameters, namely, energy minimization using OPLS 2005 force field, addition of hydrogen atoms, neutralization of charged groups, generation of ionization states and set pH 7.5 using Epik. Generation of tautomers and stereoisomers of 32 per ligand, low-energy ring conformations and optimization of the geometries followed by low energy ring conformation generation per ligand were computed, optimized by LigPrep and used for molecular docking.
The co-ordinates of oxidoreductase from Escherichia coli, DNA gyrase complex with ciprofloxacin and DNA from S. aureus, VEGFR2 in complex with a 2-anilino-5-aryl-oxazole inhibitor, EGFR kinase domain in complex with iressa and complex of Rad18 (Rad6 binding domain) with Rad6b were obtained from the Brookhaven Protein Data Bank, whose PDB IDs are ; 1MBT, ; 2XCT, ; 1Y6A, ; 2ITY and ; 2YBF respectively. The crystal structure was imported and refined by a multistep process through the protein preparation wizard of Maestro 9.3, which includes energy minimization using a OPLS-2005 force field, correct bond orders were assigned, hydrogen atoms were added and the water molecules removed beyond 5 Å from the hetero atom, formal charges, amide groups of Asn and Gln were optimized. All amino acid flips were assigned to correct geometry and hydrogen bonds were optimized. Using PROPKA, pH was fixed and optimized to 7.5. Non-hydrogen atoms were minimized by restrained minimization to default RMSD to 0.3 Å. Using extra-precision (XP) docking and scoring each compound was docked into the receptor grid of radii 30 × 30 × 30 Å and the docking calculation were judged based on the Glide score.
Results
Synthesis and characterization of T-C@AgNPs
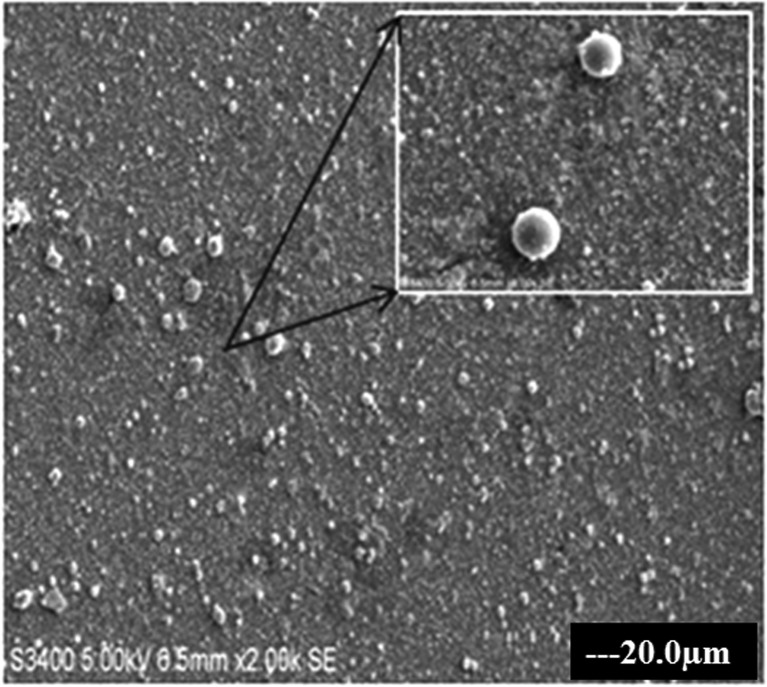
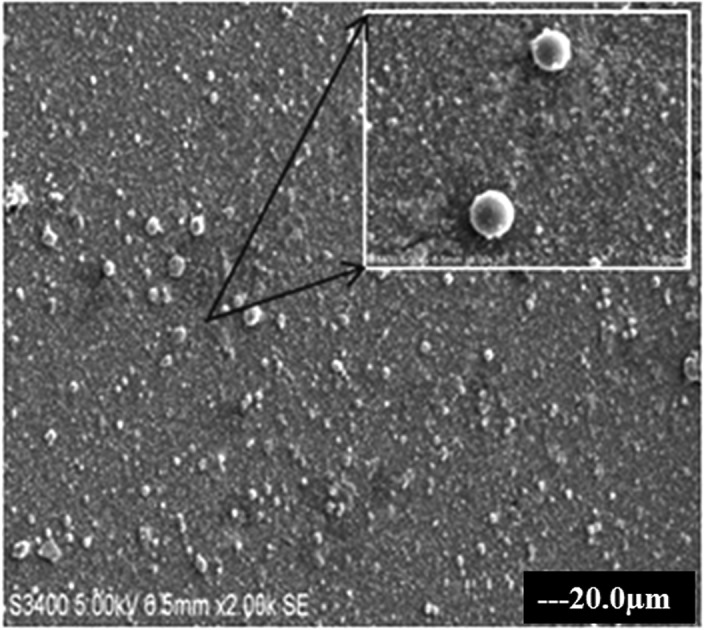
The T-C@AgNPs were synthesized and characterized in our previous study and showed a color changes from clear yellow to muddy brown during stepwise synthesis of T-C@AgNPs, which were also confirmed by UV-visible spectrophotometer by showing absorption maxima at 490 nm. The T-C@AgNPs showed very good stability in water, and were monodispersive in nature with a spherical shape (Fig. 1), being 28.94 nm in size, and demonstrating good conductivity.
Fig. 1. The SEM image of T-C@AgNPs. The T-C@AgNPs were synthesized and analyzed to determine the shape of NPs by SEM. The T-C@AgNPs were spherical in shape and monodispersive in nature in a colloidal state.
Biocidal activity of T-C@AgNPs against Bap-MRSA 090 and E. coli
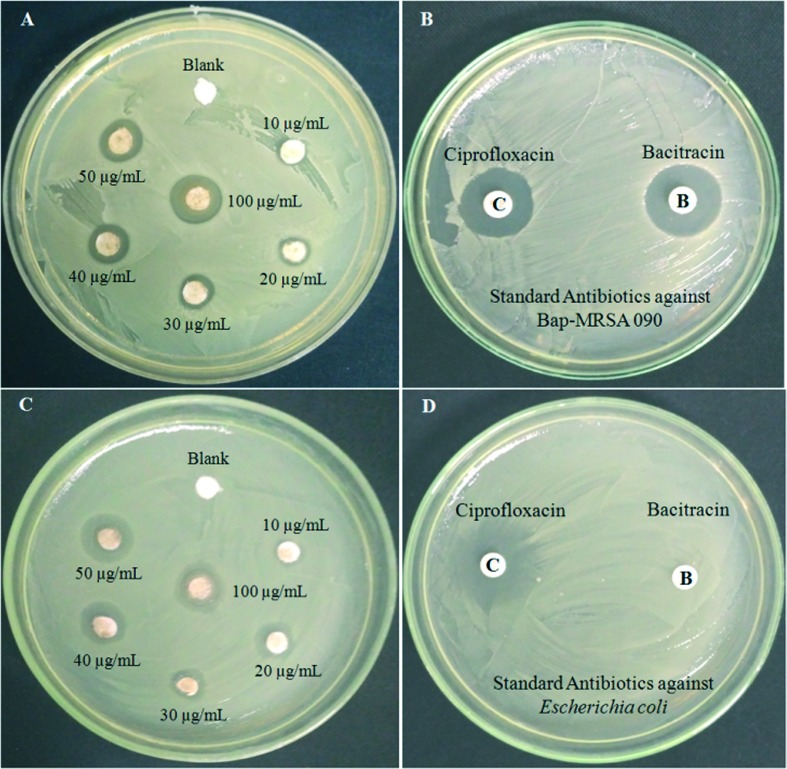
The T-C@AgNPs were assessed for antibacterial activity against Bap-MRSA 090 using the disc diffusion method, they showed significant dose dependent biocidal activity. Different concentrations from 10, 25, 50, 100, 200 and 250 μg mL–1 were tested and showed a 10.08 ± 0.06 mm zone of inhibition (ZOI) at μg mL–1 concentrations compared to standard antibiotic ciprofloxcin (10 μg) that had 10.95 ± 0.08 mm ZOI. The T-C@AgNPs also showed a potent nature against E. coli, and had a great action of 9.16 ± 0.06 mm ZOI at 100 μg mL–1 as MIC compared to ciprofloxcin (10 μg = 11.18 ± 0.04 mm). There was no ZOI observed for the negative control (sterile distilled water). This showed that the loading of thymol to CS nanoparticles using the nanotechnology approach exhibited this significant activity compared to others (Fig. 2). The antibacterial effects of CS in the present investigation have been attributed to an electrostatic interaction between the protonated amino groups of CS and the phosphoryl groups and lipopolysaccharides of bacterial cell membranes, which destroys the membrane and releases the cellular contents. These interesting characteristics of CS in T-C@AgNPs further aid the delivery of loaded thymol containing CS, and their effect against infectious diseases was definable.
Fig. 2. Antimicrobial activity of T-CAgNPs against Bap-MRSA 090 and E. coli. The Bap-MRSA 090 evaluated for biocidal activity by T-CAgNPs is shown in a dose-dependent manner (10 to 100 μg mL–1) compared to antibiotics ciprofloxcin and bacitracin. The minimum inhibitory concentration (MIC) 100 μg mL–1 of T-C@AgNPs was 10.08 ± 0.06 mm against Bap-MRSA 090 along with standard ciprofloxcin (10.95 ± 0.08) and bacitracin (9.12 ± 0.13) as an antibiotic, respectively (A and B). The T-C@AgNPs showed excellent activity to E. coli at MIC and had 9.16 ± 0.06 mm compared to ciprofloxcin (10 μg = 11.18 ± 0.04 mm) and E. coli resistant to bacitracin can be observed clearly in figure C and D. Whereas blank water served as a negative control depicted in the picture (A and C).
Membrane pore and bioelectrical changes at the site of the electron transport chain
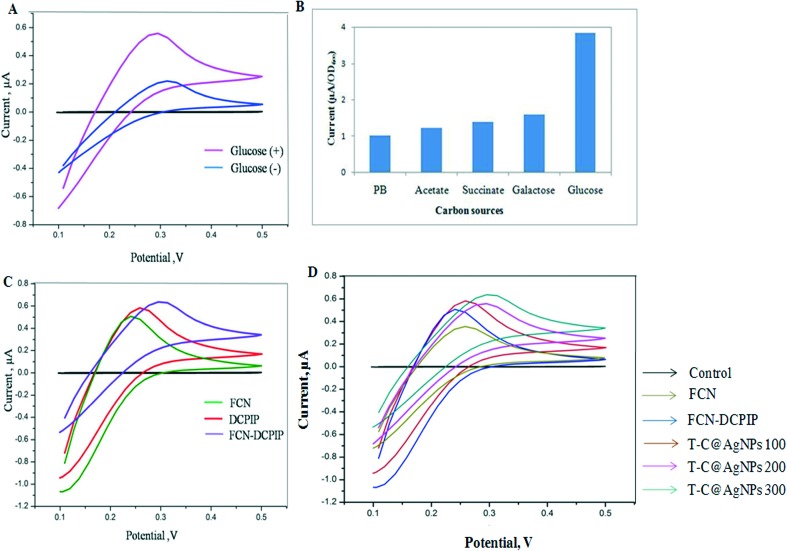
In the present investigation, the formation of membrane pore/damage by T-C@AgNPs leads to changes in the bioelectrochemistry of the Bap-MRSA 090. Inactive cells are not involved in the electron transport chain and metabolism activation in bacteria is helped by electron transfer to DCPIP with the help of glucose as a suitable carbon source, as used in the present study (Fig. 3A–D).
Fig. 3. Cyclic voltammogram (CV) analysis. The CV of cell suspension of Bap-MRSA 090 in FCN in the absence (–) and presence (+) of glucose (10 g L–1) (A) Bap-MRSA 090 response to different carbon sources; (B) and CV studied at 1 mM FCN, 40 μM DCPIP and combination in PB at pH 7.0; (C) and the effect of T-C@AgNPs at 100, 200 and 300 μg mL–1 concentration in presence of FCN affecting the Bap-MRSA 090 CV was represented. (D) All CV measurements were conducted after incubation of Bap-MRSA 090 suspension (0.5 OD at A600 nm).
According to CV signals with different intervals of time, FCN alone showed no significant electrochemical signal response (0.2426 μA at 0.4924 V) and failed to show bacterial respiration connections in the electrode system in the first case (Fig. 3A), but glucose was an excellent carbon source, as designated for the experiment (Fig. 3B). In the second case, DCPIP alone leads to generation of a low oxidation peak indicating the weak wiring of Bap-MRSA 090 with the electrode taking place (0.2568 μA at 0.5749 V). However, in the case of the DCPIP-FCN double mediator assay, a significant oxidation peak was seen by raising the current to 0.2663 μA at 0.3454 V only (Fig. 3C). With this in mind, we used T-C@AgNPs as a perfect example of the effect against Bap-MRSA 090 in presence of FCN alone. The results showed a significant increase in the current by transferring electrons from the intracellular to extracellular matrix followed by exchanging electrons to FCN to reach the electrode efficiently in a dose dependent 100 μg mL–1 (0.2766 μA at 0.4514 V), 200 μg mL–1 (0.2918 μA at 0.5558 V) and 300 μg mL–1 (0.2931 μA at 0.6322 V) manner (Fig. 3D). In this way T-C@AgNPs impels the bioelectrical changes attributed by transporting electrons efficiently from the intra membrane space to outside the cell by forming pores to Bap-MRSA 090.
Membrane damage of Bap-MRSA 090
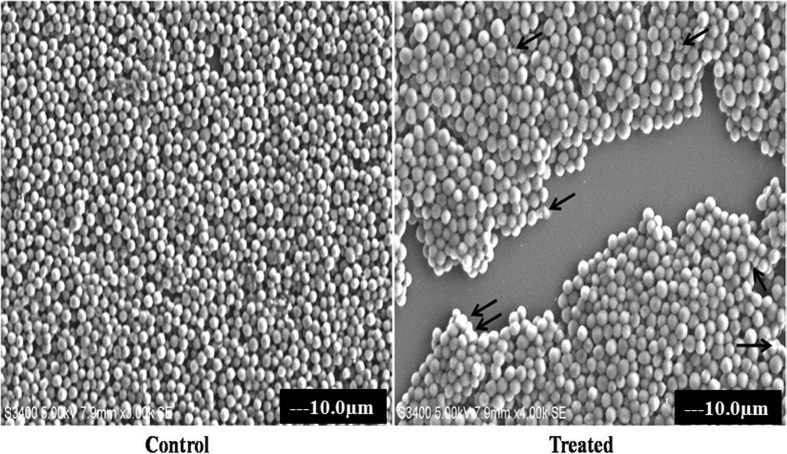
The biocidal action of T-C@AgNPs against Bap-MRSA 090 was evaluated by SEM analysis and showed damage to the membrane of the bacterial cell at MIC concentration of NPs after 24 h incubation, compared to the control (untreated) (Fig. 4). This highlights the action of thymol on chitosan nanoparticles involved in the destabilization of bacterial membrane.
Fig. 4. The membrane damaging effect of T-C@AgNPs. The MIC of T-C@AgNPs treated with Bap-MRSA 090 showed alterations in the cell membrane and shrinkage, clumping of the damaged cells was observed shown by the arrow in the treated compared to control.
Effect of T-C@AgNPs on Bap-MRSA 090 biofilm
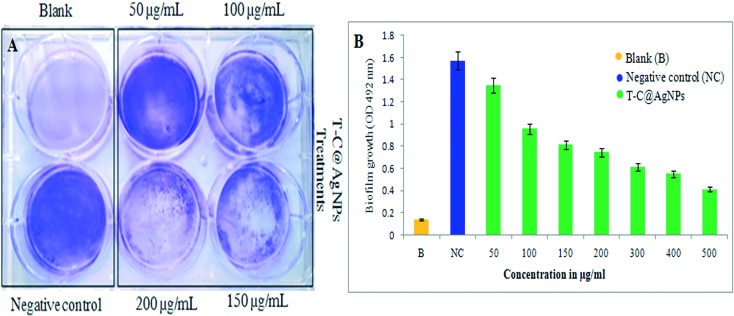
The six-well polystyrene microtiter plate was examined for Bap-MRSA 090 adherence using the crystal violet method and showed T-C@AgNPs efficiently inhibited the growth of the bacteria. As the dose increased (50 to 500 μg mL–1 concentration), the inhibition is also elevated, supporting the use of the T-C@AgNPs. The promising action of T-C@AgNPs was represented at a lower dose of 200 μg ml–1 concentration when compared to the positive control (Fig. 5A). The percentage of inhibition of biofilm at 52.60% and 73.79% at 200 and 500 μg ml–1 concentrations, respectively, when compared to the negative control is shown in Fig. 5B.
Fig. 5. The qualitative and quantitative determination of effect of T-C@AgNPs on S. aureus biofilm. Bap-MRSA 090 treated with different concentrations (50–500 μg mL–1) of T-C@AgNPs for 24 h compared to blank and negative control in the experiment, then using the crystal violet method. The reading was measured at 492 nm to understand the role in biofilm development. The inhibition by T-C@AgNPs is shown at 200 μg mL–1 concentrations for the inhibition of Bap-MRSA 090 biofilm effectively (A) and a dose dependent decrease of biofilm formation by Bap-MRSA 090 was observed quantitatively (B).
Gene regulation study
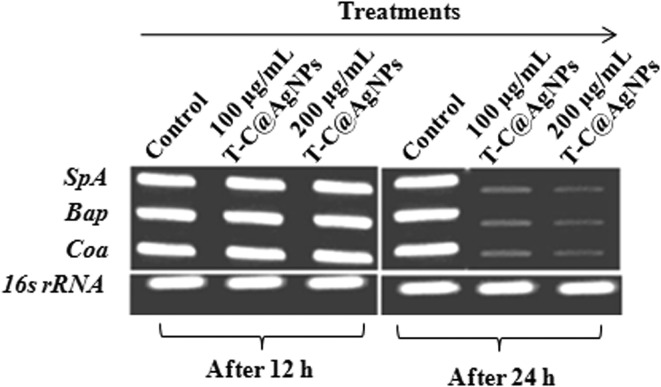
The T-C@AgNPs showed antimicrobial and biocompatible properties in the present investigation. These remarkable results prompted us to tackle the role, if any, of T-C@AgNPs on the regulation of Coa, Eap and SpA gene expression. We hypothesized that the T-C@AgNPs effectively affected the transcription of the Coa, Eap and SpA genes. Attended PCR confirms the designed primers specific for Bap-MRSA 090 and semi-quantitative PCR results confirmed the down regulation of the Coa, Eap and SpA exoprotein genes transcription at 500 μg mL–1 concentration after 48 h treatment, compared to the housekeeping gene 16S rDNA control and treatment (Fig. 6). This indicates the significant inhibition of one of the most important virulence factors in Bap-MRSA 090 during food poisoning and serious infections such as bacteremia, without altering the blood homeostasis environment and was confirmed in the present and previous study. From this finding we presume that, the reduction of staphylococcal coagulation cascade by the Coa gene, immunoglobulin G (IgG) binding responsible SpA gene and one surface virulence factors for biofilm production responsible Bap gene was repressed due to T-C@AgNPs and can be observed clearly (Fig. 6).
Fig. 6. Effect of T-C@AgNPs in regulation of clotting responsible coagulase (Coa), biofilm associated protein (Bap) and surface Ig binding protein (SpA) genes. The gene regulation of Bap-MRSA 090 was carried out at 50 to 300 μg mL–1 concentrations. The T-C@AgNPs treatment against Bap-MRSA 090 gene regulation at 24 h for 200 μg mL–1 concentration exhibited a profound action against Bap-MRSA 090 gene regulation and was seen by relative expression of genes (Coa, Bap and SpA) compared to the housekeeping 16S rRNA gene. This indicates the T-C@AgNPs exactly matches the MIC.
Toxicity and anti-cancer activity of T-C@AgNPs
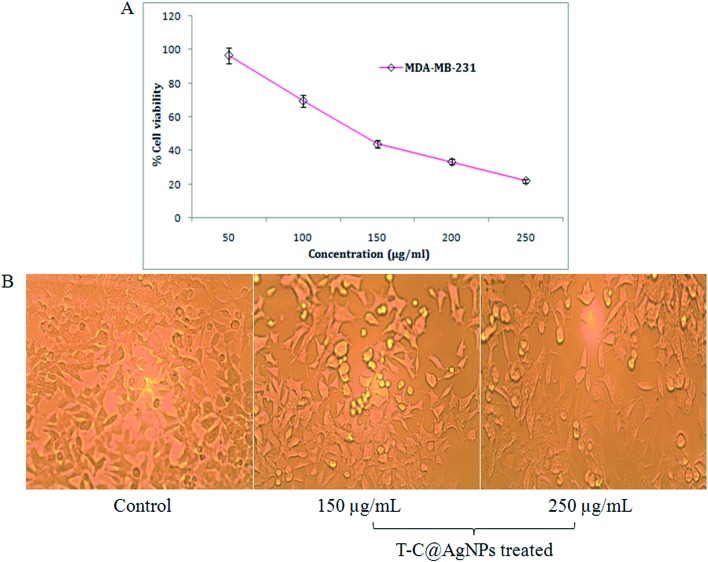
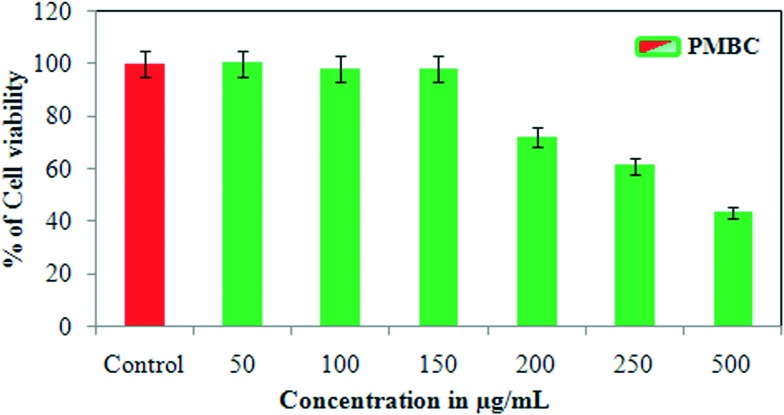
In the present investigation, an MTT cytotoxicity assay was studied using T-C@AgNPs at different concentrations to understand the anti-proliferative effect of T-C@AgNPs on MDA-MB-231 cell lines. The investigated results show that both T-C@AgNPs significantly inhibited the proliferation of the breast cancer cell line MDA-MB-231 and showed an IC50 value of 110 ± 1.0 μg mL–1 compared to the standard drug Doxorubicin (IC50 = 19 ± 1.0 μg mL–1) (Fig. 7A), this is observed under microscopy for cell morphology (Fig. 7B) and compared to the control (untreated). However, it did not show remarkable effect towards normal cells, PBMCs had an IC50 value of 221 ± 0.71 μg mL–1 (Fig. 8). As such, the T-C@AgNPs appears to be absorbed more strongly by cancer cells than normal cells, as observed in the present investigations. It seems that T-C@AgNPs make the specific targeting of NPs to tumor cells possible, which leads to less toxic effects on non-cancerous cells. On the other hand, the proposed dose of T-C@AgNPs (IC50 = 221 ± 0.71 μg mL–1) is not toxic enough for normal PBMC cells to die. Therefore, further tuning is needed for specificity generated by the thymol coating on the CS, which could make the T-C@AgNPs a suitable candidate to be used in cancer chemotherapy.
Fig. 7. Anti-cancer analysis of T-C@AgNPs. (A) The MDA-MB-231 cell line was treated with different concentrations of T-C@AgNPs (50, 100, 150, 200, and 250 μg mL–1). The cell viability was measured using the MTT method and reported at concentration 110 ± 1.0 μg mL–1, which is the IC50 against the MDA-MB-231 cell line and concluded that the T-C@AgNPs had anti-cancer activity compared to the standard drug Doxorubicin (IC50 = 19 ± 1.0 μg mL–1). (B) The MDA-MB-231 cell line morphology after treatment of T-C@AgNPs at 150 and 250 μg mL–1 concentrations, compared to control.
Fig. 8. Cytotoxicity analysis of T-C@AgNPs. The PBMC cell was treated with different concentrations of T-C@AgNPs (50, 100, 150, 200, 250, and 500 μg mL–1). The cell viability was measured using the MTT method and reported at concentration 221 ± 0.71 μg mL–1, which is the IC50 against PBMC cell and concluded that the T-C@AgNPs had no toxicity to the PBMC normal cells up to 221 μg mL–1 concentrations.
Molecular docking
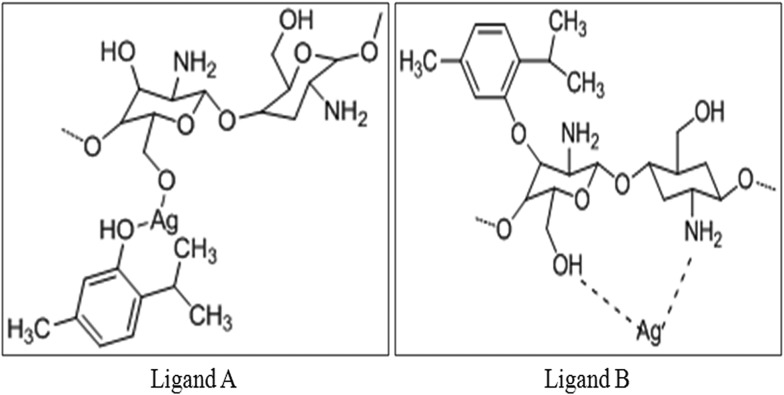
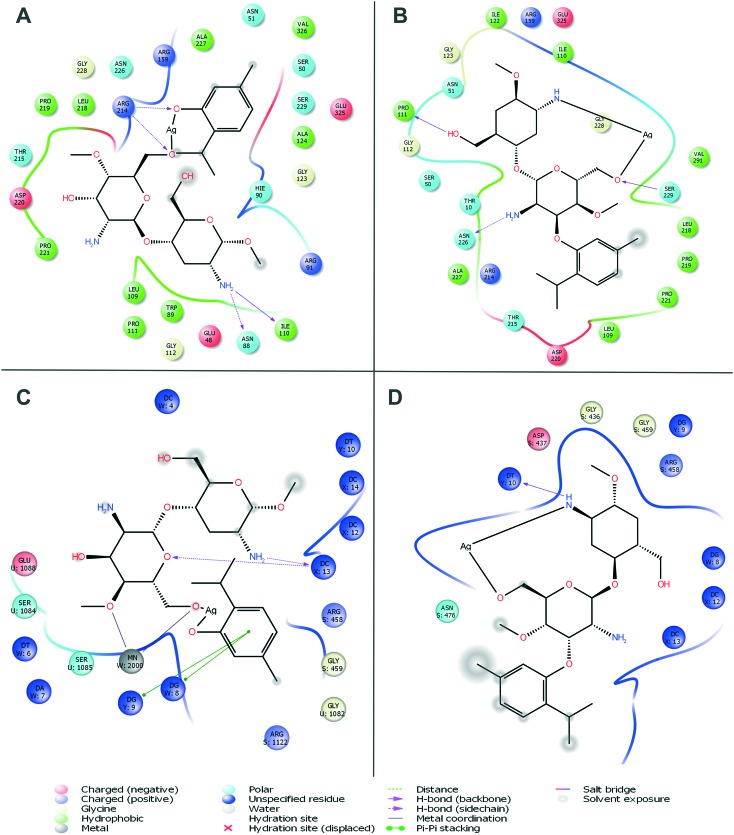
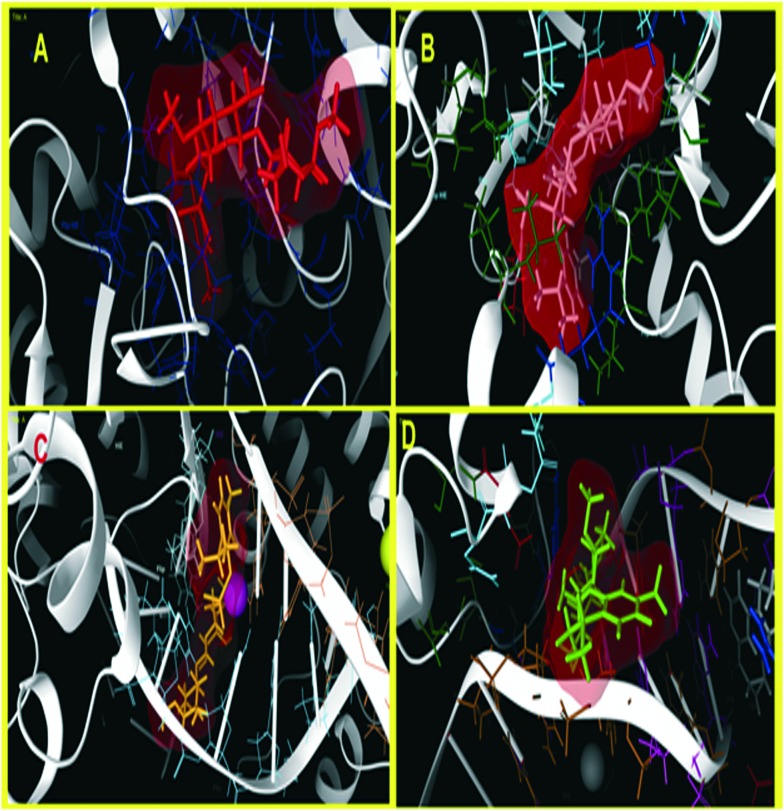
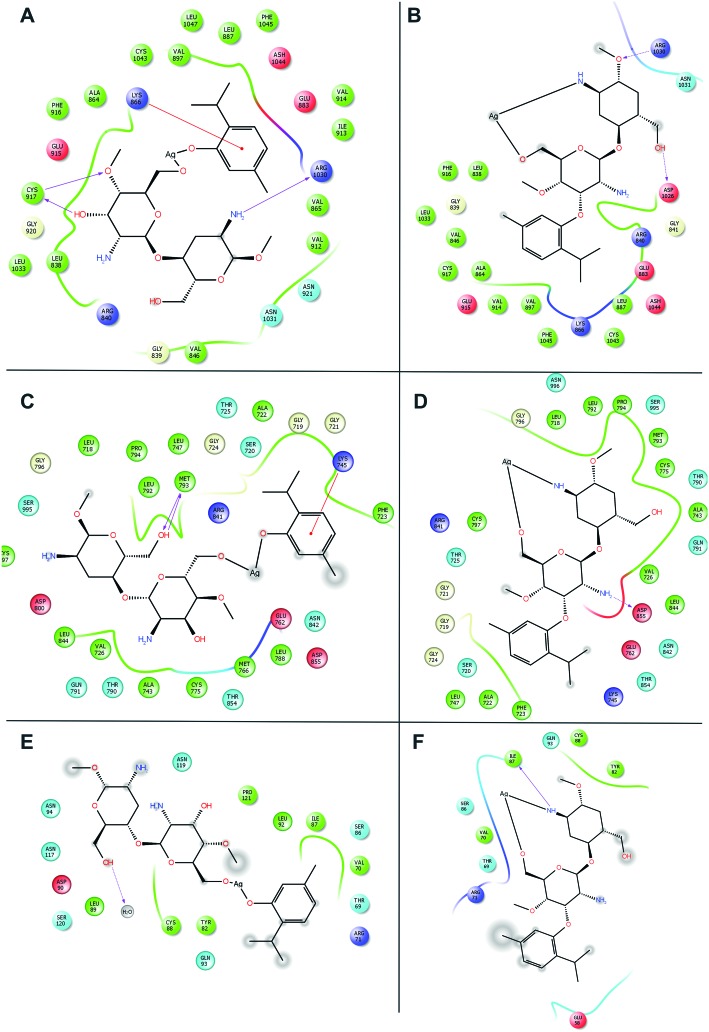
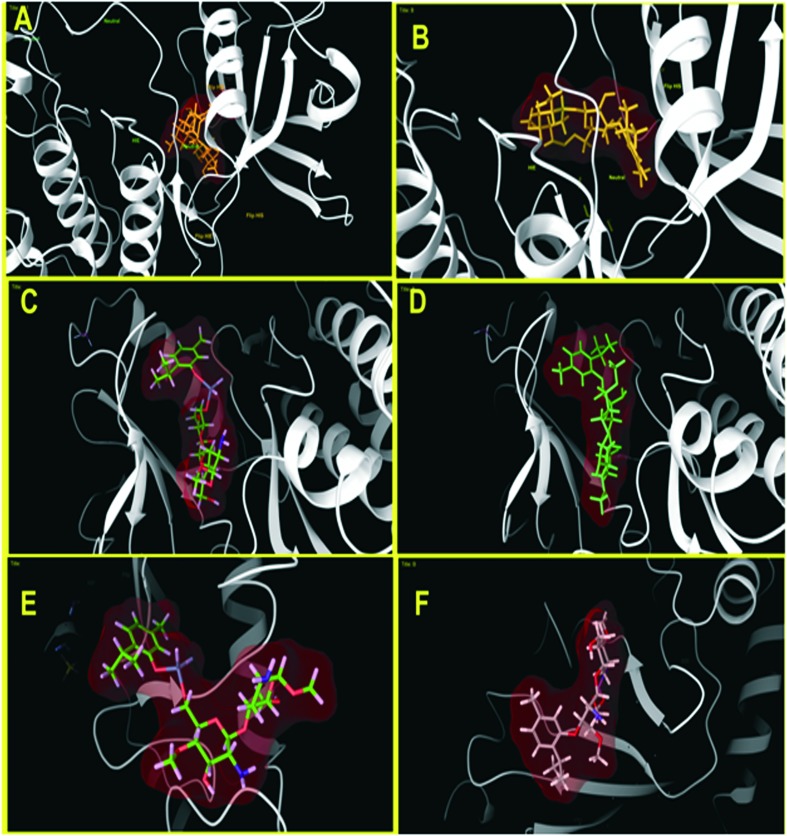
Molecular docking was carried out for the novel potential leads A and B (Fig. 9). Docking results induced comparative investigation based on Glide score and best docking posed results of 2D and 3D results were represented. The molecular docking study of ligand A showed hydrogen bonding with Arg214, Asn88 and Ile110 (Fig. 10A and 11A), and that ligand B (Fig. 10B and 11B) forms hydrogen bond with Pro111, Asn226 and Ser229 against oxidoreductase from E. coli respectively. Ligand A occupied the active site of DNA gyrase (Fig. 10C and 11C) interacting with guanine it forms π–π stacking, with cytosine it forms a hydrogen bond and ligand B forms a hydrogen bond with thymine (Fig. 10D and 11D). These results suggest that ligand A has comparatively strong bonding with oxidoreductase and DNA gyrase than with ligand B, thus ligand A occupies the most favorable orientation in representing antibacterial properties. Ligand A imparted strong hydrogen bonding with Cys917, Arg1030 and a salt bridge with Lys866 (Fig. 12A and 13A) whereas ligand B forms a hydrogen bond with Arg1030 against VEGFR2 (Fig. 12B and 13B). Ligand A forms a hydrogen bond with Met793 and a salt bridge with Lys745 against EGFR (Fig. 12C and 13C), and ligand B forms a hydrogen bond with Asp855 against EGFR (Fig. 12D and 13D). While the Rad18 forms a favorable interaction with ligand A (Fig. 12E and 13E) and ligand B (Fig. 12F and 13F). These results suggest that ligand A could be good anticancer molecule. Based on the XP glide score, ligand A showed a promising scoring function, when compared to other structurally related compounds as tabulated in Table 2.
Fig. 9. The proposed structural arrangement of T-C@AgNPs in two different configurations by sharing functional groups.
Fig. 10. Molecular docking interactive maps of ligand A (A) and ligand B (B) against oxidoreductase from Escherichia coli. Whereas with DNA Gyrase, ligand A (C) and ligand B (D) show a best pose residing at the active site wherein the DNA gyrase is binding with DNA.
Fig. 11. Three dimensional molecular interaction of ligand A (A) and ligand B (B) against oxidoreductase from E. coli, whereas with DNA Gyrase, ligand A (C) and ligand B (D) show a best pose residing at the active site, wherein the DNA gyrase is binding with DNA (ligands are represented in an enclosed surface displayed as red in color).
Fig. 12. Molecular docking interactive maps of ligand A (A) and ligand B (B) against VEGFR2. Whereas with EGFR kinase, ligand A (C) and ligand B (D) show best pose. While with Rad18, ligand A (E) and ligand B (F) form a better orientation with the Rab18 active site.
Fig. 13. Three dimensional molecular interaction of ligand A (A) and ligand B (B) against VEGFR2. Whereas with EGFR kinase, ligand A (C) and ligand B (D) show best pose. While with Rad18, ligand A (E) and ligand B (F) form a better orientation with the Rab18 active site (ligands are represented in an enclosed surface displayed as red in color).
Table 2. The designed novel nanoparticle was used for molecular docking studies and best docking scores of the ligands A and B are presented.
| PDB | Ligand | XP GScore | Glide evdw | Glide ecoul | Glide energy |
| 1MBT | A | –6.002 | –45.282 | –7.838 | –53.121 |
| B | –6.914 | –37.405 | –3.811 | –41.216 | |
| 2XCT | A | –7.243 | –80.123 | –2.432 | –65.990 |
| B | –4.499 | –34.541 | –1.489 | –33.051 | |
| 1Y6A | A | –8.670 | –21.908 | –7.925 | –29.833 |
| B | –4.613 | –32.925 | –4.923 | –37.848 | |
| 2ITY | A | –8.142 | –38.879 | –14.404 | –53.283 |
| B | –6.277 | –38.072 | –10.062 | –48.134 | |
| 2YBF | A | –4.422 | –28.954 | –6.352 | –35.303 |
| B | –3.101 | –25.343 | –2.241 | –27.585 |
Discussion
Natural sources have the potential to reduce metal ions into metal nanoparticles. Silver nanoparticles (AgNPs) were used in various applications such as catalytic, electrical conducting and antimicrobial activity. The size, shape and surface morphology of nanoparticles plays a vital role in controlling the physical and chemical properties. The synthesis of metal nanoparticles by the chemical reduction method is often performed in the presence of a stabilizing agent to prevent the unwanted agglomeration of colloids. Furthermore, the chemically synthesized metal nanoparticles are expensive, hazardous to environment and require high energy consumption.14 The synthesized T-C@AgNPs showed excellent physical properties, which correlated to promising biocidal activity against multiple perilous pathogens.1 The increasing importance of polymer coated nanomaterials from biological polymer sources has put CS in the spotlight, particularly due to their biological properties, which have been utilized in many engineering and biological fields. Chitosan is a biopolymer found to have distinguishing properties such as biodegradability and biocompatibility.15 Thymol is known to be a component of the essential oil prepared from the herb thyme (Thymus vulgaris) which is formed via p-cymene from γ-terpinene.16 Thymol is also known to reduce bacterial resistance to common drugs such as penicillin and have inducing antibiotic susceptibility capabilities in drug-resistant pathogens. Different polymer matrices, such as polypropylene (PP) and bio-based materials, such as caseinates, soya proteins and pectins have been proposed as adequate supporters for thymol in active systems.17 Likewise the present study highlights the loading of the active bactericidal thymol into T-C@AgNPs as also playing a potent role in inhibiting the growth of the Bap-MRSA 090 in accordance with the work by Bhakya et al.18 and Manukumar et al.1 It has been proposed that T-C@AgNPs has the ability to attach to the bacterial cell membrane causing structural changes in its membrane leading to the formation of ‘pits’ where they accumulate. In the study, T-C@AgNPs proved its ability to act against Bap-MRSA 090 and broad bacterial agents were confirmed,1 which interact with the thiol groups of many enzymes, thus inactivating most of the respiratory chain enzymes leading to the formation of reactive oxygen species (ROS) which causes the self-destruction of the bacterial cell.19
The absence of porins in S. aureus is very important to the use of an artificial electron shuttle to study the bioelectrochemistry of S. aureus.20 Interestingly in the present study, molecular evidence was explored for T-C@AgNPs by deducing an insight into the physiological state of the Bap-MRSA 090 by studying a change in the intracellular redox activities. Bioelectrochemistry evidence of Bap-MRSA 090 defined as the unaltered peak height was observed in the presence of metabolically inactive cell suspensions and consequently the electrochemical response peak observed when treating metabolically inactive cells by 10 g L–1 of glucose.21,22
The biofilm was composed of macromolecules such as exopolysaccharides, proteins, and DNA. The important exopolysaccharide is a polymer of poly-N-acetyl-β-(1–6)-glucosamine, called PIA or poly-N-acetylglucosamine (PNAG), which is dependent on the synthesized enzymes encoded by the icaADBC operon. Even though PIA/PNAG is part of biofilm matrix it is not important, but these proteins take responsibility for mediating cell to cell interactions by forming biofilm and multicellular behavior. Bap is one of the large cell-wall associated proteins used to mediate initial attachment to abiotic surfaces and intercellular adhesion.23,24 In the present investigation it should be highlighted that the T-C@AgNPs effectively reduced the attachment of Bap-MRSA 090 at the concentration of 200 μg mL–1.
When NPs enter the blood and come into contact with RBCs, the stability and biocompatibility of NPs are important prerequisites for their application in a biological domain under these conditions.25,26 The blood coagulation cascade is a tightly regulated pathway involving several coagulation factors with and without proteolytic activity. Coagulation is a stepwise activation of several factors, which results in the conversion of fibrinogen to fibrin through the action of thrombin, facilitating the rapid response of the body to injury.27 The staphylococcal SpA, Eap and Coa are major virulence determinants. They can potentially impact methicillin-resistant S. aureus (Bap-MRSA 090) persistence in such infections via its influence on biofilm formation. Loss-of-function display significantly decreased in SpA, Eap and Coa indicates the binding and coagulation mechanism was decreased slowly in vitro. Interestingly, Bap-MRSA 090 exposure to sub-MICs of T-C@AgNPs significantly inhibited gene expression in attachment and coagulation effectively in the present study. This confers the suppression of virulence factors of Bap-MRSA 090 involved in food poisoning and bacteremia in humans. From the present investigation the role of T-C@AgNPs in Bap-MRSA 090 gene regulation by protecting infection was hypothesized and clearly validated.
For the first time T-C@AgNPs were assessed for dose-dependent cytotoxic effects against MDA-MB-231 cell lines, and showed prominent inhibition and less toxic effect against normal PBMCs. According to earlier reports by Tiruppathi et al.,28 Frei29 and Azizi et al.,30 the synthesized SNP coated with albumin showed a dose dependent anti-proliferative effect towards MCF-7 and MDA-MB-231 cell lines, compare to normal cells. In accordance with the above reports, the non-toxic nature of CS and the FDA approved, thymol was loaded for the first time in the previous investigation by our group.1 Even though T-C@AgNPs showed less potency to MDA-MB-231 cell lines, for the first time the current research showed that the uptake of T-C@AgNPs by cancer cells is specific and no toxicity was demonstrated against normal cell PBMC up to 500 μg mL–1 concentrations. Therefore, T-C@AgNPs could be an excellent candidate to be used in chemotherapy, after suggested further tuning of the design.
Many plants have long been a very important source of drugs and many plants have been screened as to whether they contain compounds with therapeutic activity.31 Plants such as Origanum vulgare, Curcuma longa, Cinnamomum, and Thymus vulgaris etc., contain active molecules such as carvacrol, curcuminm, cinnamaldehyde and thymol, respectively, which have been reported in many applications. Apart from this, many plants are rich in antioxidants involved in RSA by neutralizing ROS and also acting as antimicrobials, anthelmintics, anti-inflammatories, anti-diabetic agents and as anti-thrombins etc.32–47 Therefore, the present study used the FDA approved thymol molecule for the development of promising T-C@AgNPs against Bap-MRSA 090, E. coli, toxicity, and anticancer activity. Now it is a prerequisite to study and validate the in vitro results to the in silico molecular docking study to use further developed nanoparticles for medicinal applications. The present investigation evaluated, for the first time, the use of T-C@AgNPs against E. coli, and Bap-MRSA 090. The anticancer activity was compared and validated by best pose scoring and suggested promising applications of T-C@AgNPs in the future.
Conclusions
The synthesized T-C@AgNPs had promising biocidal action against perilous pathogens and showed excellent action against Bap-MRSA 090 in the present study. The evaluated T-C@AgNPs act as an anti-biofilm candidate by inhibiting the biofilm formation. The toxicity was reduced towards normal PBMC cells and anticancer activity against MDA-MB-231 cell lines. The in vitro results were validated by best pose scoring in in silico molecular docking studies for thymol for the first time. However, several scientific reports manifested that lead-drug discovery projects on the basis of binding efficiency indices would afford bioactive compounds with better pharmacokinetic outcomes. Hence, the validated thymol bioactive compound in T-C@AgNPs should be employed for establishing more rational structural activity relationships in the era of antimicrobial drug development.
Disclosure statement
The authors declare no competing financial interest. The authors alone are responsible for the content and writing of this article.
Conflicts of interest
The authors declare no competing interests.
Acknowledgments
The authors H. M. Manukumar and S. Umesha greatly acknowledge financial assistance from the Department of Biotechnology (DBT), Ministry of Science and Technology, Government of India, grant number BT/PR10338/PFN/20/922/2013, New Delhi, India. We also thank the Institution of Excellence (IOE) at University of Mysore for providing the instrumentation facility.
References
- Manukumar H. M., Umesha S., Kumar H. N. Int. J. Biol. Macromol. 2017;102:1257–1265. doi: 10.1016/j.ijbiomac.2017.05.030. [DOI] [PubMed] [Google Scholar]
- Sharma D., Kanchi S., Bisetty K. Arabian J. Chem. 2015 doi: 10.1016/j.arabjc.2015.11.002. [DOI] [Google Scholar]
- Ramezani Ali Akbari K., Abdi Ali A. Nanomed. J. 2017;4(1):37–43. [Google Scholar]
- Shi S. F., Jia J. F., Guo X. K., Zhao Y. P., Chen D. S., Guo Y. Y., Zhang X. L. Int. J. Nanomed. 2017;11:6499–6506. doi: 10.2147/IJN.S41371. [DOI] [PMC free article] [PubMed] [Google Scholar]
- Jian W., Zhang L., Siu K. C., Song A., Wu J. Y. Molecules. 2016;22(1):50–62. doi: 10.3390/molecules22010050. [DOI] [PMC free article] [PubMed] [Google Scholar]
- Zhang Y., Niu Y., Luo Y., Ge M., Yang T., Yu L. L., Wang Q. Food Chem. 2014;142:269–275. doi: 10.1016/j.foodchem.2013.07.058. [DOI] [PubMed] [Google Scholar]
- Lambert R. J. W., Skandamis P. N., Coote P. J., Nychas G. J. J. Appl. Microbiol. 2001;91(3):453–462. doi: 10.1046/j.1365-2672.2001.01428.x. [DOI] [PubMed] [Google Scholar]
- Pasco N., Baronian K., Jeffries C., Hay J. Appl. Microbiol. Biotechnol. 2000;53(5):613–618. doi: 10.1007/s002530051666. [DOI] [PubMed] [Google Scholar]
- Rawson F. J., Gross A. J., Garrett D. J., Downard A. J., Baronian K. H. Electrochem. Commun. 2012;15(1):85–87. [Google Scholar]
- Di Pasqua R., Betts G., Hoskins N., Edwards M., Ercolini D., Mauriello G. J. Agric. Food Chem. 2007;55(12):4863–4870. doi: 10.1021/jf0636465. [DOI] [PubMed] [Google Scholar]
- dos Santos Rodrigues J. B., de Carvalho R. J., de Souza N. T., de Sousa Oliveira K., Franco O. L., Schaffner D. Food Control. 2017;73:1237–1246. [Google Scholar]
- Mosmann T., Immunol J. Methods. 1983;65(1):55–63. doi: 10.1016/0022-1759(83)90303-4. [DOI] [PubMed] [Google Scholar]
- Kameshwar V. H., Kumar J. R., Priya B. S., Swamy S. N. Mol. Cell. Biochem. 2017;426(1):161–175. doi: 10.1007/s11010-016-2888-6. [DOI] [PubMed] [Google Scholar]
- Prakash S., Chakrabarty T., Singh A. K., Shahi V. K. Biosens. Bioelectron. 2013;41:43–53. doi: 10.1016/j.bios.2012.09.031. [DOI] [PubMed] [Google Scholar]
- Kumar S., Henry L. J. K., Natesan S., Kandasamy R. Carbohydr. Polym. 2017;157:1677–1686. doi: 10.1016/j.carbpol.2016.11.049. [DOI] [PubMed] [Google Scholar]
- Li K. K., Yin S. W., Yang X. Q., Tang C. H., Wei Z. H. J. Agric. Food Chem. 2012;60(46):11592–11600. doi: 10.1021/jf302752v. [DOI] [PubMed] [Google Scholar]
- Ramos M., Fortunati E., Peltzer M., Dominici F., Jiménez A., del Carmen Garrigos M., Kenny J. M. Polym. Degrad. Stab. 2014;108:158–165. [Google Scholar]
- Bhakya S., Muthukrishnan S., Sukumaran M., Muthukumar M. Appl. Nanosci. 2016;6(5):755–766. [Google Scholar]
- Nayak D., Pradhan S., Ashe S., Rauta P. R., Nayak B., Colloid J. Interface Sci. 2015;457:329–338. doi: 10.1016/j.jcis.2015.07.012. [DOI] [PubMed] [Google Scholar]
- Zhao J., Wang Z., Fu C., Wang M., He Q. Electroanalysis. 2008;20(14):1587–1592. [Google Scholar]
- Hassan R. Y., Bilitewski U. A. Anal. Biochem. 2011;419(1):26–32. doi: 10.1016/j.ab.2011.07.025. [DOI] [PubMed] [Google Scholar]
- Rawson F. J., Downard A. J., Baronian K. H. Sci. Rep. 2014;4:5216. doi: 10.1038/srep05216. [DOI] [PMC free article] [PubMed] [Google Scholar]
- Vautor E., Abadie G., Pont A., Thiery R. Vet. Microbiol. 2008;127(3):407–411. doi: 10.1016/j.vetmic.2007.08.018. [DOI] [PubMed] [Google Scholar]
- Vergara-Irigaray M., Valle J., Merino N., Latasa C., García B., de los Mozos I. R., Lasa I. Infect. Immun. 2009;77(9):3978–3991. doi: 10.1128/IAI.00616-09. [DOI] [PMC free article] [PubMed] [Google Scholar]
- Huang H., Lai W., Cui M., Liang L., Lin Y., Fang Q., Xie L. Sci. Rep. 2016;6:5421. doi: 10.1038/srep25518. [DOI] [PMC free article] [PubMed] [Google Scholar]
- Kim M. J., Shin S. Food Chem. Toxicol. 2014;67:80–86. doi: 10.1016/j.fct.2014.02.006. [DOI] [PubMed] [Google Scholar]
- Rajesh R., Nataraju A., Gowda C. D. R., Frey B. M., Frey F. J., Vishwanath B. S. Biochim. Biophys. Acta. 2006;88(10):1313–1322. doi: 10.1016/j.biochi.2006.06.007. [DOI] [PubMed] [Google Scholar]
- Tiruppathi C., Song W., Bergenfeldt M., Sass P., Malik A. B. J. Biol. Chem. 1997;272(41):25968–25975. doi: 10.1074/jbc.272.41.25968. [DOI] [PubMed] [Google Scholar]
- Frei E. Diabetol. Metab. Syndr. 2011;3(1):1–4. doi: 10.1186/1758-5996-3-11. [DOI] [PMC free article] [PubMed] [Google Scholar]
- Azizi M., Ghourchian H., Yazdian F., Bagherifam S., Bekhradnia S., Nyström B. Sci. Rep. 2017;7:5178. doi: 10.1038/s41598-017-05461-3. [DOI] [PMC free article] [PubMed] [Google Scholar]
- Emran T. B., Rahman M. A., Uddin M. M. N., Dash R., Hossen M. F., Mohiuddin M., Alam M. R. Daru, J. Pharm. Sci. 2015;23:26–34. doi: 10.1186/s40199-015-0106-9. [DOI] [PMC free article] [PubMed] [Google Scholar]
- Manukumar H. M., Prathima V. R., Sowmya Siddhagangaia, Thribhuvan K. R. Int. Res. J. Pharm. App. Sci. 2013;3(5):112–119. [Google Scholar]
- Manukumar H. M., Madhu C. S. Int. J. Recent Sci. Res. 2013;4(9):1395–1399. [Google Scholar]
- Manukumar H. M., Ananda A. P., Deepa V., Siddhagangaia Int. J. Pharm. Life Sci. 2013;4(12):3159–3165. [Google Scholar]
- Manukumar H. M., Prathima V. R., Guru C., Kurinji V. Int. J. Pharm. Res. 2013;6(1):117–128. [Google Scholar]
- Manukumar H. M., Thribhuvan K. R. Int. J. Pharm. Biol. Sci. 2014;5(1):131–141. [Google Scholar]
- Manukumar H. M., Vanitha M. T. Int. J. Res. Dev. Pharm. Life Sci. 2014;5(12):033–040. [Google Scholar]
- Madhu C. S., Manukuamr H. M., Thribhuvan K. R., Bhimangouda R. P. World J. Pharm. Sci. 2014;3(2):2888–2896. [Google Scholar]
- Manukumar H. M., Shruthi K. C. World J. Pharm. Pharm. Sci. 2014;3(3):1428–1439. [Google Scholar]
- Manukumar H. M., Prathima V. R., Lokesh S., Gowtham G., Suresha S. World J. Pharm. Pharm. Sci. 2014;3(6):1406–1427. [Google Scholar]
- Madhu C. S., Manukumar H. M., Basavaraju P. Acta Sci. Pol., Technol. Aliment. 2014;13(4):375–383. doi: 10.17306/J.AFS.2014.4.4. [DOI] [PubMed] [Google Scholar]
- Manukumar H. M., Umesha S. Acta Sci. Pol., Technol. Aliment. 2015;14(1):85–90. doi: 10.17306/J.AFS.2015.1.10. [DOI] [PubMed] [Google Scholar]
- Manukumar H. M., Chandrasekhar B., Shivakumar J., Raghava S., Umesha S. Crit. Rev. Food Sci. Nutr. 2016;57(12):2712–2729. doi: 10.1080/10408398.2016.1143446. [DOI] [PubMed] [Google Scholar]
- Umesha S., Manukumar H. M., Chandrasekhar B., Raghava S., Shiva Kumar J., Shivakumara P., Avinash A. P., Shirin M., Bharathi T. R., Rajini S. B., Nandhini M., Vinayarani G., Shobha M., Prakash H. S. J. Sci. Food Agric. 2016;97:1698–1707. doi: 10.1002/jsfa.8144. [DOI] [PubMed] [Google Scholar]
- Manukumar H. M., Umesha S. Sci. Rep. 2017;7:11414. doi: 10.1038/s41598-017-11597-z. [DOI] [PMC free article] [PubMed] [Google Scholar]
- Manukumar H. M., Umesha S. Food Res. Int. 2017;102:144–155. doi: 10.1016/j.foodres.2017.09.095. [DOI] [PubMed] [Google Scholar]
- Manukumar H. M., Yashwanth B., Umesha S., Venkateshwara Rao J. Arabian J. Chem. 2017 doi: 10.1016/j.arabjc.2017.09.017. [DOI] [Google Scholar]


