 LM and ALM showed notable antitumor effect in H22 tumor-bearing mice and ALM was more effective.
Abstract
In the present study, we investigated the anti-tumor activities of the intracellular homogeneous melanin (LM) of Lachnum YM226 and its derivative (ALM) on liver cancer using murine H22 hepatocarcinoma model. The results showed that LM and ALM (50 and 200 mg kg–1) could effectively inhibit tumor growth of H22 tumour-bearing mice. The body weight, liver, spleen and thymus indices also improved in the LM and ALM treated groups. Moreover, the levels of alanine aminotransferase (ALT), aspartate aminotransaminase (AST), alkaline phosphatase (ALP), creatinine (CRE), blood urea nitrogen (BUN) and uric acid (UA) were lowered. Serum cytokines of interleukin-2 (IL-2), interleukin-6 (IL-6), tumor necrosis factor-α (TNF-α) and interferon-γ (IFN-γ) were increased on LM and ALM administration, while LM and ALM significantly decreased the vascular endothelial growth factor (VEGF) and basic fibroblast growth factor (bFGF) levels. The H&E staining indicated that LM and ALM exhibited antitumor activity in vivo by promoting apoptosis and inhibiting angiogenesis. The anti-tumor effect of ALM was more significant than that of LM for the same dose. In summary, the findings demonstrated that LM and ALM might be promising candidates for the prevention and treatment of HCC.
1. Introduction
Hepatocellular carcinoma (HCC), a global health problem, is the seventh most common cancer worldwide and the third leading cause of cancer-related deaths.1 The incidence of HCC in China ranks first in the world and its incidence rate is about 10 times that in European countries.2 It is expected that HCC incidence will increase drastically in the coming years, partly due to the lack of effective therapies.3 Although several treatment options exist for HCC, including surgical resection, liver transplantation and percutaneous ablation, surgical resection is still the preferred solution for the treatment of HCC.4 However, curative surgery and liver transplant are the only available options to a small minority of early-stage HCC patients, while advanced stage HCC is easy to relapse and becomes fatal even if patients receive combination chemotherapy.5,6 Further, several chemically synthesized medicines are available for treating HCC, but these drugs have low-selectivity and thus, frequently induce severe side effects.7,8 Therefore, developing novel natural medicines with better effectiveness and lower toxicity are required imminently.
Melanin is an amorphous black pigment of high molecular weight. It is formed by oxidative polymerization of phenolic or indolic compounds present in animals, plants, bacteria and fungi. Conventionally, melanin has been widely used in different industries including cosmetics, food and medicine owing to its antimicrobial, anti-inflammatory and radical scavenging activities.9–11 The pigments from microorganisms constitute a valuable source because they are capable of producing high yields of melanin in the cheap culture medium, thus making the bioprocess economically viable on the industrial scale. Therefore, microbial submerged fermentation is a rapid and promising alternative for the efficient production of natural melanin with consistent quality.12Lachnum is a class of saprophytic fungus that can produce a large amount of melanin when cultured in a submerged condition. It has been reported that melanin extracted from Lachnum has a wide spectrum of pharmacological activities, including anti-radiation, anti-oxidation, anti-aging and antibacterial action.13–16 However, melanin is almost insoluble in water, which greatly prevents its applications in water-based systems. Our previous studies suggest that the solubility and anti-oxidant activity of Lachnum melanin was enhanced after its modification with amino acids.17 Recently, Costa et al. also reported the synthesis of two new types of melanin chemically modified with amino acids.18
In this study, we explore the anti-tumor effects of Lachnum melanin and its arginine derivative in a tumor-bearing animal model.
2. Results
2.1. Characterization of melanin derivative
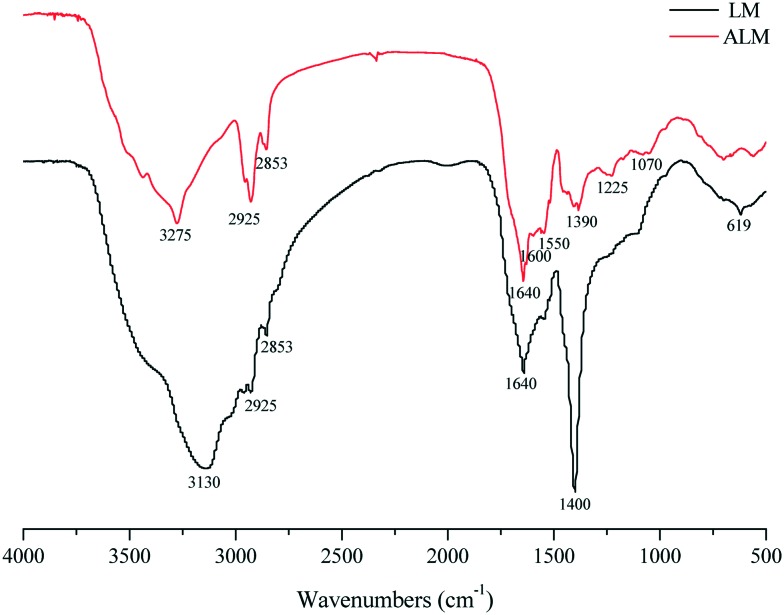
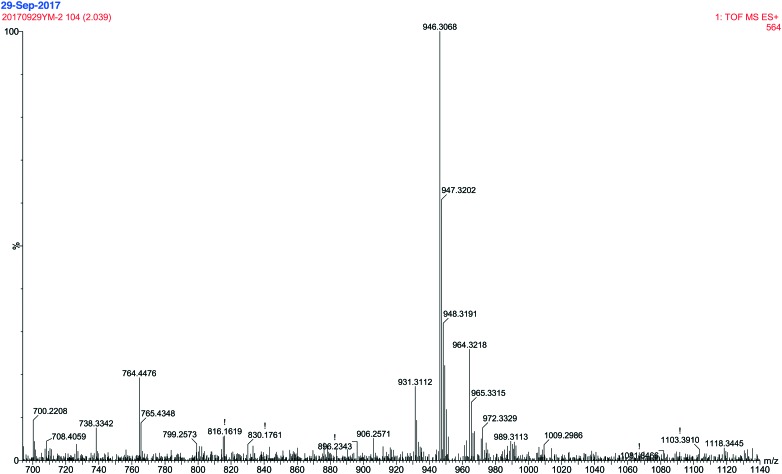
The water solubility of ALM was determined to be 20.09 mg mL–1. The structural characterization of LM was examined in our previous study,19 and its chemical structure is shown in Fig. S1.† The FTIR spectrum of ALM is shown in Fig. 1. The peak at 1600 cm–1 corresponds to NH2 bending in guanidyl group of arginine. The bending vibration at 1550 cm–1 corresponds to N–H in NH3+ umbrella of arginine.20 Two bands are observed at 2853 cm–1 and 2925 cm–1 belong to asymmetric and symmetric stretching vibrations of C–H of (–CH2)3 in arginine or LM. The band at 3275 cm–1 is attributed to –NH or –OH stretching.21 The band at 1225 cm–1 corresponds to bending vibration of –OH of ALM. The band at 1390 cm–1 is attributed to C–O stretching vibration of the phenolic OH group.22 Additionally, the spectrum displays a band at 1070 cm–1, which is attributed to the aromatic rings in a substituted macromolecular system.18 The MS spectrum of ALM (Fig. 2) shows that the mass to charge ratios (m/z) of fragments varied from 700 to 1140. Compared with the MS spectrum of LM, the m/z ratios of new fragments are 946 and 947 in the MS spectrum of ALM, from which we could infer that LM has an addition reaction with two arginine molecules. The above analysis results indicate that the arginine LM derivative was successfully synthesized.
Fig. 1. FTIR spectra of LM and ALM.
Fig. 2. Mass spectrum of ALM.
2.2. Effects of LM and ALM on body weight and tumor growth
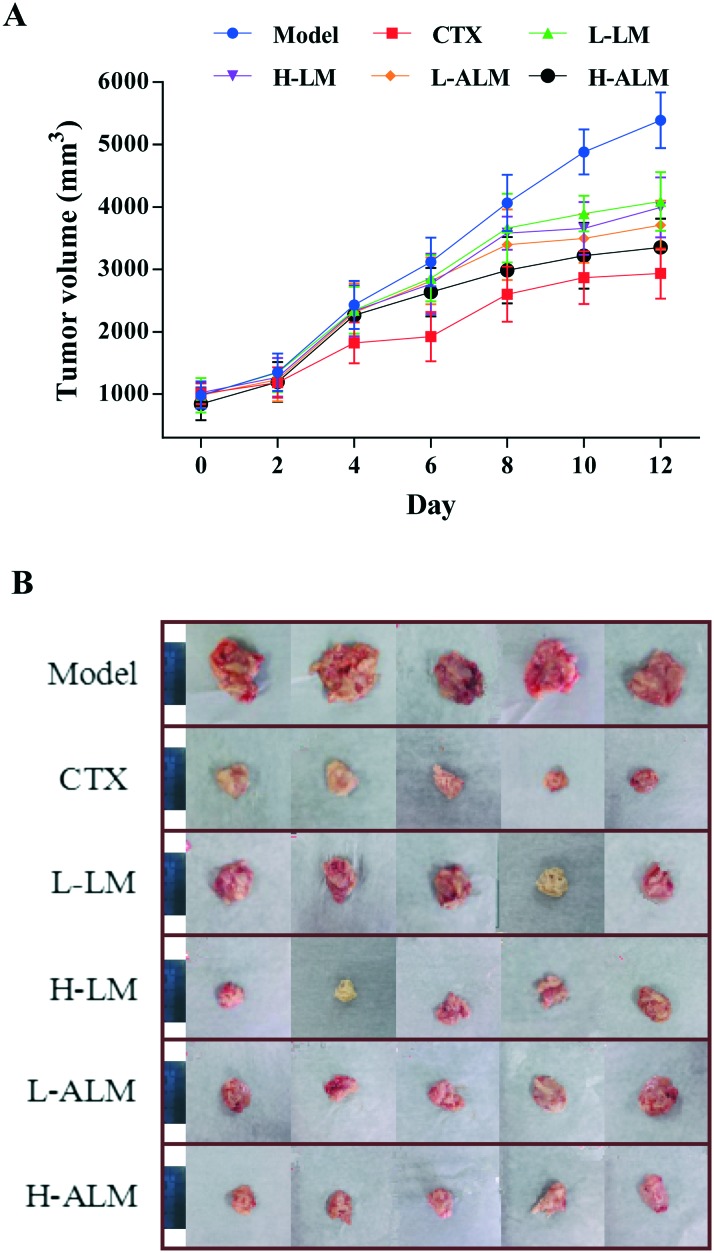
The changes in body weight, tumor weight and tumor size of all the tumor-bearing mice in all the treatment groups are shown in Table 1 and Fig. 3. It is clear that the body weight of the model group increased with growing tumor weight, and the tumor volume of the model group reached to more than 5000 mm3 at day 12. However, after treatment for 12 days, the body weight of the mice in CTX, LM and ALM treated groups decreased significantly when compared with the model group (p < 0.05 or p < 0.01). These treatments significantly inhibited the increasing trend of tumour weight (p < 0.01) in a dose-dependent manner, and ALM treatment manifested higher average inhibition rate for the tumor weight than the LM treatment. Accordingly, the tumor inhibitory rates of the CTX, LM and ALM high dose groups were 54.17%, 35.05% and 46.47%, respectively.
Table 1. Effects of different treatments on the body weight and tumor growth in H22 tumor-bearing mice.
| Groups | Body weight (g) |
Increase of body weight (g) | Tumor weight (g) | Average inhibition rate (%) | |
| Pre-treatment | Post-treatment | ||||
| Normal | 28.30 ± 2.27 | 33.19 ± 1.74 | 4.89 ± 1.74 b d | — | — |
| Model | 28.16 ± 2.17 | 40.31 ± 3.58 | 12.16 ± 3.58 d | 6.81 ± 1.61 d | — |
| CTX | 27.43 ± 2.05 | 29.18 ± 1.91 | 1.76 ± 1.91 b | 3.12 ± 0.76 b | 54.17 |
| L-LM | 28.97 ± 1.24 | 37.16 ± 2.03 | 8.20 ± 2.03 a d | 4.61 ± 0.83 b d | 32.29 |
| H-LM | 28.93 ± 1.42 | 36.49 ± 2.43 | 7.56 ± 2.43 b d | 4.43 ± 0.58 b d | 35.05 |
| L-ALM | 28.86 ± 1.26 | 36.80 ± 1.90 | 7.94 ± 1.90 b d | 4.22 ± 1.04 b c | 38.05 |
| H-ALM | 28.47 ± 1.45 | 34.32 ± 2.53 | 5.85 ± 2.53 b d | 3.63 ± 0.92 b | 46.47 |
a p < 0.05.
b p < 0.01: significantly different when compared with model group.
c p < 0.05.
d p < 0.01: significantly different when compared with normal group.
Fig. 3. Tumor volume of H22 tumor-bearing mice during treatment (A). Photographic illustrations of tumors obtained from H22 tumor-bearing mice; scale bars in the photos represent 4 cm (B).
2.3. Effect of LM and ALM on organ indices
To evaluate whether LM and ALM administration resulted in any side effect on the immune system, the liver, spleen and thymus indices of mice were calculated at the end of the study. As shown in Table 2, mice bearing H22 tumor cells had higher liver and spleen indices than those of normal mice. In addition, the spleen and thymus indices in the CTX-treated mice were significantly lower than that of the model group (p < 0.01), which accounted for the immunosuppressive side effect by CTX during the therapy. However, both the thymus and spleen indices of mice treated with LM and ALM at different dosages were significantly higher than those of the CTX group. There was no significant difference between the model group and LM-treated group in case of the spleen and thymus indices, but the thymus index of H-ALM group was higher than that of the model group.
Table 2. The organ indices of the treatment groups on H22 tumor models.
| Groups | Liver (%) | Spleen (%) | Thymus (%) |
| Normal | 3.01 ± 0.54 b | 0.35 ± 0.09 b | 0.20 ± 0.05 b |
| Model | 4.17 ± 0.68 d | 0.54 ± 0.09 d | 0.13 ± 0.06 d |
| CTX | 3.56 ± 0.86 | 0.25 ± 0.14 b c | 0.04 ± 0.01 b d |
| L-LM | 3.72 ± 0.65 | 0.48 ± 0.08 d | 0.15 ± 0.04 d |
| H-LM | 3.79 ± 1.14 | 0.48 ± 0.08 d | 0.16 ± 0.07 |
| L-ALM | 3.82 ± 0.97 | 0.47 ± 0.05 d | 0.17 ± 0.04 a |
| H-ALM | 3.61 ± 1.09 | 0.43 ± 0.08 a | 0.18 ± 0.04 a |
a p < 0.05.
b p < 0.01: significantly different when compared with model group.
c p < 0.05.
d p < 0.01: significantly different when compared with normal group.
2.4. Effects of LM and ALM on hepatic and renal function
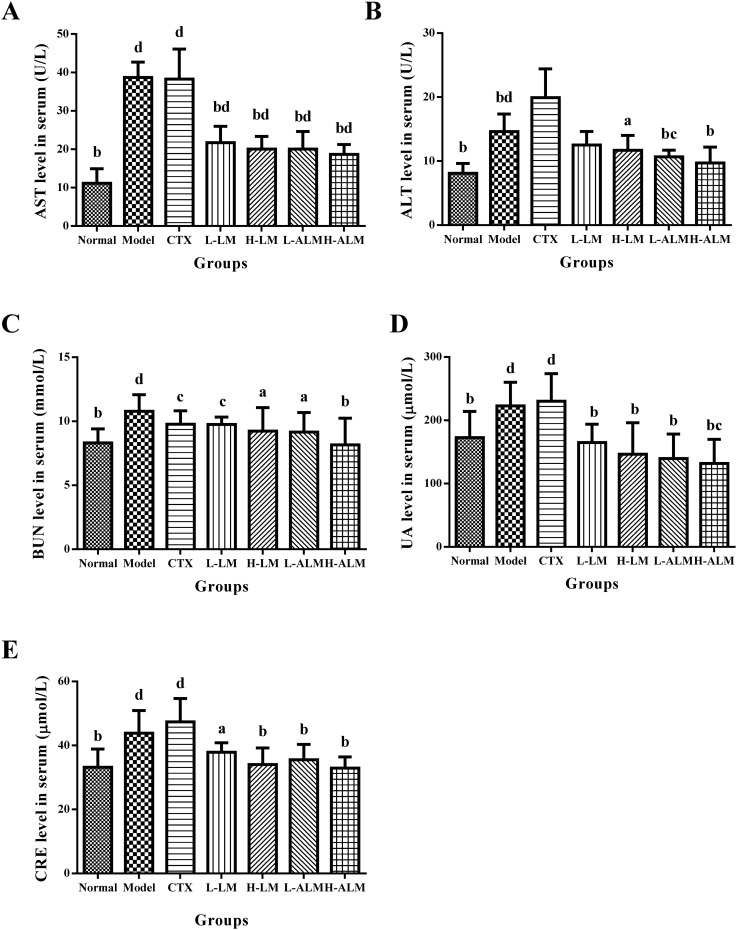
As presented in Fig. 4, after treatment with CTX, the serum ALT level increased drastically compared to the model group, and the AST level also increased significantly compared to normal group (p < 0.01), which was similar to the model group level. However, the serum levels of AST and ALT in mice treated with LM and ALM decreased significantly compared with those in model group (p < 0.05 or p < 0.01). The data in Fig. 4C–E also indicated that LM and ALM reduced the serum BUN, UA and CRE levels significantly when compared to the model group, which suggested a possible improvement in renal function after the administrations.
Fig. 4. The serum levels of AST, ALT, BUN, UA and CRE (A–E) in mice of each group. ap < 0.05; bp < 0.01: significantly different when compared with model group; cp < 0.05; dp < 0.01: significantly different when compared with normal group.
2.5. Effect of LM and ALM on the levels of serum cytokines
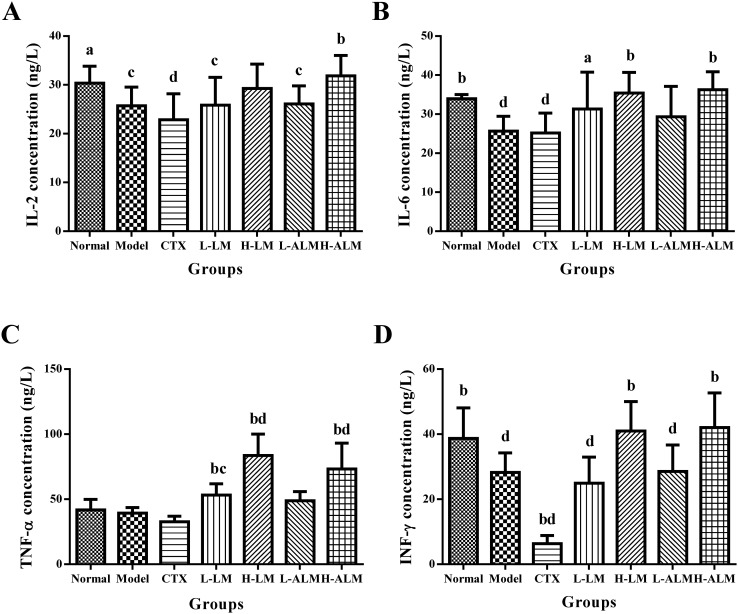
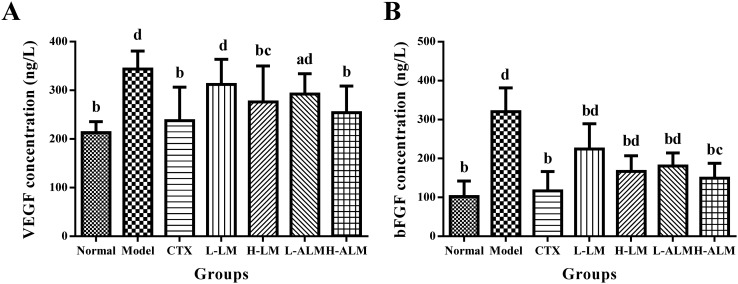
As shown in Fig. 5, the serum levels of IL-2 and IL-6 in L-LM and H-LM groups were higher than those in the model group, while those in H-ALM group were significantly elevated (p < 0.01). Moreover, the treatment of the mice with LM and ALM at a dose of 200 mg kg–1 promoted TNF-α and IFN-γ production in the serum when compared with the model group (p < 0.05 or p < 0.01). On the contrary, the levels of TNF-α and IFN-γ decreased remarkably in the CTX treatment group compared to those of the model group. As shown in Fig. 6, the result indicated that the VEGF and bFGF concentrations in serum of the model group increased markedly. However, after LM and ALM treatments, the VEGF and bFGF levels substantially decreased.
Fig. 5. The serum levels of IL-2, IL-6, TNF-α, IFN-γ (A–D) in mice of each group. ap < 0.05; bp < 0.01: significantly different when compared with model group; cp < 0.05; dp < 0.01: significantly different when compared with normal group.
Fig. 6. The serum levels of VEGF (A) and bFGF (B) in mice of each group. ap < 0.05; bp < 0.01: significantly different when compared with model group; cp < 0.05; dp < 0.01: significantly different when compared with normal group.
2.6. Morphological changes
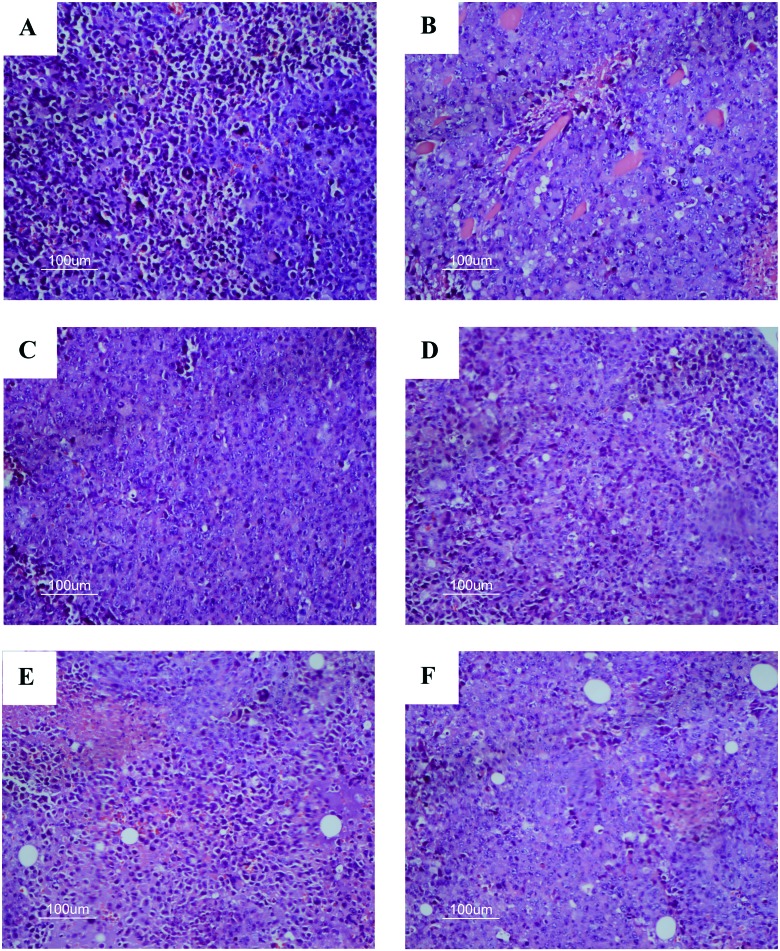
In the present study, tumor tissue of H22 tumor-bearing mice were processed for H&E staining assay to examine the morphological changes in tumor cells. In Fig. 7A, it can be seen that tumor cells of the model group increased in number and volume with a large, clear and apparent nucleolus, which also exhibited inflammation and vascular proliferation. In comparison to the model group, a relatively lower nuclear to cytoplasmic ratio in the tumors was observed in CTX, LM and ALM treatment groups, which showed a loose arrangement and large apoptotic and necrotic regions. In LM and ALM treated groups with high-dose, the hepatoma cell density decreased evidently, while the leukocyte infiltration and hemorrhage of tumors significantly reduced; also varying degrees of patchy necrosis was observed.
Fig. 7. Effect of LM and ALM on morphological changes of mice tumor tissue (original magnification 400× and HE staining). A) Model group, B) CTX group, C) L-LM group, D) H-LM group, E) L-ALM group, and F) H-ALM group.
3. Discussion
Natural products have played a dominant role in the prevention and treatment of human ailments. These natural products comprise a large portion of the current-day pharmaceutical agents, most notably in the area of cancer therapy.23,24 Hepatocellular carcinoma (HCC) is one of the most frequent malignant tumors causing high mortality.25 Many natural products such as anthocyanin, ginsenoside and hydroxysafflor yellow A have demonstrated anti-tumor bio-activities in H22 tumor-bearing mice.26–28 The present investigation was designed to assess the anti-tumor effect in vivo of melanin (LM) and its arginine derivatives (ALM) of Lachnum on H22 tumor-bearing mice. The results showed that both LM and ALM could significantly inhibit the growth of tumor transplanted in mice compared with the model group, and the antitumor activity of ALM was better than that of LM.
The immune system plays a pivotal role in anti-tumor defense. Lowered immune function will favor the formation and development of tumor, and tumors can often cause a decrease in immune functions and atrophy of the immune organs.29 Spleen and thymus are important immune organs. The weight of the thymus and spleen directly reflects the immune functional strength in the body. Furthermore, effects of drugs on the spleen index and thymus index can be used as preliminary indicators of the immunopharmacological mechanisms in animals.30 In the present study, the result demonstrated that higher dose of ALM markedly alleviated the atrophy of the spleen and thymus, stimulating the proliferation of thymus cells in H22 tumor-bearing mice. The spleen and thymus indices of L-LM and H-LM groups were higher than those in the model group, which is a clear indication of strengthened immune system as these indices have been used to assess the side effects of synthetic drugs on immunity. These results also suggested that LM might have exerted the anti-tumor effect via enhanced immunity.
In anti-cancer treatment, it could be a challenge to trigger tumor cell death without affecting other normal organs. Perfect anti-HCC chemotherapeutics would include not only the virtue of repressing the growth of malignant cells, but also minimum toxicity to normal organs.31 ALT and AST are considered to be sensitive hallmarks of hepatocellular damage, which provides a quantitative evaluation for the degree of liver damage. Furthermore, BUN, UA and CRE are the biomarkers of renal injury; high content of these markers often indicates renal malfunctions.32,33 To explore the potential toxicological impact of LM and ALM on H22 tumor-bearing mice, the liver and renal function parameters, including ALT, AST, BUN, UA, and CRE, were measured. In this study, LM and ALM treatment decreased levels of these parameters, supporting the fact that LM and ALM have no distinct systemic toxicity to major organs in H22 tumor-bearing mice.
The mixture of cytokines that is produced in the tumor microenvironment has an important role in cancer pathogenesis. Cytokines that are released in response to infection, inflammation and immunity can function to inhibit tumor development and progression, which directly stimulate immune effector cells and stromal cells at the tumor site and enhance tumor cell recognition by cytotoxic effector cells.34 Cytokines that control the immune response were shown to have efficacy in preclinical murine cancer models.35 IL-2 is the key factor for augmenting an effector lymphocyte immune response. It also serves as a potent immune regulator by expanding immunosuppressive CD4+FOXP3+ T regulatory cells (Treg).36 IL-6 is a pro-inflammatory cytokine produced by multiple cell types in response to external stimuli, including stress, trauma, and infection. It plays a crucial role in regulating CD4+ T cell differentiation and effector functions.37,38 TNF-α, which is produced by monocytes or macrophages, is a multifunctional cytokine involved in cell survival, apoptosis, inflammation and immunity action.39–41 It has been proven to be an effective anticancer agent in vitro and in vivo through preclinical studies, by inducing apoptotic cell death and tumor necrosis.42 IFN-γ is a key cytokine produced by activated T cell, as well as natural killer (NK) and NK T cells in the tumor microenvironment, and it plays an important role in coordinating this process.43 In this study, we found that the different doses of LM and ALM increased the serum levels of IL-2, IL-6, TNF-α, and IFN-γ. Furthermore, the H-ALM group showed better efficiency than the H-LM group. This data implies that promoting cytokine secretion by LM and ALM might be one of the adjunct anticancer mechanisms. The potential molecular mechanisms may be that LM and ALM could repress tumor transplantation-induced CD4+ T cell apoptosis and activate NF-κB activity in CD4+ T cells, or regulate the expression of Bcl-2 and Bax.44
Hepatocellular carcinoma (HCC), characterized by rapid growth, early metastasis and high mortality, is an intensive vascular-dependent malignant tumor,45 and angiogenesis plays an important role in the pathogenesis of the disease. Cancer tumor exceeds the size limit (generally 2 mm) through the induction of its own blood supply, generally by the process of angiogenesis, which then continues to grow virtually unchecked.46 Cancer cells stimulate angiogenesis by secreting soluble factors that stimulate vessel growth and/or by suppressing factors that prevent angiogenesis. These factors act primarily upon endothelial cells to promote their proliferation and migration, resulting in the sprouting and formation of tubes, which then develop into vessels, such as VEGF and bFGF.47,48 VEGF is a hexose-modified multifunctional protein, which specifically acts on vascular endothelial cells, inducing microangiogenesis and causing tumor invasion and metastasis.49 Several reports have stressed the role of VEGF in the neovascularization process.50,51 bFGF, is an important prolymphangiogenesis factor generated by tumor cells, which can significantly promote the proliferation and migration of lymphatic vessel endothelial cells, promoting tumor lymphangiogenesis by a variety of ways.52 Our results demonstrate that LM and ALM could inhibit the secretion of VEGF and bFGF. Thus, LM and ALM exhibit antitumor effects due to their capacity to inhibit angiogenesis by inhibiting the activation of ERK/MAPK and NF-κB pathway signaling to restrain tumor angiogenesis, probably through its molecular mechanism.53
4. Conclusion
The present study verifies that the melanin of Lachnum YM226 and its arginine derivative have good inhibitive effect on the tumor growth in H22 tumor-bearing mice. LM and ALM markedly increased immune organ indices, regulated the liver and kidney functions, enhanced the serum cytokine concentration of IL-2, IL-6, TNF-α, and IFN-γ and decreased VEGF and bFGF levels. The underlying mechanisms may be because LM and ALM improved the immune functions, induced apoptosis and inhibited angiogenesis. These improvements extensively provide a scientific basis for developing a safe therapeutic agent for patients suffering from cancer, although further studies are needed prior to clinical use.
5. Experimental section
5.1. Materials
The fruiting bodies of Lachnum YM226 were collected from Yunnan Province, China. Lachnum YM226 was isolated and preserved in the Microbial Resource and Application Laboratory of the Hefei University of Technology. The intracellular homogeneous melanin of Lachnum YM226 (LM) was obtained according to the method described in the previous study of Ye et al.13 DMEM 1640 medium and fetal bovine serum (FBS) were acquired from Gibco (Carlsbad, CA, USA). All the other reagents were of analytical grade.
5.2. Preparation of LM arginine derivatives
The arginine derivatives of LM were prepared with slight modification according the method reported by Ye et al. as detailed below.17 First, arginine and LM were dissolved in distilled water with a concentration ratio (mol/L) of 1 : 1. Then, the mixed solution was agitated for 1 h and centrifuged at 5000 rpm at 30 °C for 10 min. Further, the supernatant was dialyzed with a dialysis bag (200 Da) in distilled water for 72 h. After cryodesiccation, the arginine derivative of LM in powder form (ALM) was obtained.
5.3. Water solubility assay of ALM
The water solubility of ALM was measured using colorimetric method reported by Song et al.19
5.4. Structural characterization of ALM
5.4.1. FTIR spectroscopy of ALM
The FTIR analysis was carried out in KBr pellets with approximately 5–10 mg of the ALM sample in a Nicolet 67 FTIR spectrometer (Thermo Nicolet, USA) with a computerized detection system between the region of 400 to 4000 cm–1.
5.4.2. MS analysis of ALM
The MS analysis of ALM was based on previous methods17 using the liquid chromatography-time of flight mass spectrometer (ACQUITY UPLC-LCT Premier XE; Waters, Milford, MA).
5.5. Animal and cell lines
Eighty male Kunming mice, weighing approximately 20 ± 2 g, were purchased from Experimental Animal Center of Anhui Medical University (Certificate number: No. 1 license of the Medical Laboratory Animal of Anhui) and were acclimatized in an environmentally controlled breeding room (temperature 22 ± 2 °C, relative humidity 55% ± 5%, and a 12 h-light/dark cycle) for 7 days prior to treatment. The experimental protocols were approved by the Committee for Protection of Animal Care Committee at the Hefei University of Technology and were performed in accordance with the Guidelines of Experimental Animal Administration published by the State Committee of Science and Technology of People's Republic of China.
H22 mouse hepatocellular carcinoma cells were obtained from the Wuhan University Preservation Center and maintained in RPMI 1640 (Gibco-BRL, USA) with 10% fetal bovine serum, 100 U mL–1 penicillin, and 100 μg mL–1 streptomycin (Invitrogen Corp., CA, USA) at 37 °C under a humidified atmosphere of 5% CO2. The cells were subcultured until they reached logarithmic growth phase.
5.6. Animal experiments and treatment
Under aseptic condition, ascites were taken from hepatoma H22 bearing mice and were diluted with normal saline into a suspended solution at a concentration of 1 × 10⁷ cells per mL. For the solid tumor experiment, the mice were injected with 0.2 mL of H22 cells (1 × 10⁶ cells per mL) subcutaneously in the right axillary. After 3 days, the diameter of the tumor was nearly 10 mm, which showed that the model was established successfully. Then, the mice were randomly divided into seven groups (n = 10) as follows: normal group, model group, CTX group, LM-low dose group (L-LM), LM-high dose group (H-LM), ALM-low dose group (L-ALM), and ALM-high dose group (H-ALM).
The model control group and normal control group were given the same volume of physiologic saline instead of the test solution. In the CTX group, 25 mg kg–1 cyclophosphamide was administered intragastrically to the mice as positive control group. The high and low dose LM groups received intragastric perfusion of LM at the dose of 50 mg kg–1 and 200 mg kg–1, respectively. The high and low dose ALM groups were administered 50 mg kg–1 and 200 mg kg–1 of ALM, respectively. All these treatments were administered intragastrically once daily for 12 days with a volume of 0.2 mL. The mice were weighed every three days for dose adjustment, and the percentage of body weight gain was calculated as (final body weight – initial body weight)/initial body weight.
5.7. Body weight, organ index, tumor weight and growth
After 24 h of the last administration, all the mice were sacrificed by cervical dislocation. Tumor, liver, spleen and thymus of the mice were excised and weighed on the balance. The size of five tumor samples in each group was taken for shooting pictures. The inhibitory effect of experimental treatment on tumor growth was evaluated by tumor inhibition rate, and the influence of different drugs on the immune organs was evaluated by the immune organ index. The tumor inhibition rate was calculated as (tumor weight of model control group – tumor weight of treatment group)/tumor weight of model control group × 100%. The organ index was calculated as organ weight/final body weight × 100%. The volume of the solid tumor was measured with a digital caliper every two days. It was calculated according to the following equation: tumor volume (mm3) = [A × B2]/2, where A and B represent the largest diameter and the smallest diameter, respectively.49 Compared with the control groups, the anti-tumor activity of the tested sample was expressed as an average inhibition rate calculated as (1 – average tumor weight of the treated group/average tumor weight of the model group) × 100%.
5.8. Analysis of liver and kidney function
After the last administration for 24 h, blood was collected from the orbital venous plexus. Serum was extracted from blood samples by centrifugation at 3000g for 10 min after blood clotting and then divided into aliquots and preserved at –80 °C. The serum levels of a series of physiochemical indices, including aspartate aminotransferase (AST), alanine aminotransferase (ALT), creatinine (CRE), blood urea nitrogen (BUN) and uric acid (UA) were determined using the corresponding commercial kits (Nanjing Jiancheng Bioengineering Inst., Nanjing, China).
5.9. Serum cytokine concentration determination
The serum levels in cytokines were determined by ELISA according to the manufacturer's instructions. ELISA kits (Shanghai Meilian industrial Co., Ltd., Shanghai, China) were employed for the measurement of the levels of interleukin-2 (IL-2), interleukin-6 (IL-6), tumor necrosis factor-α (TNF-α), interferon-γ (IFN-γ) vascular endothelial growth factor (VEGF) and basic fibroblast growth factor (bFGF).
5.10. Pathological observation
The tumor samples of each group were removed and fixed with buffered neutral 10% formalin and embedded in paraffin and then sliced into 4 μm-thick pieces with a rotary microtome. The slices were stained with hematoxylin eosin (HE), followed by observation under an optical microscope. The photographs were taken at ×400 magnification.
5.11. Statistical analysis
All data were presented as mean ± SD. Statistical analysis was performed with SPSS 17.0 software. The significance of the data was determined by one-way analysis of variance (ANOVA), and differences were considered to be statistically significant if p < 0.05 and extremely statistically significant when p < 0.01.
Conflicts of interest
The authors declare no competing interest.
Supplementary Material
Acknowledgments
This study was financially supported by the National Natural Science Foundation of China (31270060).
Footnotes
†Electronic supplementary information (ESI) available. See DOI: 10.1039/c8md00035b
References
- Ferlay J., Shin H., Bray F., Forman D., Mathers C., Parkin D. Int. J. Cancer. 2010;136:359–386. doi: 10.1002/ijc.25516. [DOI] [PubMed] [Google Scholar]
- Fan J. H., Wang J. B., Liang H., Xiang W., Wei W. Q., Dawsey S. M., Qiao Y. L., Boffetta P. Asian Pac. J. Cancer Prev. 2013;14:7251–7256. doi: 10.7314/apjcp.2013.14.12.7251. [DOI] [PubMed] [Google Scholar]
- White D. L., Kanwal F., Jiao L. and El-Serag H. B., Hepatocellular Carcinoma, Springer, Cham, 2016, pp. 3–24. [Google Scholar]
- Molina-Sánchez P., Lujambio A. Aging. 2017;9:1088–1089. doi: 10.18632/aging.101233. [DOI] [PMC free article] [PubMed] [Google Scholar]
- Liu Y., Wang Y. R., Dingi G. H., Yang T. S., Jiang S. L., Wang L., Xun L. J., Song R. M., Song Z. S., Zhou B. Neoplasma. 2015;62:635–640. doi: 10.4149/neo_2015_076. [DOI] [PubMed] [Google Scholar]
- Chung K. Y., Saltz L. B. Cancer J. 2007;13:192–197. doi: 10.1097/PPO.0b013e318074d26e. [DOI] [PubMed] [Google Scholar]
- Nouso K., Miyahara K., Uchida D., Kuwaki K., Izumi N., Omata M., Ichida T., Kudo M., Ku Y., Kokudo N., Sakamoto M., Nakashima O., Takayama T., Matsui O., Matsuyama Y., Yamamoto K., the Liver Cancer Study Group of Japan Br. J. Cancer. 2013;109:1904–1907. doi: 10.1038/bjc.2013.542. [DOI] [PMC free article] [PubMed] [Google Scholar]
- Song M. J., Bae S. H., Chun H. J., Choi J. Y., Yoon S. K., Park J. Y., Han K. H., Kim Y. S., Yim H. J., Um S. H. Cancer Chemother. Pharmacol. 2015;75:739–746. doi: 10.1007/s00280-015-2692-0. [DOI] [PubMed] [Google Scholar]
- Baltazar L. M., Werneck S. M. C., Soares B. M., Ferreira M. V. L., Souza D. G., Pinotti M., Santos D. A., Cisalpino P. S. Antimicrob. Agents Chemother. 2015;59:4003–4011. doi: 10.1128/AAC.04917-14. [DOI] [PMC free article] [PubMed] [Google Scholar]
- Kurian N. K., Nair H. P., Bhat S. G. Asian J. Pharm. Clin. Res. 2015;8:251–255. [Google Scholar]
- Yu Z., Yue Z., Hu W. Z. Food Sci. Technol. 2015;35:253–258. [Google Scholar]
- Pombeiro-Sponchiado S. R., Sousa G. S., Andrade J. C. R., Lisboa H. F. and Gonçalves R. C. R., in Melanin, ed. M. Blumenberg, InTech, 2017, ch. 4, pp. 48–74. [Google Scholar]
- Ye M., Guo G. Y., Lu Y., Song S., Wang H. Y., Yang L. Int. J. Biol. Macromol. 2014;63:170–176. doi: 10.1016/j.ijbiomac.2013.10.046. [DOI] [PubMed] [Google Scholar]
- Ye M., Wang Y., Qian M. S., Chen X., Hu X. Q. Int. J. Basic Appl. Sci. 2011;11:51–58. [Google Scholar]
- Lu Y., Ye M., Song S., Li L., Shaikh F., Li J. Appl. Biochem. Biotechnol. 2014;174:762–771. doi: 10.1007/s12010-014-1110-0. [DOI] [PubMed] [Google Scholar]
- Xu C., Li J., Yang L., Shi F., Yang L., Ye M. Food Control. 2017;73:1445–1451. [Google Scholar]
- Ye M., Wang Y., Guo G., He Y., Lu Y., Ye Y., Yang Q., Yang P. Food Chem. 2012;135:2490–2497. doi: 10.1016/j.foodchem.2012.06.120. [DOI] [PubMed] [Google Scholar]
- Costa T. G., Feldhaus M. J., Vilhena F. S., Heller M., Micke G. A., Oliveira A. S., Brighente I. M. C., Monteiro F. B. F., Creczynskipasa T. B., Szpoganicz B. J. Braz. Chem. Soc. 2015;26:273–281. [Google Scholar]
- Song S., Li S., Su N., Li J., Shi F., Ye M. Food Funct. 2016;7:3617–3627. doi: 10.1039/c6fo00333h. [DOI] [PubMed] [Google Scholar]
- Aviles-Moreno J. R., Berden G., Oomens J., Martinez-Haya B. Phys. Chem. Chem. Phys. 2018;20:4067–4073. doi: 10.1039/c7cp07975c. [DOI] [PubMed] [Google Scholar]
- Fu T. L., Wang I. J. Dyes Pigm. 2008;76:590–595. [Google Scholar]
- Paim S., Linhares L. F., Mangrich A. S., Martin J. P. Biol. Fertil. Soils. 1990;10:72–76. [Google Scholar]
- Cragg G. M., Pezzuto J. M. Med. Princ. Pract. 2016;25:41–59. doi: 10.1159/000443404. [DOI] [PMC free article] [PubMed] [Google Scholar]
- Newman D. J., Cragg G. M. J. Nat. Prod. 2007;70:461. doi: 10.1021/np068054v. [DOI] [PubMed] [Google Scholar]
- Lai E. C. H., Lau W. Y. Surgeon. 2005;3:210–215. doi: 10.1016/s1479-666x(05)80043-5. [DOI] [PubMed] [Google Scholar]
- Liu W., Chen J., Li Q., Sun A. Food Agric. Immunol. 2016;27:509–522. [Google Scholar]
- Chen F., Sun Y., Zheng S. L., Qin Y., Mcclements D. J., Hu J. N., Deng Z. Y. J. Funct. Foods. 2017;32:382–390. [Google Scholar]
- Yang F., Li J., Zhu J., Wang D., Chen S., Bai X. Eur. J. Pharmacol. 2015;754:105–114. doi: 10.1016/j.ejphar.2015.02.015. [DOI] [PubMed] [Google Scholar]
- Baldwin A. S. Immunol. Rev. 2012;246:327–345. doi: 10.1111/j.1600-065X.2012.01095.x. [DOI] [PubMed] [Google Scholar]
- Chen B. I. N., Liu L., Xu H., Yang Y., Zhang L., Zhang F. Exp. Ther. Med. 2015;9:1063–1067. doi: 10.3892/etm.2015.2217. [DOI] [PMC free article] [PubMed] [Google Scholar]
- Tang X., Huang J., Xiong H., Zhang K., Chen C., Wei X., Xu X., Xie Q., Huang R. Cell. Physiol. Biochem. 2016;39:1040–1050. doi: 10.1159/000447811. [DOI] [PubMed] [Google Scholar]
- Al-Habori M., Al-Aghbari A., Al-Mamary M., Baker M. J. Ethnopharmacol. 2002;83:209–217. doi: 10.1016/s0378-8741(02)00223-4. [DOI] [PubMed] [Google Scholar]
- Bellomo R., Kellum J. A., Ronco C. Lancet. 2012;380:756–766. doi: 10.1016/S0140-6736(11)61454-2. [DOI] [PubMed] [Google Scholar]
- Dranoff G. Nat. Rev. Cancer. 2004;4:11–22. doi: 10.1038/nrc1252. [DOI] [PubMed] [Google Scholar]
- Waldmann T. A. Cold Spring Harb. Perspect. Biol. 2017:a028472. doi: 10.1101/cshperspect.a028472. [DOI] [PMC free article] [PubMed] [Google Scholar]
- Ahmadzadeh M., Rosenberg S. A. Blood. 2006;107:2409–2414. doi: 10.1182/blood-2005-06-2399. [DOI] [PMC free article] [PubMed] [Google Scholar]
- Kishimoto T. Annu. Rev. Immunol. 2005;23:1–21. doi: 10.1146/annurev.immunol.23.021704.115806. [DOI] [PubMed] [Google Scholar]
- Dienz O., Rincon M. Clin. Immunol. 2009;130:27–33. doi: 10.1016/j.clim.2008.08.018. [DOI] [PMC free article] [PubMed] [Google Scholar]
- Bazzoni F., Beutler B. N. Engl. J. Med. 1996;334:1717–1725. doi: 10.1056/NEJM199606273342607. [DOI] [PubMed] [Google Scholar]
- Locksley R. M., Killeen N., Lenardo M. J. Cell. 2001;104:487–501. doi: 10.1016/s0092-8674(01)00237-9. [DOI] [PubMed] [Google Scholar]
- Awad A. S., You H., Gao T., Cooper T. K., Nedospasov S. A., Vacher J., Wilkinson P. F., Farrell F. X., Brian Reeves W. Kidney Int. 2015;88:722–733. doi: 10.1038/ki.2015.162. [DOI] [PMC free article] [PubMed] [Google Scholar]
- Rajmani R. S., Singh P. K., Ravi Kumar G., Saxena S., Singh L. V., Kumar R., Sahoo A. P., Gupta S. K., Chaturvedi U., Tiwari A. K. Anim. Biotechnol. 2015;26:112–119. doi: 10.1080/10495398.2014.933741. [DOI] [PubMed] [Google Scholar]
- Ikeda H., Old L. J., Schreiber R. D. Cytokine Growth Factor Rev. 2002;13:95–109. doi: 10.1016/s1359-6101(01)00038-7. [DOI] [PubMed] [Google Scholar]
- Shu G., Yang T., Wang C., Su H., Xiang M. Toxicol. Appl. Pharmacol. 2013;269:270–279. doi: 10.1016/j.taap.2013.02.019. [DOI] [PubMed] [Google Scholar]
- Carbajo-Pescador S., Ordoñez R., Benet M., Jover R., García-Palomo A., Mauriz J. L., González-Gallego J. Br. J. Cancer. 2013;109:83–91. doi: 10.1038/bjc.2013.285. [DOI] [PMC free article] [PubMed] [Google Scholar]
- Willis M. S. and Klauber-DeMore N., in The Molecular Basis of Human Cancer, ed. W. B. Coleman and G. J. Tsongalis, Springer New York, New York, NY, 2017, pp. 197–202. [Google Scholar]
- Folkman J. Semin. Cancer Biol. 1992;3:65–71. [PubMed] [Google Scholar]
- Ferrara N. Oncologist. 2004;9:2–10. doi: 10.1634/theoncologist.9-suppl_1-2. [DOI] [PubMed] [Google Scholar]
- Feng L.-L., Liu B.-X., Zhong J.-Y., Sun L.-B., Yu H.-S. Asian Pac. J. Cancer Prev. 2014;15:737–741. doi: 10.7314/apjcp.2014.15.2.737. [DOI] [PubMed] [Google Scholar]
- Miura H., Miyazaki T., Kuroda M., Oka T., Machinami R., Kodama T., Shibuya M., Makuuchi M., Yazaki Y., Ohnishi S. J. Hepatol. 1997;27:854–861. doi: 10.1016/s0168-8278(97)80323-6. [DOI] [PubMed] [Google Scholar]
- Wang Z., Wei P., Xiang J., Wang H. Cytokine. 2017;96:161–165. doi: 10.1016/j.cyto.2017.04.014. [DOI] [PubMed] [Google Scholar]
- Ding X. L., Man Y. N., Jian H., Zhu C. H., Chang L., Xue Y., Wu X. Z. Biomed Res. Int. 2016;2016:1–9. [Google Scholar]
- Yang F., Li J., Zhu J., Wang D., Chen S., Bai X. Eur. J. Pharmacol. 2015;754:105–114. doi: 10.1016/j.ejphar.2015.02.015. [DOI] [PubMed] [Google Scholar]
Associated Data
This section collects any data citations, data availability statements, or supplementary materials included in this article.


