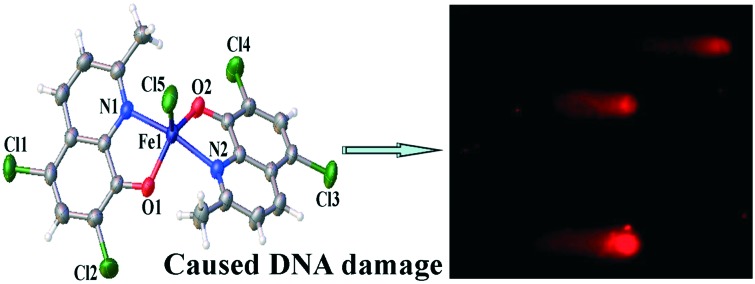
 A new iron(iii) complex with 5,7-dichloro-2-methyl-8-quinolinol (HClMQ) as ligands, i.e., [Fe(ClMQ)2Cl] (1), was synthesized and evaluated for its anticancer activity.
Abstract
A new iron(iii) complex with 5,7-dichloro-2-methyl-8-quinolinol (HClMQ) as ligands, i.e., [Fe(ClMQ)2Cl] (1), was synthesized and evaluated for its anticancer activity. Compared to the HClMQ ligand, complex 1 showed a higher cytotoxicity towards a series of tumor cell lines, including Hep-G2, BEL-7404, NCI-H460, A549, and T-24, with IC50 values in the range of 5.04–14.35 μM. Notably, the Hep-G2 cell line was the most sensitive to complex 1. Mechanistic studies indicated that complex 1 is a telomerase inhibitor targeting c-myc G-quadruplex DNA and can trigger cell apoptosis via inducing cell cycle arrest and DNA damage.
1. Introduction
The G-quadruplex (G4) structure is found not only in telomeres but also in the promoter regions of certain genes, such as c-myc, bcl-2, and c-kit. A number of small molecules that selectively bind and effectively stabilize human telomeric G4s have been reported as potential anticancer agents.1–7 Telomerase, a reverse transcriptase, plays an essential role in telomere maintenance and cancer biology.8,9 G4-interacting agents are telomerase inhibitors, and their direct target is the telomere instead of the telomerase.2,10–12 The design and synthesis of efficient telomerase inhibitors is a viable strategy for developing anticancer drugs.13–16 Recently, the shelterin proteins, TRF1 and TRF2, have received increasing attention for their roles in telomere maintenance and tumorigenesis.17 C-myc is known to influence the elongation of telomeres and it is another important quadrome gene involved in cell senescence.18,19 C-myc also transcriptionally activates hTERT, a catalytic subunit of telomerase.20 The 27-nt long nuclear hypersensitivity element III1 (NHE III1) of the c-myc promoter not only controls 80–90% of the c-myc transcription level but also possesses the potential to form G4 structures18,19 and regulate the transcription of bcl-2, which regulates several key signal transduction cascades to control cell growth and proliferation.20–22 Therefore, characterizing the stability of the c-myc G4 DNA is important for understanding its transcriptional regulation mechanism and for designing new anticancer drugs.
Over the past few decades, the syntheses and biological properties of metal complexes with 8-hydroxyquinoline and its derivatives as ligands have been widely explored in areas such as neurodegenerative diseases, Alzheimer's disease and cancer.23–49 However, there are only a few reported 8-hydroxyquinoline metal complexes reported as G4 ligands.49 In addition, given that iron is one of the most important trace elements in cells, a series of iron(ii) complexes have been reported to efficiently stabilize G4 DNA, inhibit the telomerase activity, and/or regulate gene expression.50–53 However, little is known regarding Fe(iii) complexes with 8-hydroxyquinoline and its derivatives as ligands, and detailed studies on their mechanisms of action are needed.
On the basis of our previous study on 8-hydroxyquinoline platinum(ii) complexes,49 we synthesized a new iron(iii) complex, [Fe(ClMQ)2Cl] (1), with 5,7-dichloro-2-methyl-8-quinolinol (HClMQ) as ligands. This complex was characterized by ESI-MS, UV-vis spectroscopy, elemental analysis, IR spectroscopy, and X-ray crystallography. The molecular mechanism through which complex 1 caused Hep-G2 cell death was investigated. Our results demonstrated that complex 1 inhibited cell proliferation by the induction of cell-cycle arrest at the G2/M-phase. Further investigation into the DNA-binding behaviors of complex 1 showed that it is a telomerase inhibitor that can target c-myc G4 DNA.
2. Results and discussion
2.1. Synthesis
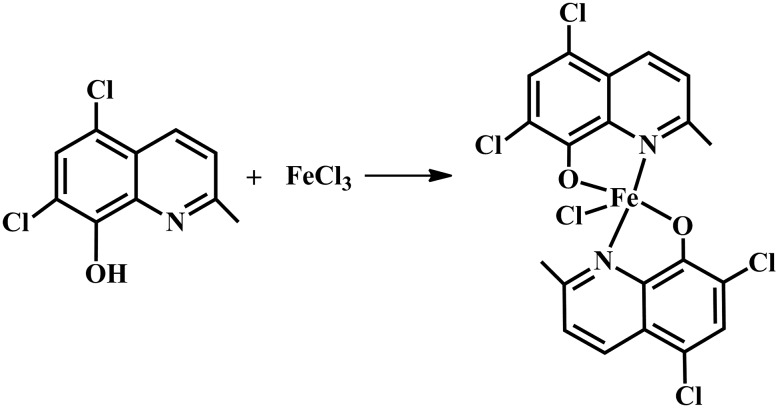
The reaction of HClMQ with FeCl3 in the presence of methanol and CHCl3 (3 : 1) at 80 °C for five days generated complex 1 (Scheme 1). The structure of complex 1 was determined by single-crystal X-ray diffraction analysis, UV-vis spectroscopy, IR spectroscopy, elemental analysis, and ESI-MS (Fig. S1–S3‡).
Scheme 1. Synthetic route of complex 1.
2.2. Crystal structure of complex 1
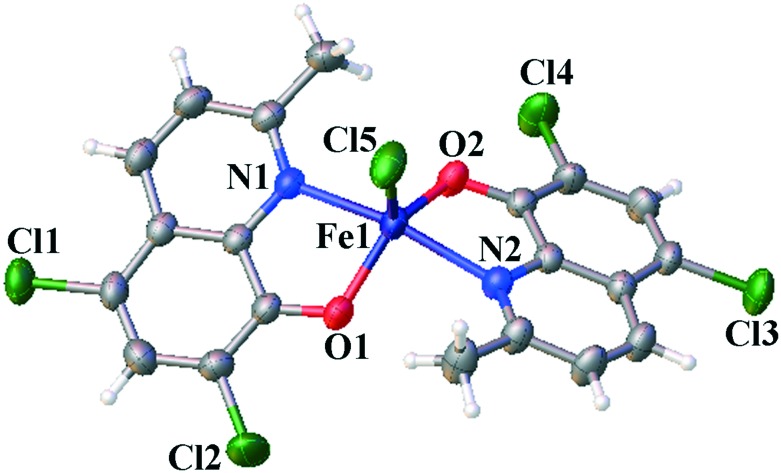
The crystal structure of complex 1 showed that it belongs to a monoclinic crystal system, space group P21/c. The details of the crystallographic data and structure refinement parameters are summarized in Table S1.‡ Selected bond angles and distances are listed in Table S2.‡ As shown in Fig. 1, complex 1 adopts a five-coordinated trigonal bipyramidal or square-based pyramidal geometry. The Fe(iii) atom is coordinated by two HClMQ ligands (O(1), N(1), O(2), and N(2)) and one Cl ligand (Cl(5)). The bite angles (i.e., N(1)–Fe(1)–O(1), N(1)–Fe(1)–Cl(5), and N(2)–Fe(1)–O(2)) of the chelate ring are 96.13(9)°, 96.00(7)° and 96.78(9)°, respectively. The Fe–O distances involving the HClMQ ligands, i.e., 1.898(2) Å and 1.903(2) Å, are substantially shorter than the Fe–N distances (2.146(2) and 2.145(2) Å).
Fig. 1. Crystal structure of complex 1 with atom labeling.
2.3. Stability of complex 1 in aqueous solution
As shown in Fig. S2 and S3,‡ the stability of complex 1 under physiologically relevant conditions (10 mM TBS buffer with 1% DMSO, pH 7.35) was examined using ESI-MS and UV-vis spectroscopy. The time-dependent (in the time course from 0 to 48 h) UV-vis spectra of complex 1 in the TBS buffer are shown in Fig. S3.‡ It is evident that there was almost no change in the spectra of complex 1 over this time course, suggesting that no significant structural change occurred. The results also indicated that the coordination state of the HClMQ ligands to Fe(iii) remained unaltered. As shown in Fig. S2,‡ the ESI-MS analysis of complex 1 dissolved in a TBS buffer containing 5% DMSO showed a maximum abundance of m/z at 588.0 ([FeIII + 2ClMQ + DMSO]+). After a 48 h incubation in the buffer solution, the maximum abundance of complex 1 was found to be unchanged. Moreover, a conductivity experiment was thus carried out for further assessment. As shown in Fig. S4,‡ after the stock solution of Fe(iii) complex 1 (5 μM) and cisplatin (10 μM) were diluted with cellular lysate (Hep-G2 cells) and monitored, the conductivity of cisplatin (10 μM) was observed to increase rapidly, compared with that of the Fe(iii) complex 1 (5 μM) solution. Finally, the conductivity value of the cellular lysate (Hep-G2 cells) of Fe(iii) complex 1 (5 μM) and cisplatin (10 μM) increased by about 2.2 times and 2.5 times in 24 h, respectively. Therefore, it could be concluded that Fe(iii) complex 1 (5 μM) was more stable for 24 h in cellular lysate (Hep-G2 cells) than cisplatin (10 μM), which further supported the stability analysis results of UV-vis spectroscopy and ESI-MS. Taken together, we concluded that complex 1 was stable under physiologically relevant conditions for at least 48 h.
2.4. In vitro cytotoxicity study of complex 1
The in vitro cytotoxicity of HClMQ, FeCl3, complex 1, and cisplatin against five human tumor cell lines (Hep-G2, BEL-7404, NCI-H460, A549, and T-24) and one normal human liver cell line (HL-7702) was assessed using the MTT assay. The inhibitory rates of these compounds are listed in Table S3.‡ After incubation of the cells with each compound (20 μM) for 48 h, different degrees of cell death were observed. Against the tested tumor cells, the inhibitory rates of complex 1 were higher than those of its components, HClMQ and FeCl3. Notably, compared to the scenarios of the tumor cell lines, complex 1 displayed a lower inhibitory rate against the normal liver cell line. The cytotoxicity of HClMQ and complex 1 was further quantified by determining their corresponding IC50 values. As shown in Table 1, against the tested tumor cell lines, complex 1 exhibited significantly lower IC50 values compared to HClMQ. Complex 1 was most sensitive towards the Hep-G2 tumor cell line with an IC50 value of 5.04 ± 0.62 μM, approximately three times lower than that of the positive control, cisplatin. In addition, compared with 8-hydroxyquinoline (H-Q) and 5,7-diiodo-8-hydroxyquinoline (H-IQ) platinum(ii) complexes, Fe(iii) complex 1 exhibited stronger cytotoxicity against NCI-H460, T-24, and A549 tumor cell lines.49
Table 1. IC50 values (μM) a of HClMQ, complex 1 and cisplatin towards selected cell lines.
| Compound | BEL-7404 | NCI-H460 | T-24 | Hep-G2 | A549 | HL-7702 |
| HClMQ | 70.25 ± 1.02 | 75.64 ± 2.01 | 79.36 ± 0.75 | 100.12 ± 0.45 | 115.12 ± 1.56 | 90.52 ± 0.36 |
| Fe(iii) complex 1 | 14.35 ± 0.97 | 7.06 ± 2.41 | 10.42 ± 0.83 | 5.04 ± 0.62 | 6.79 ± 1.74 | 40.18 ± 0.99 |
| FeCl3 | >150.0 | >100.0 | >200.0 | >150.0 | >100.0 | >150.0 |
| Cisplatin b | 15.02 ± 1.12 | 18.48 ± 1.95 | 20.64 ± 1.53 | 14.8 ± 1.11 | 15.77 ± 1.45 | 16.49 ± 1.02 |
aIC50 values are presented as mean ± SD (standard error of the mean) from five independent experiments.
bThe cisplatin solution was prepared by dissolving cisplatin at 1 mM in a water solution containing 0.154 M NaCl.54
2.5. Cellular uptake and distribution of complex 1 in the Hep-G2 cells
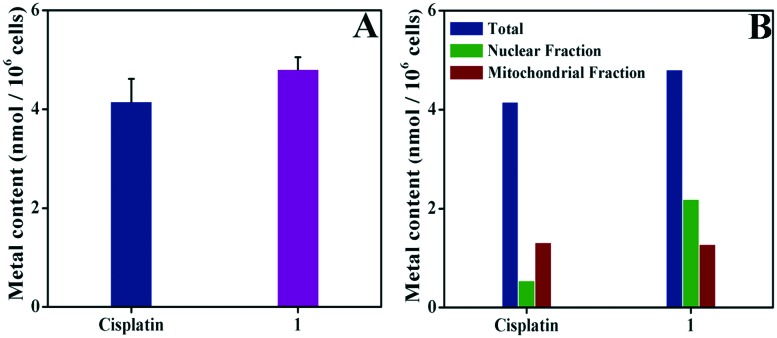
Since complex 1 exhibited the highest cytotoxicity against the Hep-G2 cell line, we selected this cell line for mechanistic studies. Inductively coupled plasma mass spectrometry (ICP-MS) analysis was performed to analyze the cellular uptake and distribution of complex 1 in the Hep-G2 cells. Treatment of the Hep-G2 cells with complex 1 and cisplatin for 24 h resulted in a substantial increase in the cellular concentrations of iron and platinum, suggesting that facile internalization of the complexes occurred within 24 h. As shown in Fig. 2A, complex 1 ((4.807 ± 0.250 nmol Fe) per 106 cells) was taken up by the cells about 1.2 times and 1.4 times more than that of cisplatin ((4.156 ± 0.457 nmol Pt) per 106 cells) and the 8-hydroxyquinoline (H-Q) platinum(ii) complex ((3.360 ± 0.680 nmol Pt) per 106 cells).49
Fig. 2. Cellular uptake and distribution of complex 1 (5 μM) and cisplatin (10 μM) by Hep-G2 cells in 24 h at 37 °C. The metal contents in the whole cell (A) and in different cellular fractions (B) were measured using ICP-MS. The control cells were treated with a vehicle (TBS buffer with 1% DMSO). The data are presented as “mean ± SD” from three independent measurements.
To examine the cellular distribution of complex 1 and cisplatin, the Fe or Pt concentrations in the nuclear fraction and mitochondria fraction of the complex 1-treated Hep-G2 cells were determined according to the reported method from Chen and Schreiber.55–57 As shown in Fig. 2B, complex 1 was accumulated to a high extent in both fractions, whereas cisplatin was mainly accumulated in the mitochondrial fraction. In this study, all the results showed the different effects of the different ligands on the in vitro antitumor activity in the following order H-ClMQ > NH2.49,56–58 In addition, the difference in cellular distribution of Fe(iii) complex 1, cisplatin and the 8-hydroxyquinoline (H-Q) platinum(ii) complex can be attributed to the different cellular pathways involved in the uptake and efflux of all these compounds.49,56–58
2.6. Down-regulation of the transcription and expression of c-myc and hTERT by complex 1
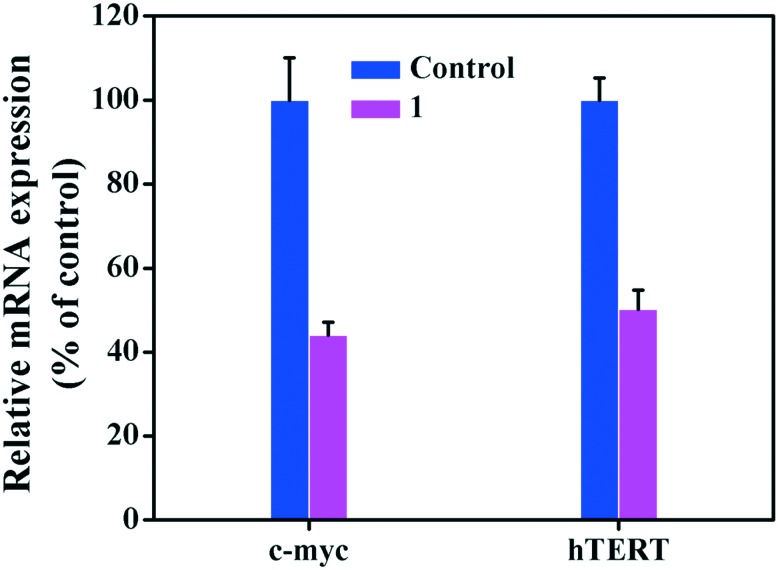
It is well known that hTERT is the key catalytic domain of telomerase and is regulated by the c-myc protein; it is closely related to telomerase functions, including cell proliferation, senescence, and apoptosis.59–61 To examine whether complex 1 can affect the transcription of c-myc and hTERT in the Hep-G2 cells, RT-PCR was performed. As shown in Fig. 3, complex 1 down-regulated the transcription of the c-myc and hTERT genes in the Hep-G2 cells. In order to further confirm the inhibitory effect of complex 1 on the expression of these two genes, western blot analysis was performed. As shown in Fig. 4, the western blot results demonstrated that complex 1 strongly inhibited the expression of c-myc and hTERT in the Hep-G2 cells. Notably, the down-regulation effect of complex 1 on these two targets was more significant than that of cisplatin.58 Comparatively, Fe(iii) complex 1 more effectively down-regulated the c-myc and hTERT expressions than 8-hydroxyquinoline (H-Q) and 5,7-diiodo-8-hydroxyquinoline (H-IQ) platinum(ii) complexes in the western blot assay.49
Fig. 3. qRT-PCR analysis of the expression levels of hTERT and c-myc in the Hep-G2 cells treated with complex 1. The Hep-G2 cells (5 × 10⁵) were treated with complex 1 (5 μM) for 24 h. The total RNA in the cells was extracted and subjected to reverse transcription, followed by PCR for hTERT, c-myc and GAPDH (control).
Fig. 4. Western blot analysis of the expression of hTERT and c-myc bcl-2 in the Hep-G2 cells treated with complex 1 (5 μM) for 24 h. (A) Gel image. (B) Densitometric analysis of the protein bands of hTERT and c-myc (normalized with the β-actin band). The relative expression level of each band is calculated as follows: the density of each band/the density of the β-actin band. Mean ± SD was calculated from three independent measurements.
2.7. Transfection of the Hep-G2 cells with vectors of enhanced green fluorescent protein and c-myc
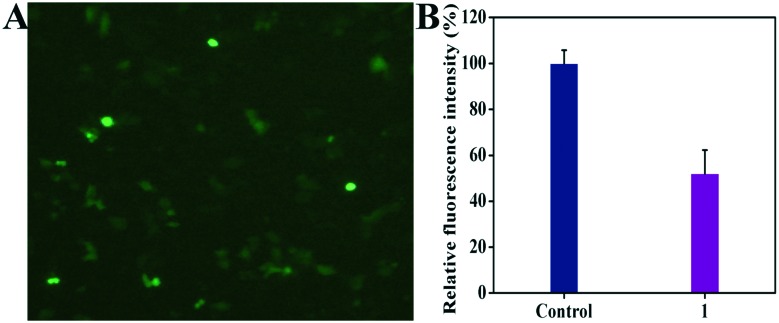
In order to investigate whether complex 1 can directly regulate the c-myc promoter (c-myc G4) and subsequently inhibit the expression of hTERT in the Hep-G2 cells, we constructed plasmid vectors containing the genes of c-myc and EGFP, respectively, according to the methods reported by Chen, Chalfie and He.56–58,62,63 After successful transfection of the Hep-G2 cells with these plasmid vectors, complex 1 was added to the cells, followed by a 24 h incubation. Afterwards, the cells were characterized using fluorescence microscopy and the luciferase reporter gene assay kit. As shown in Fig. 5A, the Hep-G2 cells displayed green fluorescence after EGFP plasmid transfection, indicating that the transfection was successful. After the treatment with complex 1, the cells exhibited a marked decrease in the luciferase units as indicated by the luciferase reporter gene assay (Fig. 5B), suggesting that complex 1 down-regulated the c-myc promoter (c-myc G4). Remarkably, such higher effects of Fe(iii) complex 1 (5 μM) than those of cisplatin (10 μM) and the 8-hydroxyquinoline (H-Q) platinum(ii) complex may correlate with the presence of the ligand H-ClMQ in Fe(iii) complex 1 (5 μM),49,58 which is consistent with the results obtained from RT-PCR and western blot that Fe(iii) complex 1 (5 μM) can down-regulate the transcription of c-myc and hTERT genes in Hep-G2 cells.
Fig. 5. Transfection of the EGFP (A) and c-myc (B) plasmid vectors in the Hep-G2 cells. The EGFP-carrying plasmid vector (2 μg) and the c-myc-carrying plasmid vector (2 μg) were transfected into the Hep-G2 cells using Lipofectamine 2000 (Invitrogen, Grand Island, NY, USA). Complex 1 (5 μM) was then added into the medium 6 h after the transfection. After a 24 h incubation, the cells were imaged using a Nikon TE2000 (Japan) scanning fluorescence microscope (A) and examined using a multimode plate reader and a luciferase reporter gene assay kit (B).
2.8. Telomerase inhibition by complex 1
Many studies have demonstrated that stabilization of G4 by the ligand or by ligand-induced G4 formation at the telomeric G-rich strand can inhibit the activity of telomerase.64,65 Telomerase is overexpressed in 85–90% of human cancer cells but at undetectable levels in most normal somatic cells.66,67 We performed the TRAP silver comet assay68 to investigate the impact of complex 1 on the telomerase activity. As shown in Fig. S5,‡ the number of bands was clearly reduced in the gel image of the Hep-G2 cells treated with complex 1, compared with the control group. The results also revealed that the telomerase inhibitory effect of complex 1 was more significant (inhibitory rate of 53.88%) than that of cisplatin (inhibitory rate of 17.89%)58 and the 8-hydroxyquinoline (H-Q) platinum(ii) complex (inhibitory rate of 52.22%),49 consistent with the aforementioned cytotoxicity results.
2.9. Cell cycle analysis and comet assay
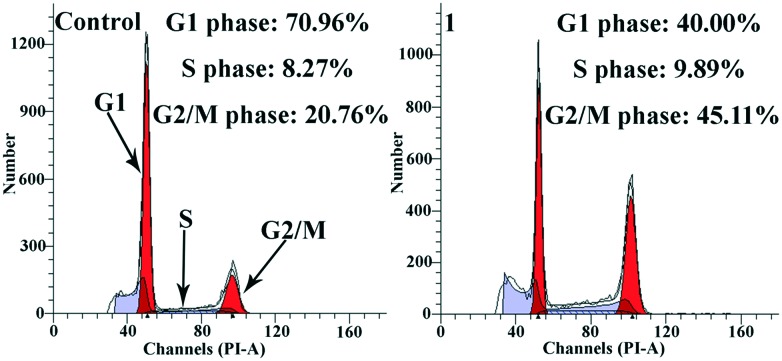
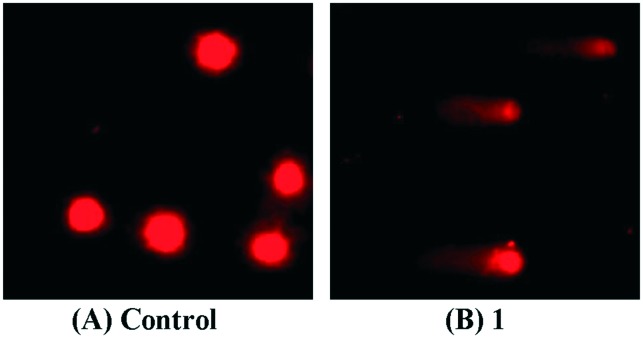
It was reported that the telomerase activity is related to cell cycle entry in tumor cells.69,70 Zakian and Gottschling showed that the activity of telomerase is cell cycle dependent: active in the late S phase and the G2–M phase (the period between S and mitosis) but inactive in the G1 phase (the pre-replicative growth phase of the cell cycle).71,72 Thus, we performed cell cycle analysis on the Hep-G2 cells treated with complex 1. It is evident that complex 1 induced efficient perturbation of the cell cycle and trapped the cells in the G2/M phase. As shown in Fig. 6, the G2/M population was 45.11% of the complex 1-treated cells, significantly higher than the number obtained from untreated cells (20.76%). It is well-known that the characteristic S phase arrest caused by cisplatin suggests that cisplatin acts as a DNA covalent-binding agent to block DNA replication.58 Therefore, our results revealed the difference in the mechanisms of action between complex 1, cisplatin and 8-hydroxyquinoline platinum(ii) complexes (cell cycle arrest at the S phase).49,58 In addition, as shown in Table S4‡ and Fig. 7, treatment of the cells with complex 1 resulted in a longer DNA tail length in the comet assay, indicating that remarkable DNA damage was induced. Taken together, we concluded that complex 1 inhibited Hep-G2 cell growth via the induction of DNA damage that was mediated through cell cycle arrest at the G2/M phase.73,74
Fig. 6. Cell cycle arrest induced by complex 1 (5 μM) in the Hep-G2 cells.
Fig. 7. Complex 1-induced DNA damage in the Hep-G2 cells. The cells were treated with complex 1 (5 μM, B) and 1% DMSO solution (control, A) for 24 h and then analyzed by the comet assay. The length of the tail reflects the degree of DNA damage in cells.
2.10. Cell apoptosis induced by complex 1
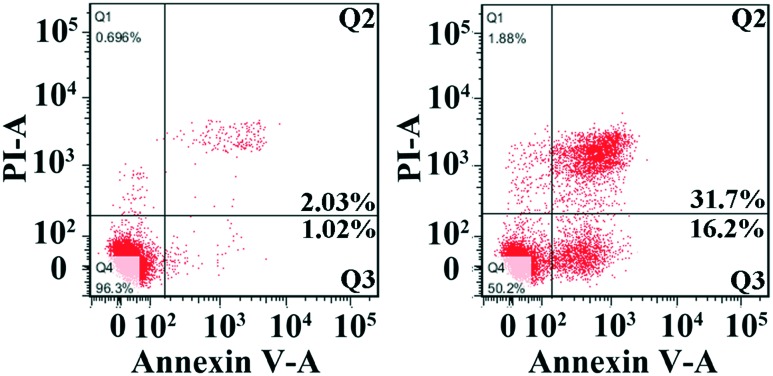
Our aforementioned results showed that complex 1 inhibited telomerase by interacting with c-myc G4 DNA, induced cell cycle arrest at the G2/M phase, caused DNA damage, and probably triggered cell apoptosis as an end result.56–58,75 Therefore, the extent of apoptosis (including early apoptotic cells and late apoptotic cells) in the Hep-G2 cells treated with complex 1 was investigated using flow cytometry.59 As shown in Fig. 8, the cells treated with complex 1 showed a higher percentage of late apoptotic cells (ca. 31.7%) compared to the cells treated with cisplatin (ca. 7.05%), 8-hydroxyquinoline (H-Q) and 5,7-diiodo-8-hydroxyquinoline (H-IQ) platinum(ii) complexes (Q2 + Q3, ca. 20.42% and 27.80%).49,58 In addition, a higher population of nonviable cells (ca. 16.2%) in the early stage of apoptosis was observed among the cells treated with complex 1.
Fig. 8. Apoptosis effect on the Hep-G2 cells treated with complex 1 (5 μM) for 24 h.
3. Experimental methods
3.1. Synthesis and characterization of complex 1
FeCl3 (0.1 mmol), HClMQ (0.2 mmol), methanol (0.9 mL) and CHCl3 (0.3 mL) were placed into a thick Pyrex tube (ca. 25 cm long). The reaction mixture was then quenched in liquid N2, evacuated and sealed. Afterwards, the mixture was heated at 80 °C for five days. The resulting black crystals were used for X-ray diffraction analysis. Reaction yield: 0.0483 g, 88.9%. ESI-MS m/z: 588.0 [M-Cl + DMSO]–. IR (KBr): 3786, 3698, 3660, 3636, 3597, 3532, 3432, 3090, 1630, 1582, 1557, 1477, 1426, 1378, 1331, 1250, 1201, 1162, 1115, 1034, 968, 948, 871 cm–1. Elemental analysis calcd (%) for C20H12Cl5FeN2O2: C 44.04, H 2.22, N 5.14; found: C 43.94, H 2.26, N 5.11.
3.2. X-Ray crystallography
The X-ray diffraction data collection of the single crystals of complex 1 was performed on a Bruker APEX-II or a SuperNova CCD detector coupled with graphite monochromated Mo-Kα radiation (λ = 0.71073 Å) at room temperature. The structures were solved by direct methods and further refined using the SHELX-97 program.76,77 The non-hydrogen atoms were located in successive difference Fourier synthesis. The final refinement was performed using full-matrix least-squares methods with anisotropic thermal parameters for non-hydrogen atoms. The hydrogen atoms were added theoretically riding on the concerned non-hydrogen atoms. The parameters used for data collection and refinement are summarized in Tables S1 and S2‡ together with the crystallization data.
3.3. Biochemical and biological assays
The detailed procedures for other experimental methods are described in the ESI.‡ The materials (including the DNA oligomers used in this work), instrumentation, and methods for the cytotoxicity assay, cellular uptake, comet assay, cell cycle analysis, cell apoptosis analysis, RNA extraction, RT-PCR, western blot and transfection assays were described in our previous work.56–58,75 The TRAP-silver staining assay of Fe(iii) complex 1 (5 μM) was performed as reported by Chao, Chen and Mergny.68,78,79
4. Conclusions
A new iron complex, [Fe(ClMQ)2Cl] (1), with 5,7-dichloro-2-methyl-8-quinolinol (HClMQ) as ligands was synthesized and characterized using various spectroscopic techniques. Complex 1 displayed potent cytotoxicity against human tumor cells compared to normal human cells, indicating that complex 1 was selective towards tumor cells. Further cellular and molecular assays confirmed that the cytotoxic effect of complex 1 originated from its ability to induce apoptosis. In addition, complex 1 was shown to be a telomerase inhibitor targeting c-myc G4 DNA in tumor cells and subsequently triggering cell-cycle arrest at the G2/M-phase. As a result, DNA damage was induced, leading to cell apoptosis.
Supplementary Material
Acknowledgments
This work was supported by the Natural Science Foundation of China (grant No. 21431001, 81473102, 21501032, CMEMR2012-A22), IRT1225, IRT_16R15, the Natural Science Foundation of Guangxi Province of China (grant No. 2016GXNSFAA380300, 2014GXNSFBA118050 and 2016GXNSFGA380005), the basic skill improvement project for young and middle-aged faculty members in Guangxi colleges and universities (KY2016YB595), the State Key Laboratory for the Chemistry and Molecular Engineering of Medicinal Resources (from the Chinese Ministry of Science and Technology, CMEMR2014-B14), the Innovation Project of Guangxi Graduate Education (YCBZ2015024) and the Bagui Scholar Program of Guangxi Province.
Footnotes
†The authors declare no competing interests.
‡Electronic supplementary information (ESI) available: Vendor codes for complex 1, UV-vis, ESI-MS, IR and crystal data. CCDC No. 1518012 for Fe(iii) complex 1 contains the supplementary crystallographic data. CCDC 1518012. For ESI and crystallographic data in CIF or other electronic format see DOI: 10.1039/c6md00644b
References
- Maji B., Bhattacharya S. Chem. Commun. 2014;50:6422–6438. doi: 10.1039/c4cc00611a. [DOI] [PubMed] [Google Scholar]
- Franceschin M., Rizzo A., Casagrande V., Salvati E., Alvino A., Altieri A., Ciammaichella A., Lachettini S., Leonetti C., Ortaggi G., Porru M., Bianco A., Biroccio A. ChemMedChem. 2012;7:2144–2154. doi: 10.1002/cmdc.201200348. [DOI] [PubMed] [Google Scholar]
- Karim N. H. A., Mendoza O., Shivalingam A., Thompson A. J., Ghosh S., Kuimova M. K., Vilar R. RSC Adv. 2014;4:3355–3363. [Google Scholar]
- Pickard A., Liu F., Bartenstein T. F., Haines L. G., Levine K. E., Kucera G. L., Bierbach U. Chem. – Eur. J. 2014;20:16174–16187. doi: 10.1002/chem.201404845. [DOI] [PMC free article] [PubMed] [Google Scholar]
- Muller S., Rodriguez R. Expert. Rev. Clin. Pharmacol. 2014;7:663–679. doi: 10.1586/17512433.2014.945909. [DOI] [PubMed] [Google Scholar]
- Marchand A., Granzhan A., Iida K., Tsushima Y., Ma Y., Nagasawa K., Teulade-Fichou M.-P., Gabelica V. J. Am. Chem. Soc. 2015;137:750–756. doi: 10.1021/ja5099403. [DOI] [PubMed] [Google Scholar]
- Yu Z., Han M., Cowan J. A. Angew. Chem., Int. Ed. 2015;54:1901–1905. doi: 10.1002/anie.201410434. [DOI] [PMC free article] [PubMed] [Google Scholar]
- Wu R. A., Collins K. Proc. Natl. Acad. Sci. U. S. A. 2014;111:11234–11235. doi: 10.1073/pnas.1411276111. [DOI] [PMC free article] [PubMed] [Google Scholar]
- Sandin S., Rhodes D. Curr. Opin. Struct. Biol. 2014;25:104–110. doi: 10.1016/j.sbi.2014.02.003. [DOI] [PMC free article] [PubMed] [Google Scholar]
- Maji B., Kumar K., Kaulage M., Muniyappa K., Bhattacharya S. J. Med. Chem. 2014;57:6973–6988. doi: 10.1021/jm500427n. [DOI] [PubMed] [Google Scholar]
- Gauthier L. R., Granotier C., Hoffschir F., Etienne O., Ayouaz A., Desmaze C., Mailliet P., Biard D. S., Boussin F. D. Cell. Mol. Life Sci. 2012;69:629–640. doi: 10.1007/s00018-011-0767-6. [DOI] [PMC free article] [PubMed] [Google Scholar]
- Salvati E., Scarsella M., Porru M., Rizzo A., Iachettini S., Tentori L., Graziani G., D'Incalci M., Stevens M. F. G., Orlandi A., Passeri D., Gilson E., Zupi G., Leonetti C., Biroccio A. Oncogene. 2010;29:6280–6293. doi: 10.1038/onc.2010.344. [DOI] [PubMed] [Google Scholar]
- Sekaran V., Soares J., Jarstfer M. B. J. Med. Chem. 2014;57:521–538. doi: 10.1021/jm400528t. [DOI] [PubMed] [Google Scholar]
- Biffi G., Tannahill D., McCafferty J., Balasubramanian S. Nat. Chem. 2013;5:182–186. doi: 10.1038/nchem.1548. [DOI] [PMC free article] [PubMed] [Google Scholar]
- Henderson A., Wu Y., Huang Y. C., Chavez E. A., Platt J., Johnson F. B., Brosh Jr R. M., Sen D., Lansdorp P. M. Nucleic Acids Res. 2013:1–10. doi: 10.1093/nar/gkx300. [DOI] [PMC free article] [PubMed] [Google Scholar]
- Cheung I., Schertzer M., Rose A., Lansdorp P. M. Nucleic Acids Res. 2006;34:96–103. doi: 10.1093/nar/gkj417. [DOI] [PMC free article] [PubMed] [Google Scholar]
- Maro S. D., Zizza P., Salvati E., Luca V. D., Capasso C., Fotticchia I., Pagano B., Marinelli L., Gilson E., Novellino E., Cosconati S., Biroccio A. J. Am. Chem. Soc. 2014;136:16708–16711. doi: 10.1021/ja5080773. [DOI] [PubMed] [Google Scholar]
- Sampedro Camarena F., Cano Serral G., Sampedro Santalo F. Clin. Transl. Oncol. 2007;9:145–154. doi: 10.1007/s12094-007-0028-1. [DOI] [PubMed] [Google Scholar]
- Wang X.-D., Ou T.-M., Lu Y.-J., Li Z., Xu Z., Xi C., Tan J.-H., Huang S.-L., An L.-K., Li D., Gu L.-Q., Huang Z.-S. J. Med. Chem. 2010;53:4390–4398. doi: 10.1021/jm100445e. [DOI] [PubMed] [Google Scholar]
- Flores I., Evan G., Blasco M. A. Mol. Cell. Biol. 2006;26:6130–6138. doi: 10.1128/MCB.00543-06. [DOI] [PMC free article] [PubMed] [Google Scholar]
- Yarden Y., Kuang W. J., Yang-Feng T., Coussens L., Munemitsu S., Dull T. J., Chen E., Schlessinger J., Francke U., Ullrich A. EMBO J. 1987;6:3341–3351. doi: 10.1002/j.1460-2075.1987.tb02655.x. [DOI] [PMC free article] [PubMed] [Google Scholar]
- Roskoski R. Biochem. Biophys. Res. Commun. 2005;37:307–315. [Google Scholar]
- Matlack K. E. S., Tardiff D. F., Narayan P., Hamamichi S., Caldwell K. A., Caldwell G. A., Lindquist S. Proc. Natl. Acad. Sci. U. S. A. 2014;111:4013–4018. doi: 10.1073/pnas.1402228111. [DOI] [PMC free article] [PubMed] [Google Scholar]
- Freitas L. B. O., Borgati T. F., Freitas R. P., Ruiz A. L. T. G., Marchetti G. M., Crvalho J. E., Cunha E. F. F., Ramalho T. C., Alves R. B. Eur. J. Med. Chem. 2014;84:595–604. doi: 10.1016/j.ejmech.2014.07.061. [DOI] [PubMed] [Google Scholar]
- Jia X., Yang F.-F., Li J., Liu J.-Y., Xue J.-P. J. Med. Chem. 2013;56:5797–5805. doi: 10.1021/jm400722d. [DOI] [PubMed] [Google Scholar]
- Sengupta K., Chatterjee S., Pramanik D., Dey S. G., Dey A. Dalton Trans. 2014;43:13377–13383. doi: 10.1039/c4dt01991a. [DOI] [PubMed] [Google Scholar]
- Oliveri V., Puglisi A., Viale M., Aiello C., Sgarlata C., Vecchio G., Clarke J., Milton J., Spencer J. Chem. – Eur. J. 2014;19:13946–13955. doi: 10.1002/chem.201300237. [DOI] [PubMed] [Google Scholar]
- Gomes L. M. F., Vieira R. P., Jones M. R., Wang M. C. P., Dyrager C., Souza-Fagundes E. M., Da Silva J. G., Storr T., Beraldo H. J. Inorg. Biochem. 2014;139:106–116. doi: 10.1016/j.jinorgbio.2014.04.011. [DOI] [PubMed] [Google Scholar]
- Bica L., Liddell J. R., Donnelly P. S., Duncan C., Caragounis A., Volitakis I., Paterson B. M., Cappai R., Grubman A., Camakris J., Crouch P. J., White A. R. PLoS One. 2014;9:e90070. doi: 10.1371/journal.pone.0090070. [DOI] [PMC free article] [PubMed] [Google Scholar]
- Ceccom J., Cosldan F., Halley H., Frances B., Lassalle J. M., Meunier B. PLoS One. 2012;7:e43105. doi: 10.1371/journal.pone.0043105. [DOI] [PMC free article] [PubMed] [Google Scholar]
- Core V., Renaud S., Cannie I., Julienne K., Gouin S. G., Loreal O., Gaboriau F., Deniaud D. Bioconjugate Chem. 2014;25:320–334. doi: 10.1021/bc4004734. [DOI] [PubMed] [Google Scholar]
- Oliveri V., Viale M., Caron G., Aiello C., Gangemi R., Vecchio G. Dalton Trans. 2013;42:2023–2034. doi: 10.1039/c2dt32429f. [DOI] [PubMed] [Google Scholar]
- Oliveri V., Viale M., Aiello C., Vecchio G. J. Inorg. Biochem. 2015;142:101–108. doi: 10.1016/j.jinorgbio.2014.09.017. [DOI] [PubMed] [Google Scholar]
- Tang Q., Ni W.-X., Leung C.-F., Man W.-L., Lau K. K.-K., Liang Y., Lam Y.-W., Wong W.-Y., Peng S.-M., Liu G.-J., Lau T.-C. Chem. Commun. 2013;49:9980–9982. doi: 10.1039/c3cc42250j. [DOI] [PubMed] [Google Scholar]
- Santos C. M., Cabrera S., Rios-Luci C., Padron J. M., Solera I. L., Quiroga A. G., Medrano M. A., Navarro-Ranninger C., Aleman J. Dalton Trans. 2013;42:13343–13348. doi: 10.1039/c3dt51720a. [DOI] [PubMed] [Google Scholar]
- Correia I., Adao P., Roy S., Wahba M., Matos C., Maurya M. R., Marques F., Pavan F. R., Leite C. Q. F., Avecilla F., Pessoa J. C. J. Inorg. Biochem. 2014;141:83–93. doi: 10.1016/j.jinorgbio.2014.07.019. [DOI] [PubMed] [Google Scholar]
- Tardito S., Barilli A., Bassanetti I., Tegoni M., Bussolati O., Franchi-Gazzola R., Mucchino C., Marchio L. J. Med. Chem. 2012;55:10448–10459. doi: 10.1021/jm301053a. [DOI] [PubMed] [Google Scholar]
- Barilli A., Atzeri C., Bassanetti I., Ingoglia F., Dall'Asta V., Bussolati O., Maffini M., Mucchino C., Marchio L. Mol. Pharmaceutics. 2014;11:1151–1163. doi: 10.1021/mp400592n. [DOI] [PubMed] [Google Scholar]
- Yang L., Zhang J., Wang C., Qin X., Yu Q., Zhou Y., Liu J. Metallomic. 2014;6:518–531. doi: 10.1039/c3mt00237c. [DOI] [PubMed] [Google Scholar]
- Gobec M., Kljun J., Sosic I., Mlinaric-Rascan I., Ursis M., Gobec S., Turel I. Dalton Trans. 2014;43:9045–9051. doi: 10.1039/c4dt00463a. [DOI] [PubMed] [Google Scholar]
- Liu Y.-C., Chen Z.-F., Song X.-Y., Peng Y., Qin Q.-P., Liang H. Eur. J. Med. Chem. 2013;59:168–175. doi: 10.1016/j.ejmech.2012.11.001. [DOI] [PubMed] [Google Scholar]
- Chen Z.-F., Gu Y.-Q., Song X.-Y., Liu Y.-C., Peng Y., Liang H. Eur. J. Med. Chem. 2013;59:194–202. doi: 10.1016/j.ejmech.2012.10.037. [DOI] [PubMed] [Google Scholar]
- Chen Z.-F., Peng Y., Gu Y.-Q., Liu Y.-C., Liu M., Huang K.-B., Hu K., Liang H. Eur. J. Med. Chem. 2013;62:51–58. doi: 10.1016/j.ejmech.2012.12.030. [DOI] [PubMed] [Google Scholar]
- Chen Z.-F., Wei J.-H., Liu Y.-C., Liu M., Gu Y.-Q., Huang K.-B., Wang M., Liang H. Eur. J. Med. Chem. 2013;68:454–462. doi: 10.1016/j.ejmech.2013.08.007. [DOI] [PubMed] [Google Scholar]
- Liu Y.-C., Wei J.-H., Chen Z.-F., Liu M., Gu Y.-Q., Huang K.-B., Li Z.-Q., Liang H. Eur. J. Med. Chem. 2013;69:554–563. doi: 10.1016/j.ejmech.2013.08.033. [DOI] [PubMed] [Google Scholar]
- Liu Y.-C., Song X.-Y., Chen Z.-F., Gu Y.-Q., Peng Y., Liang H. Inorg. Chim. Acta. 2012;382:52–58. [Google Scholar]
- Zhang H.-R., Liu Y.-C., Meng T., Qin Q.-P., Tang S.-F., Chen Z.-F., Zou B.-Q., Liu Y.-N., Liang H. Med. Chem. Commun. 2015;6:2224–2231. [Google Scholar]
- Qin Q.-P., Chen Z.-F., Qin J.-L., He X.-J., Li Y.-L., Liu Y.-C., Huang K.-B., Liang H. Eur. J. Med. Chem. 2015;92:302–313. doi: 10.1016/j.ejmech.2014.12.052. [DOI] [PubMed] [Google Scholar]
- Meng T., Tang S.-F., Qin Q.-P., Liang Y.-L., Wu C.-X., Wang C.-Y., Yan H.-T., Dong J.-X., Liu Y.-C. Med. Chem. Commun. 2016;7:1802–1811. [Google Scholar]
- Yu H.-J., Wang X.-H., Fu M.-L., Ren J.-S., Qu X.-G. Nucleic Acids Res. 2008;36:5695–5703. doi: 10.1093/nar/gkn569. [DOI] [PMC free article] [PubMed] [Google Scholar]
- Xu Y. Chem. Soc. Rev. 2011;40:2719–2740. doi: 10.1039/c0cs00134a. [DOI] [PubMed] [Google Scholar]
- Ali A., Bhattacharya S. Bioorg. Med. Chem. 2014;22:4506–4521. doi: 10.1016/j.bmc.2014.05.030. [DOI] [PubMed] [Google Scholar]
- Sekaran V., Soares J., Jarstfer M. B. J. Med. Chem. 2014;57:521–538. doi: 10.1021/jm400528t. [DOI] [PubMed] [Google Scholar]
- Cao R., Jia J.-L., Ma X.-C., Zhou M., Fei H. J. Med. Chem. 2013;56:3636–3644. doi: 10.1021/jm4001665. [DOI] [PubMed] [Google Scholar]
- Schreiber E., Matthias P., Mueller M. M., Schaffner W. Nucleic Acids Res. 1989;17:6419. doi: 10.1093/nar/17.15.6419. [DOI] [PMC free article] [PubMed] [Google Scholar]
- Chen Z.-F., Qin Q.-P., Qin J.-L., Liu Y.-C., Huang K.-B., Li Y.-L., Meng T., Zhang G.-H., Peng Y., Luo X.-J., Liang H. J. Med. Chem. 2015;58:2159–2179. doi: 10.1021/jm5012484. [DOI] [PubMed] [Google Scholar]
- Chen Z.-F., Qin Q.-P., Qin J.-L., Zhou J., Li Y.-L., Li N., Liu Y.-C., Liang H. J. Med. Chem. 2015;58:4771–4789. doi: 10.1021/acs.jmedchem.5b00444. [DOI] [PubMed] [Google Scholar]
- Qin J.-L., Qin Q.-P., Wei Z.-Z., Yu C.-C., Meng T., Wu C.-X., Liang Y.-L., Liang H., Chen Z.-F. Eur. J. Med. Chem. 2016;124:417–427. doi: 10.1016/j.ejmech.2016.08.054. [DOI] [PubMed] [Google Scholar]
- Ou T.-M., Lin J., Lu Y.-J., Hou J.-Q., Tan J.-H., Chen S.-H., Li Z., Li Y.-P., Li D., Gu L.-Q., Huang Z.-S. J. Med. Chem. 2011;54:5671–5679. doi: 10.1021/jm200062u. [DOI] [PubMed] [Google Scholar]
- Simonsson T., Henriksson M. Biochem. Biophys. Res. Commun. 2002;290:11–15. doi: 10.1006/bbrc.2001.6096. [DOI] [PubMed] [Google Scholar]
- Postel E. H., Berberich S. J., Flint S. J., Ferrone C. A. Science. 1993;261:478–480. doi: 10.1126/science.8392752. [DOI] [PubMed] [Google Scholar]
- Chalfie M., Tu Y., Euskirchen G., Ward W. W., Prasher D. C. Science. 1994;263:802–805. doi: 10.1126/science.8303295. [DOI] [PubMed] [Google Scholar]
- He T.-C., Sparks A. B., Rago C., Hermeking H., Zawel L., Da Costa L. T., Morin P. J., Vogelstein B., Kinzler K. W. Science. 1998;281:1509–1512. doi: 10.1126/science.281.5382.1509. [DOI] [PubMed] [Google Scholar]
- Ou T.-M., Lu Y.-J., Tan J.-H., Huang Z.-S., Wong K.-Y., Gu L.-Q. ChemMedChem. 2008;3:690–713. doi: 10.1002/cmdc.200700300. [DOI] [PubMed] [Google Scholar]
- Redon S., Reichenbach P., Lingner J. Nucleic Acids Res. 2010;38:5797–5806. doi: 10.1093/nar/gkq296. [DOI] [PMC free article] [PubMed] [Google Scholar]
- Tauchi T., Shin-ya K., Sashida G., Sumi M., Okabe S., Ohyashiki J. H., Ohyashiki K. Oncogene. 2006;25:5719–5725. doi: 10.1038/sj.onc.1209577. [DOI] [PubMed] [Google Scholar]
- Zhou J.-L., Lu Y.-J., Ou T.-M., Zhou J.-M., Huang Z.-S., Zhu X.-F., Du C.-J., Bu X.-Z., Ma L., Gu L.-Q., Li Y.-M., Chan A. S.-C. J. Med.J. Med. Chem.Chem. 2005;48:7315–7321. doi: 10.1021/jm050041b. [DOI] [PubMed] [Google Scholar]
- De Cian A., Cristofari G., Reichenbach P., De Lemos E., Monchaud D., Teulade-Fichou M.-P., Shin-ya K., Lacroix L., Lingner J., Mergny J.-L. Proc. Natl. Acad. Sci. U. S. A. 2007;104:17347–17352. doi: 10.1073/pnas.0707365104. [DOI] [PMC free article] [PubMed] [Google Scholar]
- Holt S. E., Wright W. E., Shay J. W. Mol. Cell. Biol. 1996;16:2932–2939. doi: 10.1128/mcb.16.6.2932. [DOI] [PMC free article] [PubMed] [Google Scholar]
- Zhu X., Kumar R., Mandal M., Sharma N., Sharma H. W., Dhingra U., Sokoloski J. A., Hsiao R., Narayanan R. Proc. Natl. Acad. Sci. U. S. A. 1996;93:6091–6095. doi: 10.1073/pnas.93.12.6091. [DOI] [PMC free article] [PubMed] [Google Scholar]
- Taggart A. K. P., Teng S.-C., Zakian V. A. Science. 2002;297:1023–1026. doi: 10.1126/science.1074968. [DOI] [PubMed] [Google Scholar]
- Diede S. J., Gottschling D. E. Cell. 1999;99:723–733. doi: 10.1016/s0092-8674(00)81670-0. [DOI] [PubMed] [Google Scholar]
- Bartek J., Lukas C., Lukas J. Nat. Rev. Mol. Cell Biol. 2004;5:792–804. doi: 10.1038/nrm1493. [DOI] [PubMed] [Google Scholar]
- Wang B., Matsuoka S. H., Carpenter P. B., Elledge S. J. Science. 2002;298:1435–1438. doi: 10.1126/science.1076182. [DOI] [PubMed] [Google Scholar]
- Qin Q.-P., Qin J.-L., Meng T., Lin W.-H., Zhang C.-H., Wei Z.-Z., Chen J.-N., Liu Y.-C., Liang H., Chen Z.-F. Eur. J. Med. Chem. 2016;124:380–392. doi: 10.1016/j.ejmech.2016.08.063. [DOI] [PubMed] [Google Scholar]
- Sheldrick G. M., SHELXTL-97, Program for refinement of crystal structures, University of Göttingen, Germany, 1997.
- Sheldrick G. M., SHELXS-97, Program for solution of crystal structures, University of Göttingen, Germany, 1997.
- Xu L., Chen X., Wu J., Wang J., Ji L., Chao H. Chem. – Eur. J. 2015;21:4008–4020. doi: 10.1002/chem.201405991. [DOI] [PubMed] [Google Scholar]
- Qin Q.-P., Qin J.-L., Meng T., Yang G.-A., Wei Z.-Z., Liu Y.-C., Liang H., Chen Z.-F. Sci. Rep. 2016;6:37644. doi: 10.1038/srep37644. [DOI] [PMC free article] [PubMed] [Google Scholar]
Associated Data
This section collects any data citations, data availability statements, or supplementary materials included in this article.


