 Saponin from sea cucumber ameliorated high fat diet-induced obesity mainly through inhibiting lipid synthesis and accelerating lipid β-oxidation and glycolysis.
Abstract
Obesity and its comorbidities are considered to be a severe public health problem. Many natural compounds found in food have been proved to ameliorate the metabolic abnormalities induced by obesity. The purpose of this study was to compare the effects of saponin from sea cucumber (SSC) and ginsenoside (SG) on improving the lipid metabolism in C57BL/6 mice fed with a high fat diet. The mice were randomly divided into six groups including a low fat diet group (LF), a high fat diet group (HF), and four dietary intervention groups. The administration of SSC for 8 weeks exhibited a more significant reduction in HF induced fat mass, weight gain, lipid levels in the liver and serum, and serum glucose and insulin levels than SG. Further research indicated that SSC ameliorated high fat diet-induced obesity in C57BL/6 mice mainly through inhibiting lipid synthesis and accelerating lipid β-oxidation and glycolysis in the liver. These results suggested that saponin from sea cucumber might be applied as a food supplement and/or functional ingredient to relieve metabolic disorders induced by obesity.
Introduction
Obesity is becoming a major obstacle in the improvement of human health, which may be due to high calorie diets and low levels of physical activity. Obesity is often associated with various diseases including non-alcoholic fatty liver disease, type II diabetes, hypertension, stroke, arthritis, coronary heart disease, and cancer.1 It has been reported that the prevalence of obesity has doubled in more than 70 countries in the last 30 years and has been increasing in most countries.2 Therefore, it is necessary to control the development of obesity. A certain number of drugs have been used to treat obesity, however, many of them have been found to incite various side effects. Recently, natural active ingredients have attracted researchers' attention due to their low toxicity and side effects.
Ginseng, the root of Panax ginseng C. A. Meyer (Araliaceae), has historically been used to treat various diseases in Asian countries for thousands of years as one of the most popular herbal medicines. Ginsenoside (SG), the major active constituent of ginseng, has been extensively reported to ameliorate many metabolic diseases.3 Lots of studies have revealed that SG could significantly reduce the weight of high fat diet induced obese animal models.4 Sea cucumber is traditional seafood acting as an important medical material in Asian countries, especially in China, Japan, and Korea. There are many bioactive substances isolated from the sea cucumber, including saponins, polysaccharides, cerebrosides and collagen peptides. The saponin from sea cucumber (SSC) is the most important secondary metabolite and bioactive component, which exhibits various biological activities, such as anti-tumor, anti-fungal, anti-angiogenesis, and immunomodulatory effects.5,6 In addition, our previous study found that SSC also had the biological activity of inhibiting dietary fat absorption and improving certain metabolic parameters associated with obesity.7 Both SG and SSC belong to the triterpene glycoside family, consisting of a hydrophobic aglycon and one or several carbohydrate residues. Interestingly, the activities of triterpene glycosides largely depend on the specific features of the aglycon structure, as well as the binding site, monosaccharide composition, and carbohydrate residue length.8 However, few studies focused on the comparative effects of SG and SSC in ameliorating high fat diet-induced obesity. It is necessary to determine the improvements caused by SG and SSC on obesity and clarify the possible underlying mechanisms.
In this study, we compared the effects of SCC and SG on ameliorating obesity-associated metabolic disorders in high-fat diet fed obese male C57BL/6 mice. Further research was performed by examining the key genes involved in the synthesis and lipolysis of fatty acids.
Experimental section
Preparation of SG and SSC
SG was bought from Shaanxi ZhongXin Biotechnology Co., Ltd. (Xi'an, Shaanxi, China). The purity of SG was 80% and the main ingredients were ginsenoside Rb1, ginsenoside Rb2, ginsenoside Rc, ginsenoside Rd, ginsenoside Re, ginsenoside Rf, ginsenoside Rg1, ginsenoside mRb1, ginsenoside mRb2, ginsenoside mRc and ginsenoside GLC-Rc, as described by Wang et al.9 SSC was isolated from Pearsonothuria graeffei using the procedure from our previous study conducted in the lab.10 Briefly, air-dried body walls of Pearsonothuria graeffei were ground into powder and extracted three times with 60% ethanol by refluxing at 70 °C. The filtrates were combined and the ethanol removed under vacuum. After evaporation, the samples were applied to an HP20 resin column and eluted with water, 80% methanol, and 100% methanol in sequence. The fraction eluted with 80% ethanol was collected and the solvent removed under vacuum. The purity of SSC was 80.4%, and the main ingredients were echinoside A and holothurin A according to our previous study.11
Animals and diets
Male C57BL/6 mice, four weeks old, 18–20 g, were purchased from Vital River Laboratory Animal Center (Beijing, China). They were housed in a room maintained with a 12 h light/dark cycle, a constant temperature of 24 ± 2 °C, and a relative humidity of 65 ± 15%. All the mice had free access to water and diet for 5 days prior to the study. All aspects of the experiment were approved by the Animal Ethics Committee of the College of Food Science and Engineering of the Ocean University of China (Qingdao, Shandong, China) (approval no.: SPXY2015012). All the animals were housed at the Laboratory Animal Facility at the Ocean University of China. Animal care was conducted throughout the entire experiment in accordance with the Guide for the Care and Use of Laboratory Animals (8th edition, Institute of Laboratory Animal Resources on Life Sciences, National Research Council, National Academy of Sciences, Washington DC). After the adaptation period, the mice were randomly divided into six groups (eight rats in each group) including the LF group fed with a low fat diet; the HF group fed with a high fat diet; the 0.02% SSC group fed with a high fat diet plus 0.02% SSC; the 0.08% SSC group fed with a high fat diet plus 0.08% SSC; the 0.02% SG group fed with a high fat diet plus 0.02% SG; and the 0.08% SG group fed with a high fat diet plus 0.08% SG. The diets for each experimental group used in the study were designed based on AIN-93G, and their compositions are shown in Table S1. The body weights were recorded every 2 days, and food intake was measured every day throughout the experiment. The mice were sacrificed after overnight fasting on the 56th day of the experiment. Serum was separated from whole blood by centrifugation at 7500 rpm for 10 min at 4 °C. The liver, epididymal adipose tissue, perirenal adipose tissue, subcutaneous adipose tissue, kidneys and heart were quickly collected, weighed, frozen in liquid nitrogen, and stored at –80 °C until analysis.
Oral glucose tolerance test
After 50 days of feeding, an oral glucose tolerance test (OGTT) was performed after overnight fasting by orally administering 2 g per kg body weight of 0.2 g mL–1d-glucose. The glucose concentration was measured with a OneTouch Basic glucose monitor (LifeScan) as the baseline before glucose administration. After administering a standardized glucose dose to all the animals, blood samples were collected from the tail vein at 0, 30 and 120 min to assay the blood glucose level, and the areas under the curve of glucose were calculated.
Serum and liver lipid determination
The serum was decanted and stored at 4 °C after centrifuging the blood sample at 1500g for 10 min. Hepatic lipids were extracted with chloroform–methanol (2 : 1) according to the method of Folch et al.,12 and then dissolved using Triton X-100. TG and TC concentrations in the serum and liver were determined using enzymatic reagent kits from Biosino (Beijing, China) according to the manufacturer's instructions.
Biochemical analyses of serum samples
The measurements of serum insulin and adiponectin were performed using enzyme-linked immunosorbent assay (ELISA) (Invitrogen). According to the following formula, the homeostatic model assessment for insulin resistance (HOMA-IR) was calculated from the insulin and glucose values:13 HOMA-IR = fasting glucose (mmol L–1) × fasting insulin (mU L–1)/22.5.
RNA purification and quantitative real time PCR
The messenger RNA (mRNA) levels of related genes were measured by real time-polymerase chain reaction (RT-PCR). For analysis of gene expression, total RNA was extracted from 100 mg of frozen liver samples with a Trizol reagent (Invitrogen, USA). One μg of total RNA was used for cDNA synthesis using a random primer (TOYOBO, Japan). The concentration of cDNA was analyzed by real-time detection PCR (ABI Prism 7500 Sequence Detection System, USA) using a Sybr Green I Master Mix (TOYOBO, Japan). The gene expression was determined by relative quantification using the standard curve method. The final melting curve guaranteed the authenticity of the target product. The expression signal of the housekeeping gene β-actin served as the internal control for normalization, and the relative mRNA expression in the HF group was set to 100. The primer sequences used for real-time PCR are shown in Table S2.
Statistical analyses
All the values in the tables and figures are expressed as mean ± standard error. All statistical analyses were performed by one-way analysis of variance with Tukey's post hoc test using the SPSS software. P < 0.05 was considered statistically significant. The graphs were made using the Prism 5 software (Graph-Pad Software, Inc., San Diego, CA, USA). Different letters indicate significant differences between each group.
Results and discussion
Effects of SSC and SG on food intake, caloric intake and body weight
During the 8 week study period, the total food intake of all mice fed with a high fat diet was similar, which was less than that of mice fed with a low fat diet (Table 1). Interestingly, the body weight gain of mice in the HF group was significantly higher than that in the LF group, indicating a successful obesity model (Table 1). Both SSC and SG could effectively inhibit the high fat diet induced weight gain, in which SSC was superior to SG. In particular, 0.08% SSC could decrease the high fat diet induced weight gain by 56.4%, while the inhibition rate of 0.08% SG was only 37.9%.
Table 1. Effects of SSC and SG on body weight gain and visceral weight in mice.
| Parameters | Experimental groups |
|||||
| LF | HF | 0.02% SSC | 0.08% SSC | 0.02% SG | 0.08% SG | |
| Food intake (g d–1) | 4.18 ± 0.03 | 3.37 ± 0.06* | 3.28 ± 0.04 | 3.18 ± 0.03 | 3.21 ± 0.05 | 3.22 ± 0.03 |
| Initial body weight (g) | 19.40 ± 0.48 | 18.93 ± 0.93 | 19.06 ± 0.50 | 19.54 ± 0.44 | 19.97 ± 0.35 | 19.58 ± 0.31 |
| Final body weight (g) | 27.70 ± 0.87 | 34.64 ± 0.68**a | 29.16 ± 1.11b | 26.39 ± 0.53c | 32.08 ± 0.70a,b | 28.93 ± 1.18b |
| Body weight gain (g) | 8.30 ± 0.50 | 15.70 ± 0.90**a | 10.10 ± 0.76b | 6.85 ± 0.47c | 12.10 ± 0.42a,b | 9.75 ± 0.35b |
| Liver (g per 100 g BW) | 3.63 ± 0.05 | 3.22 ± 0.08a | 3.34 ± 0.12a | 3.45 ± 0.13a | 3.21 ± 0.08a | 3.23 ± 0.07a |
| Heart (g per 100 g BW) | 1.17 ± 0.04 | 1.13 ± 0.07a | 1.21 ± 0.03a | 1.31 ± 0.04a | 1.24 ± 0.03a | 1.31 ± 0.04a |
| Kidneys (g per 100 g BW) | 0.51 ± 0.01 | 0.41 ± 0.02a | 0.43 ± 0.02a | 0.47 ± 0.01a | 0.41 ± 0.02a | 0.45 ± 0.01a |
Effects of SSC and SG on adipose tissues and visceral weight
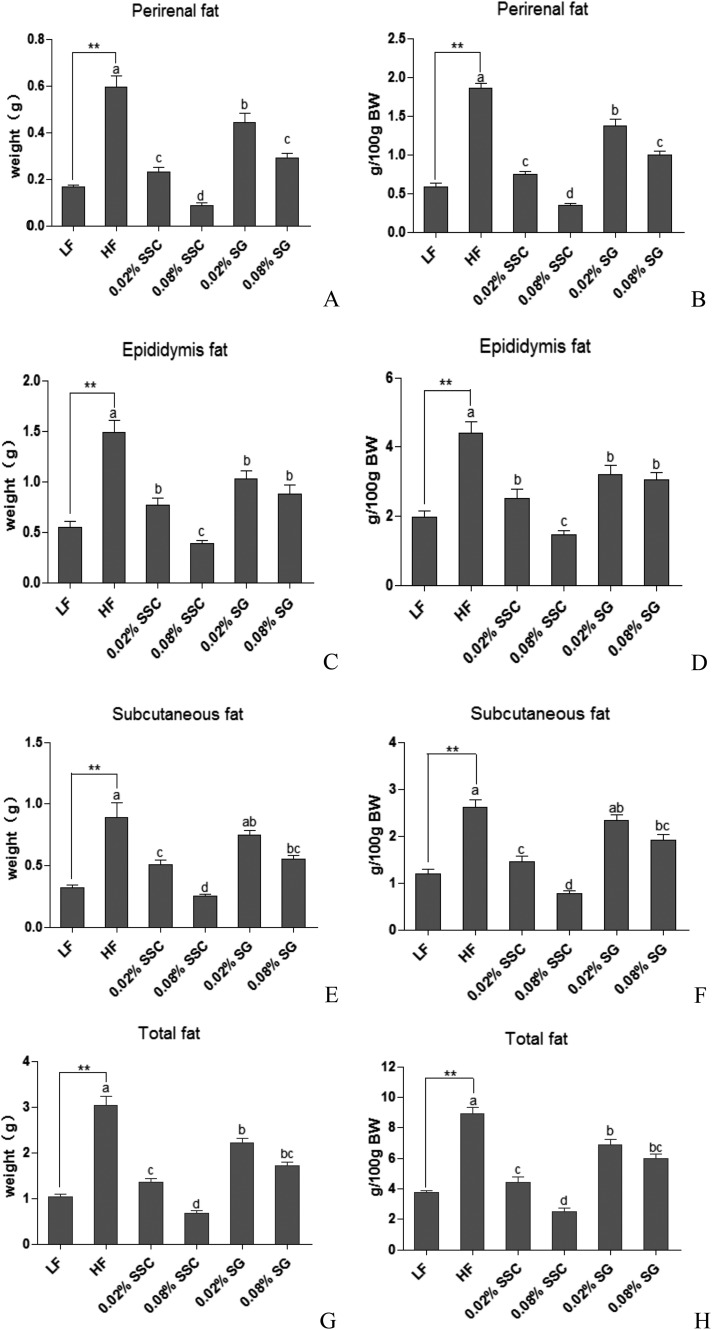
A high fat diet could significantly increase the weight of adipose tissues including perirenal, epididymal, subcutaneous and total fat compared with a low fat diet, which further verified the successful obesity model (Fig. 1). When mice were fed with high fat diets containing SSC and SG, a significant reduction was observed in the weight of the adipose tissues and total fat in a concentration-dependent manner, in which the effect of SSC was better than that of SG. Notably, the improvement caused by 0.08% SSC was close to or even better than that of the LF group (Fig. 1).
Fig. 1. Effects of SSC and SG on perirenal fat (A and B), epididymis fat (C and D), subcutaneous fat (E and F) and total fat (G and H). Values are presented as mean ± SEM (standard error of the mean, n = 8). **P < 0.01 are considered statistically significant compared with the LF group. Different letters indicate significant difference among groups fed with a high-fat diet (P < 0.05). BW, body weight.
The organ index refers to the ratio of the organ weight to the body weight of the experimental animal. Results indicated that the organ index of the liver, heart and kidneys was decreased in the HF group compared with that in LF mice, which might be attributed to the increase of body weight (Table 1). Importantly, both SSC and SG could improve the organ index to different degrees, suggesting that the reduction of body weight might be attributed to the decrease of fat accumulation rather than the internal organs, which was consistent with previous studies.14
Effects of SSC and SG on plasma lipid levels
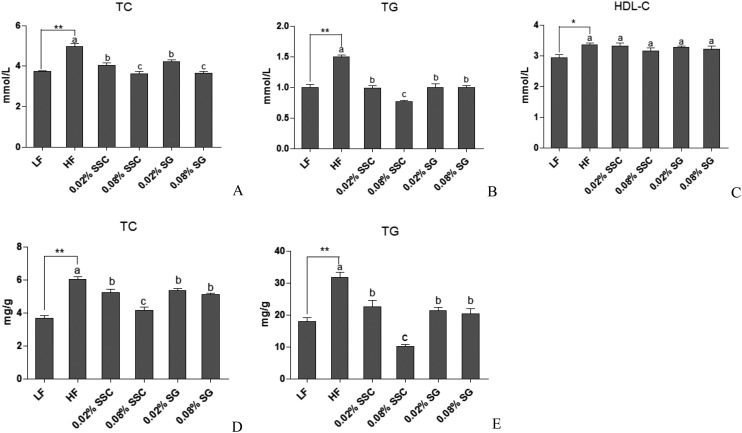
It has been confirmed that obesity is associated with dyslipidemia characterized by increasing the serum total cholesterol (TC) and triglyceride (TG) concentrations. Compared to the LF group, the HF diet increased the serum TC and TG levels by 33.5% and 49.4%, respectively (Fig. 2A and B). Notably, both SSC and SG exhibited lower serum lipid levels in the HF group, in which 0.08% SSC exhibited excellent improvement in serum TC and TG. Interestingly, SSC decreased the serum lipid levels in a dose-dependent manner, while SG did not.
Fig. 2. Effects of SSC and SG on plasma and hepatic lipid levels. A: serum TC, B: serum TG, C: serum HDL-C, D: hepatic TC, E: hepatic TG. Values are presented as mean ± SEM (standard error of the mean, n = 8). *P < 0.05 and **P < 0.01 are considered statistically significant compared with the LF group. Different letters indicate significant difference among groups fed with a high-fat diet (P < 0.05).
There is a close connection between the severity of coronary artery atherosclerosis and increased plasma concentrations of TC and TG as well as the plasma TC/HDL-C ratio.15 Administration of a HF diet for 8 weeks significantly increased the HDL-C concentration in serum compared with LF mice. However, SSC and SG treatments did not change the serum HDL-C levels (Fig. 2C). Moreover, the TC/HDL-C ratios of the LF group, HF group, 0.02% SSC group, 0.08% SSC group, 0.02% SG group and 0.08% SG group were calculated to be 1.24 ± 0.05, 1.50 ± 0.06, 1.25 ± 0.09, 1.17 ± 0.06, 1.29 ± 0.03 and 1.14 ± 0.03, respectively. HF mice exhibited a higher TC/HDL-C ratio (increase by 17.3%) in comparison with LF mice, indicating that the mice fed with a HF diet were more susceptible to atherosclerosis. Interestingly, both SSC and SG had lower TC/HDL-C ratios than HF mice, which suggested that they could suppress atherosclerosis.
In this study, both SSC and SG could inhibit the weight gain of mice and reduce the blood lipid concentration without affecting the food intake, indicating that they could improve the lipid metabolism, thereby reducing the occurrence of cardiovascular diseases. Moreover, SSC exhibited better effects than SG in a dose dependent manner.
Effects of SSC and SG on hepatic lipid levels
The liver is one of the most vital organs in energy metabolism. Most plasma apolipoproteins, endogenous lipids and lipoproteins are synthesized in the liver. However, a high intake level of fat would break the homeostasis of lipid and lipoprotein metabolism,14 which may induce non-alcoholic fatty liver disease and other metabolic diseases. Thus, we compared the hepatic lipid levels of all the groups.
The hepatic TC and TG contents of the HF group were 20% and 66% higher than those of LF mice, respectively (Fig. 2D and E), suggesting that the model was built successfully. Administration of SSC caused a remarkable reduction in TC and TG accumulation, which was better than SG. Notably, the inhibition rates of 0.08% SSC on hepatic TC and TG contents were 31% and 68.2%, respectively (Fig. 2D and E). Leal-Díaz et al.16 also showed that mice fed with a HF diet had severe hepatic fat accumulation, which could be decreased by saponins extracted from Agave salmiana in a dose-dependent manner.
Effects of SSC and SG on the OGTT and serum glucose and insulin levels
It has been previously demonstrated17 that HF diet-fed mice could develop glucose intolerance and insulin resistance compared with LF diet-fed mice due to the alterations in insulin signaling and the increase of the systemic inflammatory response. Hyperinsulinemia has been shown to be associated with adverse changes in the levels of cardiovascular risk factors including lipids, lipoproteins, and blood pressure.18 Thus, the plasma glucose concentration was measured after oral glucose administration, and the serum glucose and insulin levels were measured after overnight fasting to estimate the insulin resistance and impaired insulin secretion.
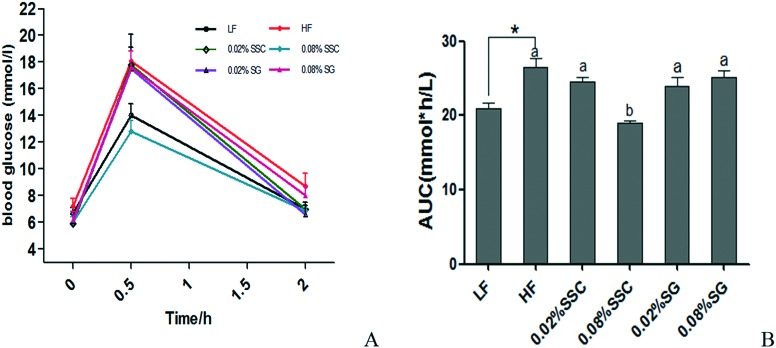
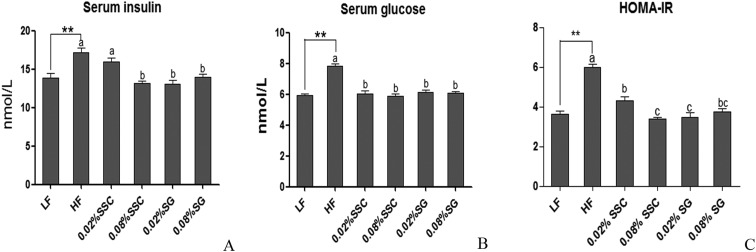
During the OGTT, the peak of the serum glucose level appeared at 0.5 h after oral administration of glucose (2 g per kg BW) in all groups, which was consistent with a previous study.14 Interestingly, the peak level of HF mice (18.1 ± 1.0 mmol L–1) was about 1.3-fold higher than that of LF mice (14.0 ± 0.9 mmol L–1), and dietary 0.08% SSC (12.8 ± 0.8 mmol L–1) could significantly decrease the high fat diet induced high concentration of plasma glucose at 0.5 h after oral glucose administration (Fig. 3A). Moreover, the blood glucose levels of LF mice and HF mice at 2 h were 7.0 and 8.7 mmol L–1, respectively, and the levels in other groups were similar to that of the LF group except for 0.08% SG (8.0 ± 0.7 mmol L–1). There was a significant increase in the area under the curve (AUC) value of mice fed with a HF diet in comparison with that of the LF group, and 0.08% SSC treatment could decrease the AUC value (Fig. 3B). As shown in Fig. 4, the HF diet significantly increased the serum insulin level, glucose concentration and HOMA-IR value, implying the development of insulin resistance. After supplementation with SSC and SG for 56 days, the insulin resistance induced by the HF diet was relieved at different degrees. Obesity is often associated with type 2 diabetes characterized by insulin resistance and impaired glucose tolerance. After being fed with the high fat diet for 8 weeks, impaired glucose tolerance was observed in obese mice, accompanied by an increase in serum insulin levels. Dietary SSC could effectively improve impaired glucose tolerance and insulin resistance, which was superior to SG.
Fig. 3. Glucose tolerance test (A) and area under the curve (B) of C57BL/6 mice fed with experimental diets. An oral glucose tolerance test (2 g kg–1) was performed for 50 days. *P < 0.05 is considered statistically significant compared with the LF group. Different letters indicate significant difference among groups fed with a high-fat diet (P < 0.05).
Fig. 4. Effects of SSC and SG on serum insulin (A), glucose (B) and HOMA-IR (C) in mice fed with each diet for 56 days. P < 0.05 and **P < 0.01 are considered statistically significant compared with the LF group. Different letters indicate significant difference among groups fed with a high-fat diet (P < 0.05). HOMA-IR (homeostatic model assessment for insulin resistance) = fasting glucose (mmol L–1) × fasting insulin (mU L–1)/22.5.
Effects of SSC and SG on adiponectin levels in serum
Adiponectin is exclusively expressed and secreted from adipose tissue. Plasma adiponectin levels have also been reported to be reduced in obese humans, and are correlated closely with obesity, insulin resistance, or cardiovascular diseases.19,20 It was found that adiponectin could regulate the glucose and lipid metabolism by increasing insulin sensitivity and fatty acid β-oxidation,21 thus, it has recently been expected to be a novel target for the treatment of diabetes and the metabolic syndrome. Moreover, the relative adiponectin level is usually used to evaluate the ability of white adipose tissue to secrete adiponectin, which was calculated by adjusting the serum adiponectin level with the total white adipose tissue weight. The adiponectin level and relative adiponectin level in serum were determined using ELISA kits in our study.
Results showed that the HF diet exhibited a remarkable decrease in the adiponectin concentration and relative adiponectin level in comparison with mice fed with the low fat diet. Importantly, SSC could significantly increase the levels of adiponectin and relative adiponectin in serum in a dose-dependent manner, while SG had no effect on the adiponectin level compared with the HF group (Table 2), which was consistent with a previous study. Nagao et al. also proved that conjugated linoleic acid could enhance the plasma adiponectin level and alleviate hyperinsulinemia and hypertension in Zucker diabetic fatty rats.22
Table 2. Effects of SSC and SG on adiponectin levels in mice (n = 8).
| Groups | Serum adiponectin (μg L–1) | Relative adiponectin (μg per L per g WAT)* |
| LF | 14.47 ± 0.56 | 3.47 ± 0.14 |
| HF | 12.65 ± 0.44b | 1.52 ± 0.06**c |
| 0.02% SSC | 15.50 ± 1.30a,b | 2.91 ± 0.32b |
| 0.08% SSC | 16.61 ± 0.87a | 5.72 ± 0.36a |
| 0.02% SG | 12.79 ± 1.27b | 1.56 ± 0.19c |
| 0.08% SG | 13.10 ± 0.86a,b | 1.85 ± 0.14c |
Effects of SSC and SG on the expression of hepatic genes involved in lipid metabolism
The above results showed that consumption of SSC exhibited better effects on improving glucose tolerance, lipid metabolism and serum adiponectin levels than SG. It is necessary to illustrate the possible underlying mechanism involved by measuring gene expression. Therefore, we selected the high doses of SSC and SG (0.08%) to perform further experiments to explore gene expression related to the lipid and glucose metabolism.
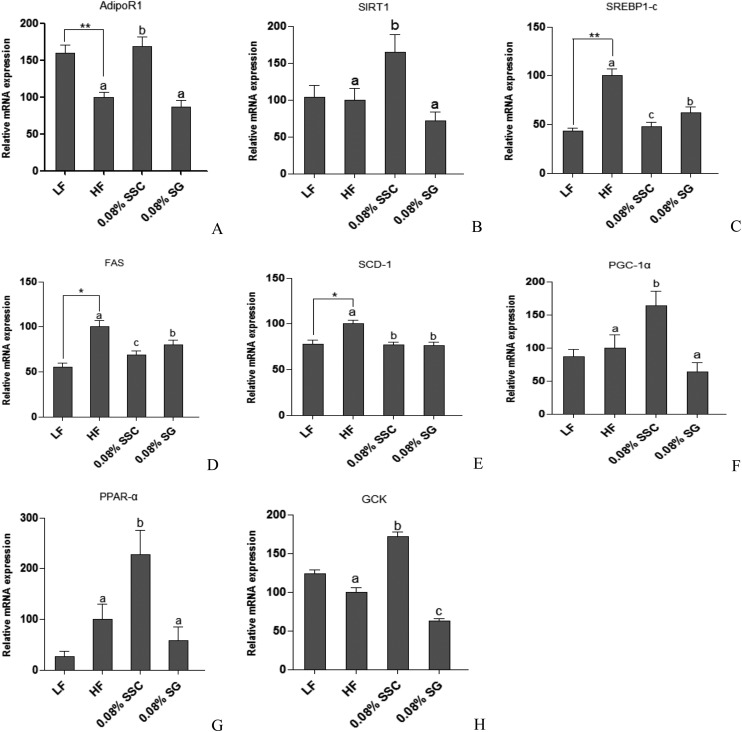
One of the functions of adiponectin receptor-1 (AdipoR1) is to sensitize and increase the magnitude of insulin signaling on target cells, promoting energy homeostasis and glucose uptake.23 Sirtuin 1 (SIRT1), an NAD+-dependent protein deacetylase, is an important regulator of energy homeostasis in response to nutrient availability.24 It has been reported that the expression of SIRT1 was stimulated by adiponectin, and the impaired adiponectin–SIRT1–AMPK signaling pathway contributed to the development of the alcoholic fatty liver disease.25 The main lipogenic enzymes including fatty acid synthase (FAS) and stearoyl-CoA desaturase-1 (SCD-1) are mediated by sterol regulatory element-binding protein-1c (SREBP-1c), which is a member of the basic helix–loop–helix/leucine zipper family of transcription factors.26 It was reported that the expressions of SREBP-1c, SCD-1, and FAS were suppressed by SIRT1 activator treatment at both mRNA and protein levels.27,28 Previous studies have also demonstrated that SIRT1 overexpression increased the level of peroxisome proliferator activated receptor (PPAR)-α29 and its coactivator peroxisome proliferator-activated receptor-γ co-activator 1α (PGC-1α),30 resulting in the stimulation of hepatic fatty acid oxidation.27,31 In the present study, the HF group showed a significantly decreasing trend in AdipoR1 mRNA expression in comparison with the LF group, and SSC rather than SG could obviously up-regulate the mRNA expression of AdipoR1 (Fig. 5A). Though the SIRT1 mRNA expression level was decreased slightly in the HF group compared with the LF group, SSC rather than SG could effectively increase its expression level (Fig. 5B). We found that administration of a high-fat diet for eight weeks markedly increased the mRNA expression of hepatic SREBP-1c and its target lipogenic genes FAS and SCD-1 (Fig. 5C–E). Meanwhile, SSC and SG prevented the high-fat diet induced stimulation of SREBP-1c together with its downstream genes, in which SSC was superior to SG. Moreover, SSC also exhibited better effects on promoting the PPAR-α and PGC-1α expressions than SG (Fig. 5F and G). Those changes resulted in a low rate of lipid synthesis and quick fatty acid oxidation, thereby leading to the decreased accumulation and output of TC and TG in the liver. Yen et al.32 explored the effects of pre-germinated brown rice on the high-fat diet-induced metabolic syndrome in C57BL/6J mice. They found that the HF group gained more weight and have higher blood glucose and lipid levels, higher liver levels of TC and TG, lower adipose adiponectin and PPAR-α levels, and higher liver SREBP-1c, SCD-1, and FAS levels. Treatment of pre-germinated brown rice effectively decreased the high-fat diet-induced body weight by reducing the SREBP-1, FAS and SCD-1 levels and increasing the PPAR-α and adiponectin levels in mice with the metabolic syndrome, which was consistent with our results. The liver is a metabolic workhorse that performs a diverse array of biochemical functions, which is necessary for whole-body metabolic homeostasis. In particular, dietary fat is digested and stored in the liver, and then processed into very-low-density lipoproteins (VLDL) by combining with apolipoprotein B-100. VLDL are complex lipoprotein particles and secreted into the systemic circulation, which provides an important mechanism for converting water-insoluble TG into a water-soluble form that can be exported from the liver and delivered to peripheral tissues.33 SSC could suppress the release of TC and TG from the liver to extrahepatic tissues via inhibiting lipid synthesis and accelerating fatty acid β-oxidation, thereby limiting the growth of adipose tissue and the increase of body weight.
Fig. 5. Effects of SSC and SG on the expression of hepatic genes including AdipoR1 (A), SIRT1 (B), SREBP-1c (C), FAS (D), SCD-1 (E), PGC-1α (F), PPAR-α (G), and GCK (H) involved in the lipid and glucose metabolism. *P < 0.05 and **P < 0.01 are considered statistically significant compared with the LF group. Different letters indicate significant difference among groups fed with a high-fat diet (P < 0.05).
The liver plays a vital role in maintaining glucose and lipid homeostasis. The major factor causing hyperglycemia in diabetics is the failure of insulin to increase hepatic glucose utilization and suppress hepatic endogenous glucose production.34 Glucokinase (GCK), mainly in hepatocytes and pancreatic β-cells, is the key enzyme responsible for the regulation of glucose utilization, which catalyzes glucose phosphorylation in the first step of glycolysis.35 Li et al. found that the mRNA level of GCK was increased 3-fold in the liver of SIRT1-injected mice.36 Our results indicated that the HF group showed a remarkable decrease in hepatic GCK mRNA expression. Notably, supplementation with SSC significantly increased the mRNA expression level, indicating that SSC could effectively regulate the activity of enzymes involved in hepatic glucose homeostasis, leading to the reduction of the blood glucose level and promotion of hepatic insulin sensitivity (Fig. 5H). Jung et al.37 found that supplementation with persimmon leaves could significantly decrease the fasting blood glucose level and HOMA-IR index in db/db mice, accompanied by an increased transcriptional level of GCK in the liver, which was consistent with our present study.
Conclusion
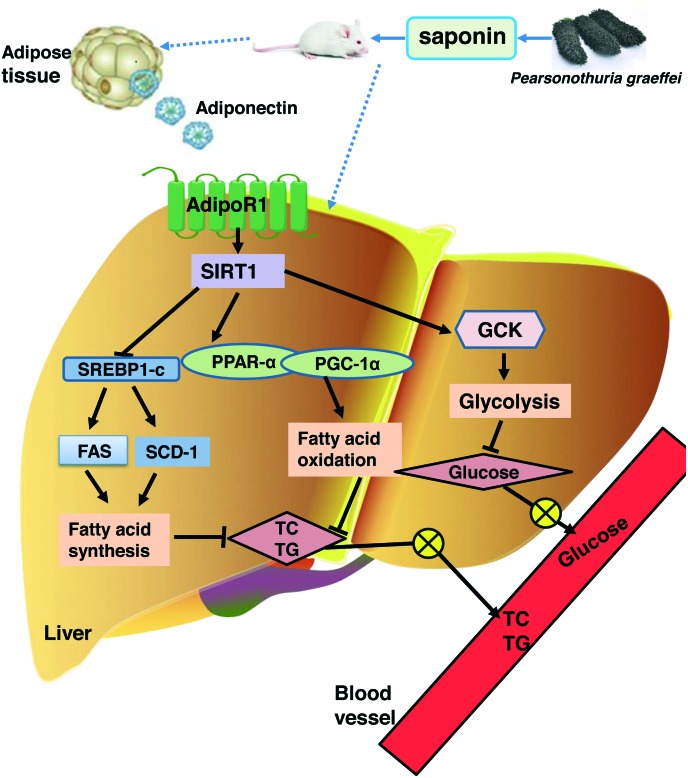
In this study, we firstly demonstrated that dietary saponin from sea cucumber exhibited better effects on decreasing adipose tissue weight, blood glucose, and lipids in the serum and liver than ginsenoside. Further research showed that saponin from sea cucumber improved the lipid and glucose metabolism mainly by promoting the release of adiponectin, thereby influencing SIRT1 signaling and its downstream genes SREBP-1c, FAS, SCD-1, PGC-1α, PPAR-α and GCK to inhibit lipid synthesis and accelerate fatty acid β-oxidation as well as the glycolysis pathway (Fig. 6). All these findings demonstrate that SSC is superior to SG in improving certain metabolic parameters associated with obesity, and provide the valuable references for the development of a dietary supplement containing sea cucumber saponin.
Fig. 6. The improvement caused by saponin from sea cucumber in high fat diet-induced obesity in C57BL/6 mice and the possible underlying mechanism.
Conflicts of interest
There are no conflicts of interest to declare.
Supplementary Material
Acknowledgments
This work was supported by the State Key Program of the National Natural Science of China (Grant No. 31330060), the National Natural Science Foundation of China (NSFC)-Shandong Joint Fund for Marine Science Research Centers (U1606403), and the Fundamental Research Funds for the Central Universities (No. 201762028).
References
- Luppino F. S., de Wit L. M., Bouvy P. F., Stijnen T., Cuijpers P., Penninx B. W., Zitman F. G. Arch. Gen. Psychiatry. 2010;67:220. doi: 10.1001/archgenpsychiatry.2010.2. [DOI] [PubMed] [Google Scholar]
- Collaborators G. O., Afshin A., Forouzanfar M. H., Reitsma M. B., Sur P., Estep K., Lee A., Marczak I., Mokdad A. H., Moradi-Lakeh M. N. Engl. J. Med. 2017;377:13. [Google Scholar]
- Jee H. S., Chang K. H., Park S. H., Kim K. T., Paik H. D. Food Rev. Int. 2014;30:91–111. [Google Scholar]
- Lee H., Kim M., Shin S. S., Yoon M. J. Ethnopharmacol. 2014;155:1342–1352. doi: 10.1016/j.jep.2014.07.034. [DOI] [PubMed] [Google Scholar]
- Zhao Q., Xue Y., Wang J. F., Li H., Long T. T., Li Z., Wang Y. M., Dong P., Xue C. H. J. Sci. Food Agric. 2012;92:965–974. doi: 10.1002/jsfa.4678. [DOI] [PubMed] [Google Scholar]
- Caulier G., Dyck S. V., Gerbaux P., Eeckhaut I. and Flammang P., SPC Beche-de-mer Information Bulletin, 2011, vol. 31, pp. 48–54. [Google Scholar]
- Hu X., Li Z., Xue Y., Xu J., Xue C., Wang J., Wang Y. J. Med. Food. 2012;15:909. doi: 10.1089/jmf.2011.2042. [DOI] [PubMed] [Google Scholar]
- Kai M., Leipold D., Scheller M. C., Haas C., Steingroewer J., Bley T., Neuhaus H. E., Mirata M. A., Schrader J., Ulber R. Process Biochem. 2011;46:1–15. [Google Scholar]
- Wan J. B., Lai C. M., Li S. P., Lee M. Y., Kong L. Y., Wang Y. T. J. Pharm. Biomed. Anal. 2006;41:274. doi: 10.1016/j.jpba.2005.10.023. [DOI] [PubMed] [Google Scholar]
- Wen M., Cui J., Xu J., Xue Y., Wang J., Xue C., Wang Y. J. Physiol. Biochem. 2014;70:801–808. doi: 10.1007/s13105-014-0349-9. [DOI] [PubMed] [Google Scholar]
- Song S., Cong P., Xu J., Li G., Liu X., Li Z., Xue C., Xue Y., Wang Y. J. Funct. Foods. 2016;25:62–69. [Google Scholar]
- Folch J., Lees M., Stanley G. H. S. J. Biol. Chem. 1957;226:497–509. [PubMed] [Google Scholar]
- Mlinar B., Marc J., Janez A., Pfeifer M. Clin. Chim. Acta. 2007;375:20. doi: 10.1016/j.cca.2006.07.005. [DOI] [PubMed] [Google Scholar]
- Liu X., Yong X., Liu C., Lou Q., Wang J., Yanagita T., Xue C., Wang Y. Lipids Health Dis. 2013;12:1–10. doi: 10.1186/1476-511X-12-109. [DOI] [PMC free article] [PubMed] [Google Scholar]
- Ford C. S., Rd C. J., Howard G., Toole J. F., Ball M. R., Frye J. Ann. Neurol. 1985;17:301. doi: 10.1002/ana.410170314. [DOI] [PubMed] [Google Scholar]
- Leal-Díaz A. M., Noriega L. G., Torre-Villalvazo I., Torres N., Alemán-Escondrillas G., López-Romero P., Sánchez-Tapia M., Aguilar-López M., Furuzawa-Carballeda J., Velázquez-Villegas L. A., Avila-Nava A., Ordáz G., Gutiérrez-Uribe J. A., Serna-Saldivar S. O., Tova A. R. Sci. Rep. 2016;6:34242. doi: 10.1038/srep34242. [DOI] [PMC free article] [PubMed] [Google Scholar]
- Papaetis G. S., Papakyriakou P., Panagiotou T. N. Arch. Med. Sci. 2015;11:463–482. doi: 10.5114/aoms.2015.52350. [DOI] [PMC free article] [PubMed] [Google Scholar]
- Stephan Wueest R. A. R., Schumann Desiree M., Rytka Julia M., Schildknecht Anita, Nov Ori, Chervonsky Alexander V., Rudich Assaf, Schoenle Eugen J., Donath Marc Y., Konrad Daniel. J. Clin. Invest. 2010;120:191–202. doi: 10.1172/JCI38388. [DOI] [PMC free article] [PubMed] [Google Scholar]
- Guenther M., James R., Marks J., Zhao S., Szabo A., Kidambi S. Transl. Res. 2014;164:270–277. doi: 10.1016/j.trsl.2014.04.008. [DOI] [PMC free article] [PubMed] [Google Scholar]
- Arita Y., Kihara S., Ouchi N., Takahashi M., Maeda K., Miyagawa J.-i., Hotta K., Shimomura I., Nakamura T., Miyaoka K., Kuriyama H., Nishida M., Yamashita S., Okubo K., Matsubara K., Muraguchi M., Ohmoto Y., Funahashi T., Matsuzawa Y. Biochem. Biophys. Res. Commun. 2012;425:560–564. doi: 10.1016/j.bbrc.2012.08.024. [DOI] [PubMed] [Google Scholar]
- von Frankenberg A. D., do Nascimento F. V., Gatelli L. E., Nedel B. L., Garcia S. P., de Oliveira C. S. V., Saddi-Rosa P., Reis A. F., Canani L. H., Gercehman F. Diabetol. Metab. Syndr. 2014;6:26–34. doi: 10.1186/1758-5996-6-26. [DOI] [PMC free article] [PubMed] [Google Scholar]
- Nagao K., Inoue N., Wang Y. M., Yanagita T. Biochem. Biophys. Res. Commun. 2003;310:562–566. doi: 10.1016/j.bbrc.2003.09.044. [DOI] [PubMed] [Google Scholar]
- Lee C. H., Hung Y. J. J. Diabetes Invest. 2015;6:264–266. doi: 10.1111/jdi.12263. [DOI] [PMC free article] [PubMed] [Google Scholar]
- Zhao L., Cen F., Tian F., Li M. J., Zhang Q., Shen H. Y., Shen X. C., Zhou M. M., Du J. Exp. Ther. Med. 2017;14:5942–5948. doi: 10.3892/etm.2017.5331. [DOI] [PMC free article] [PubMed] [Google Scholar]
- Shen Z., Liang X., Rogers C. Q., Rideout D., You M. Am. J. Physiol.: Gastrointest. Liver Physiol. 2010;298:G364–G374. doi: 10.1152/ajpgi.00456.2009. [DOI] [PMC free article] [PubMed] [Google Scholar]
- Knebel B., Haas J., Hartwig S., Jacob S., Koellmer C., Nitzgen U., Muller-Wieland D., Kotzka J. PLoS One. 2012;7:e31812. doi: 10.1371/journal.pone.0031812. [DOI] [PMC free article] [PubMed] [Google Scholar]
- Colak Y., Ozturk O., Senates E., Tuncer I., Yorulmaz E., Adali G., Doganay L., Enc F. Y. Med. Sci. Monit. 2011;17:HY5–HY9. doi: 10.12659/MSM.881749. [DOI] [PMC free article] [PubMed] [Google Scholar]
- Yamazaki Y., Usui I., Kanatani Y., Matsuya Y., Tsuneyama K., Fujisaka S., Bukhari A., Suzuki H., Senda S., Imanishi S., Hirata K., Ishiki M., Hayashi R., Urakaze M., Nemoto H., Kobayashi M., Tobe K. Am. J. Physiol.: Endocrinol. Metab. 2009;297:E1179–E1186. doi: 10.1152/ajpendo.90997.2008. [DOI] [PubMed] [Google Scholar]
- Evans R. M., Barish G. D., Wang Y. X. Nat. Med. 2004;10:355–361. doi: 10.1038/nm1025. [DOI] [PubMed] [Google Scholar]
- Fernandez-Marcos P. J., Auwerx J. Am. J. Clin. Nutr. 2011;93:884S–890S. doi: 10.3945/ajcn.110.001917. [DOI] [PMC free article] [PubMed] [Google Scholar]
- Purushotham A., Schug T. T., Xu Q., Surapureddi S., Guo X., Li X. Cell Metab. 2009;9:327–338. doi: 10.1016/j.cmet.2009.02.006. [DOI] [PMC free article] [PubMed] [Google Scholar]
- Shen K.-P., Hao C.-L., Yen H.-W., Chen C.-Y., Wu B.-N., Lin H.-L. J. Clin. Biochem. Nutr. 2015;56:28–34. doi: 10.3164/jcbn.14-50. [DOI] [PMC free article] [PubMed] [Google Scholar]
- Iozzo P. Ann. N. Y. Acad. Sci. 2015;1353:21–40. doi: 10.1111/nyas.12880. [DOI] [PubMed] [Google Scholar]
- Michael M. D., Kulkarni R. N., Postic C., Previs S. F., Shulman G. I., Magnuson M. A., Kahn C. R. Mol. Cell. 2000;6:87–97. [PubMed] [Google Scholar]
- Pal M. Drug Discovery Today. 2009;14:784–792. doi: 10.1016/j.drudis.2009.05.013. [DOI] [PubMed] [Google Scholar]
- Li Y., Xu S., Giles A., Nakamura K., Lee J. W., Hou X., Donmez G., Li J., Luo Z., Walsh K., Guarente L., Zang M. FASEB J. 2011;25:1664–1679. doi: 10.1096/fj.10-173492. [DOI] [PMC free article] [PubMed] [Google Scholar]
- Jung U. J., Park Y. B., Kim S. R., Choi M.-S. PLoS One. 2012;7:e49030. doi: 10.1371/journal.pone.0049030. [DOI] [PMC free article] [PubMed] [Google Scholar]
Associated Data
This section collects any data citations, data availability statements, or supplementary materials included in this article.


