

Abstract
Butyrate is a short chain fatty acid present in a high concentration in the gut lumen. It has been well documented that butyrate, by serving as an energetic metabolite, promotes the proliferation of normal colonocytes while, by serving as a histone deacetylase inhibitor, epigenetically suppressing the proliferation of cancerous counterparts undergoing the Warburg effect. However, how butyrate interrupts the metabolism of colorectal cancer cells and ultimately leads to the suppression of cell proliferation remains unclear. Here, we employed a metabolomics-proteomics combined approach to explore the link between butyrate-mediated proliferation arrest and cell metabolism. A metabolomics study revealed a remodeled metabolic profile with pronounced accumulation of pyruvate, decreased glycolytic intermediates upstream of pyruvate and reduced levels of nucleotides in butyrate-treated HCT-116 cells. Supplementation of key metabolite intermediates directly affected cancer-cell metabolism and modulated the suppressive effect of butyrate in HCT-116 cells. By a Drug Affinity Responsive Target Stability (DARTS)-based quantitative proteomics approach, we revealed the M2 isoform of a pyruvate kinase, PKM2, as a direct binding target of butyrate. Butyrate activates PKM2 via promoting its dephosphorylation and tetramerization and thereby reprograms the metabolism of colorectal cancer cells, inhibiting the Warburg effect while favoring energetic metabolism. Our study thus provides a mechanistic link between PKM2-induced metabolic remodeling and the antitumorigenic function of butyrate and demonstrates a widely applicable approach to uncovering unknown protein targets for small molecules with biological functions.
Keywords: Metabolomics, Drug targets, Target identification, Mass Spectrometry, Colorectal cancer, Proliferation, Butyrate, Drug Affinity Responsive Target Stability (DARTS), Metabolic reprogramming, Pyruvate kinase M2, Quantitative proteomics
Butyrate is a short-chain fatty acid (SCFA) 1 produced by the fermentation of dietary fiber via microbiota in the lumen of the colon. It is usually present at a high concentration (>10 mm) in the colon and uptaken into the epithelium cells of the colon via a monocarboxylate transporter (1). Butyrate then serves as the primary energy source (∼70%) for colonocytes by undergoing ß-oxidation in mitochondria and supports metabolic homeostasis (2). In contrast to its role in fueling normal colonocytes, recent studies have shown that butyrate exhibits an antitumorigenic function by inhibiting the proliferation or inducing the apoptosis of colorectal cancer cells (3, 4) and several other cancer cells such as breast cancer cells, medulloblastoma cells, and prostate cancer cells (5–7).
Although complicated, previous research generally attributed the cancer suppressive effect of butyrate to its functioning as a G-protein coupled receptor (GPR) 109a ligand or a histone deacetylase (HDAC) inhibitor (8–11). As an HDAC inhibitor, specifically, butyrate regulates the expression of various cell fate-related genes, such as Fas and Wnt10B, while also mediating FOXO3-dependent expression of Gadd45b, Cdkn1a, and Cdkn1c, subsequently leading to inhibited proliferation and apoptosis in colorectal cancer cells (10, 12).
The intriguing characteristics of butyrate in stimulating the normal growth of noncancerous colonocytes while inhibiting cancer colonocytes is referred to as “the butyrate paradox” (13). Cancer cells, unlike their normal counterparts, are known to undergo the Warburg effect and preferentially use glucose instead of butyrate as the energy source, which favors their survival and rapid growth (14, 15). The reprogrammed metabolic pattern adapts cancer cells to a hypoxic microenvironment and proliferation-required biomass accumulation by regulating the expression levels and activities of key enzymes involved in cancer metabolism (10, 16). It has been previously proposed that butyrate fuels the tricarboxylic-acid cycle (TCA cycle) in normal colonocytes but accumulates in cancerous colonocytes undergoing the Warburg effect, thereby functioning as an HDAC inhibitor to inhibit the proliferation of colorectal cancer cells. However, the direct mechanistic link between metabolic adaptation and proliferative suppression by butyrate remains elusive. Because the continuous and rapid proliferation of cancer cells depends on the capacity of metabolic reprogramming (17, 18), we reason that the proliferation-suppressive effect of butyrate might be directly connected with its capability of regulating the metabolism of cancerous colonocytes. It is possible that butyrate exerts differential influences on the metabolism between normal cells and their cancerous counterparts, which thereby explains the “butyrate paradox.” We thus sought to explore the mechanistic relationship between butyrate-inhibited colorectal cancer cell proliferation and their corresponding metabolic programs and to identify potential protein targets mediating such a link.
In this regard, a high-resolution mass spectrometry (HRMS)-based metabolomic technique was employed to probe the metabolic changes in HCT-116 cells elicited by butyrate. Metabolomics data revealed butyrate-mediated metabolic remodeling and underlined the significantly perturbed metabolic pathways, providing clues to the protein targets responsible for butyrate-induced suppressive proliferation. Subsequently, a target identification approach was employed to uncover the binding proteins of butyrate and reveal whether any of those are involved in the butyrate-affected metabolism. Because of the simple structure of butyrate, we employed a derivatization-free proteomics approach, namely, drug affinity responsive target stability (DARTS), to characterize the protein targets of butyrate instead of conventional affinity-based methods that require the derivatization of butyrate (19, 20). In contrast with the conventional DARTS approach that directly assigns the in-gel digested drug-stabilizing protein of highest abundance as the target, we employed a label-free quantitative proteomics approach and spiked in a coeluting exogenous protein as an internal standard (IS) for reliable and accurate quantitation of in-gel digested target proteins. The combined utility of the biomics approach thus allows for identifying butyrate-bound proteins as potential targets mediating cancerous cell proliferation.
Here, with the metabolism-guided proteomics approach, we found that, upon butyrate treatment, pronounced elevation of pyruvate and decreased levels of other glycolytic intermediates upstream of pyruvate were noted in HCT116 cells. The DARTS-based quantitative proteomics results and biochemical assays both suggested that butyrate binds to and activates pyruvate kinase isoform 2 (PKM2), which is subsequently responsible for reversing the metabolic advantages gained by cancerous colonocytes and ultimately leads to proliferation arrest. Our study thus provides a mechanistic perspective by linking PKM2-mediated metabolic remodeling with the antitumorigenic function of butyrate.
MATERIALS AND METHODS
Experimental Design and Statistical Rationale
We first validated the inhibitory effect of butyrate on the proliferation of colorectal cancer cells using HCT116, HT29 and LoVo cell lines. Cell viability was determined via cell counting kit-8 (CCK-8) using increasing doses of butyrate. For each condition, five independent biological replicates were used. Next, we evaluated the capability of butyrate in reprogramming cell metabolism via metabolomics. Five independent biological replicate experiments were performed. For subsequent determination of potential targets of butyrate via a DARTS assay, lysates of HCT116 cells were incubated with butyrate, digested by Pronase, and separated by SDS-PAGE. Proteins showing higher stability upon butyrate binding were visualized by densitometry after Coomassie blue staining (three independent biological replicates). To reliably quantify proteins from the targeted bands, we spiked an exogenous protein in each lysate sample as an IS and separated the IS-spiked samples by SDS-PAGE followed by excision, in-gel digestion and LC-MS analysis. The label-free proteomics approach was employed to quantify the identified proteins from the specific protein bands collected across four samples including the control sample and three butyrate-treated samples of different doses (three biological replicates). Relative quantitative analysis indicated potential target proteins of butyrate that showed significantly increased abundance in a butyrate dose-dependent manner. The target proteins identified via the proteomics approach were further confirmed by immunoblotting (n = 3, biological replicates). For the determination of cell proliferation via BrdU cell proliferation kits, cells were seeded and treated in 96-well plates (n = 4, biological replicates). The data are presented as the mean ± standard error of the mean (S.E.). Statistical differences between two groups were determined by Student's t-test, whereas comparisons among three or more groups were analyzed by one-way ANOVA followed by the Tukey-Kramer test. p < 0.05 was considered statistically significant.
Reagents and Cell Lines
Sodium butyrate, hypoxanthine, sodium pyruvate, l-serine, shikonin, ADP, NADH, PEP, lactate dehydrogenase (LDH) and protease inhibitor mixture were purchased from Sigma-Aldrich (St. Louis, MO). TEPP-46 was purchased from Merck Millipore (Darmstadt, Germany). Unless indicated, other chemical reagents were all obtained from Sinopharm Chemical Reagents (Shanghai, China). Human colorectal cancer cell lines HCT116, HT29 and LoVo were all purchased from ATCC (Manassas, VA), among which the HCT116 and HT29 cells were cultured in McCoy's 5A medium (Sigma-Aldrich), and LoVo cells were cultured in DMEM/F12 medium (GIBCO, Gland Island, NY). Media were all supplemented with 10% fetal bovine serum (FBS, Biological Industries, Kibbutz, Israel), 100 unit/ml penicillin and 1 μg/ml streptomycin, and cells were maintained in a humidified incubator with 5% CO2 at 37 °C.
Immunoblotting Experiments
Cells were lysed on ice with NP-40 buffer (Beyotime, Jiangsu, China) supplemented with a 1% protease inhibitor mixture. The total protein concentration was quantified with a bicinchoninic acid (BCA) assay kit (Beyotime) for normalization of each sample. Cell lysates were then loaded and separated on 8–12% SDS-PAGE and transferred onto polyvinylidene difluoride (PVDF) membranes. The immunoblots were blocked by 5% nonfat milk and incubated with the indicated primary-antibody solution at 4 °C overnight followed by incubation with peroxidase-conjugated secondary antibodies. The resulting bands were detected using chemiluminescent reagents on a ChemiDoc XRS system (Bio-Rad, Hercules, CA), and the relative quantification of selected bands was accomplished by densitometry via ImageLab (Bio-Rad). Details of the antibodies are provided in supplemental Table S1, Supporting Information (SI).
Pyruvate Kinase Activity Assay
The activity of pyruvate kinase (PK) was determined by LDH-dependent conversion of NADH to NAD+. Cells were lysed with NP-40 lysis buffer supplemented with a 1% protease inhibitor mixture. The total protein concentration was determined by a BCA assay kit and diluted to 1 μg/μl with lysis buffer. A 200 μl reaction mixture consisting of 50 mm Tris-HCl (pH = 7.5), 5 mm MgCl2, 100 mm KCl, 1 mm ADP, 0.5 mm PEP, 0.2 mm NADH and 8 units of LDH was added to 5 μg cell lysate in each well in 96-well plates. Upon brief mixing, samples were measured at 37 °C with an interval of 10 s until the OD340 value was constant. The fluorescent intensity at 100 s was recorded and used to calculate the PK activity using the following equation: Activity (U/μl) = (A0 s – A100 s) × 200/6.22 × 100 × 5.
Drug Affinity-Responsive Target Stabilization assay and Proteomics Analysis
Approximately 1×10⁷ of untreated colorectal cancer cells were lysed with NP-40 lysis buffer for 30 min at 4 °C. Sodium butyrate dissolved in 1× TNC buffer (50 mm Tris, 50 mm NaCl, 10 mm CaCl2, pH = 7.4) was added into the cell lysate (500 μg total protein, 5 mg/ml) to reach the indicated concentrations and gently mixed. The lysates were then placed at room temperature for 2 h to allow sufficient ligand-protein target interactions, and then digested by Pronase (Roche, Basel, Swiss, dissolved in 1× TNC buffer) at a 1:500 ratio (wt/wt) for precisely 30 min. Proteolysis was quenched by mixing the lysate with 4× loading buffer (Bio-Rad) and 5 min of boiling. Predenatured bovine serum albumin (BSA) was aliquoted, and then spiked into each sample to reach an equal concentration of 15 μg/ml in each sample, which subsequently serves as an IS for the quantitative analysis of target proteins (Fig. 4A).
Fig. 4.

Drug affinity responsive target stability (DARTS)-proteomics technique and immunoblotting experiments reveal pyruvate kinase as butyrate's binding target. A, A schematic workflow of target identification for butyrate via the DARTS-based proteomics approach and immunoblotting experiments. B, SDS-PAGE analysis of Pronase-digested cell lysate followed by Coomassie blue staining identified a butyrate-stabilized protein within the ∼60 kDa gel band, and relative quantification of the abundance was determined by densitometry (n = 3). C, Quantification of PKM2 abundance levels from the in-gel digested bands shown in (B) via the label-free proteomics approach (n = 3). BSA was used as the IS protein. D, MS/MS spectrum of a representative unique peptide of pyruvate kinase M (PKM2 as the dominant form). E, Immunoblotting results validated that PKM2 became less susceptible to Pronase digestion following incubation with butyrate. GAPDH was used as a control for normalization of the PKM2 abundance in immunoblotting experiments (n = 3). F, SDS-PAGE analysis of the Pronase-digested recombinant PKM2 protein followed by Coomassie blue staining. Data are presented as the mean ± S.E., *p < 0.05, **p < 0.01.
For the DARTS assay of recombinant PKM2 protein, the protein was diluted with 1× TNC buffer to 100 μg/ml. Subsequently, 10 μg of the protein lysate was incubated with butyrate at the indicated concentrations at room temperature for 2 h, followed by digestion with Pronase at a 1:750 ratio (wt/wt) for 30 min. Proteolysis was quenched by mixing the lysate with 4× loading buffer and 5 min of boiling. The production of recombinant PKM2 protein is detailed in the Supporting Methods.
The resulting samples were separated by SDS-PAGE for the visualization of target proteins. The SDS-PAGE separated gel was stained by Coomassie blue, and the images were captured by the ChemiDoc XRS system. Gel bands that displayed significant abundance changes following butyrate incubation were manually excised, destained, reduced, alkylated and in-gel digested by sequencing-grade trypsin (Promega, Madison, WI).
The digests were then extracted and desalted on C18 Ziptips (Millipore, Milford, MA), vacuum dried, and reconstituted in water containing 0.1% formic acid. An online nanoACQUITY UPLC system coupled-SYNAPT G2-Si mass spectrometer (Waters, Manchester, UK) was used for LC-MS/MS analysis. A trapping column (Acquity UPLC M-Class 0.18×20 mm, 5 μm 100 Å, C18, Waters) and analytical column (Acquity UPLC M-Class 0.075×150 mm, 1.8 μm HSS T3, Waters) were employed. Mobile phases A and B consist of 0.1% (v/v) formic acid in water and 0.1% (v/v) formic acid in acetonitrile, respectively. A 90 min-length gradient of 1–40% acetonitrile at a flow rate of 300 nL/min was used for separation. The scan time of MS was set as 0.2 s, the full MS scan range was set to 350–1500 m/z with a scan time of 0.2 s, and MS/MS scan range was set to 50–2000 m/z. The top 10 abundant precursors were subjected to MS/MS fragmentation with a ramp CE set between low energy (14–19 eV) and elevated energy (60–90 eV) using a scan time of 0.15 s per function.
PEAKS Studio version 8.5 (Bioinformatics Solution, Inc., Waterloo, ON, Canada) was used for the generation of peaks and identification of protein from MS/MS spectra against the Human UniProt database (release 2017.10 with 20,316 entries). The sequence of bovine serum albumin (BSA, P02769 ALBU_BOVIN) was manually added into the database. The specificity of the enzyme was set to trypsin, a maximum of two missed cleavages was acceptable, carbamidomethylation of cysteine was set as a fixed modification, oxidation of methionine was included as the variable modification, and the mass tolerance for precursor ions and fragment ions were set to 20 ppm and 0.05 Da, respectively. A false discovery rate of 1% was used to filter assigned peptides, and protein identifications with ≥2 unique peptides were kept. The identified proteins are detailed in supplemental Table S2, SI.
Proteins displaying top abundance from the gel bands were selected for relative quantification (the abundance levels of protein were ranked based on #unique peptides summarized by the Label Free module of PEAKS Studio). The label-free method was then employed. We selected quantifiable peptides and calculated the total values of the corresponding peak areas. The mass error tolerance for precursors and fragment ions was set at 20 ppm and 0.05 Da, respectively, and each experimental condition was set as a group for relative quantification. Criteria of the selected peptides for protein quantification included (1) -10lgP value > 30, (2) miss cleavage ≤ 2, (3) average ppm of peptides <15, and (4) displaying consistent chromatographic behaviors across all samples. The peptides identified from BSA were used for normalization. Therefore, the relative abundance of proteins in each sample was calculated by AR = ∑(Peak areas of peptide of target)/∑(Peak areas of peptides of IS Protein). Proteins that displayed increased abundances upon butyrate incubation were then assigned as potential target proteins. All raw mass spectrometric data were deposited into the MassIVE system and can be accessed at ftp://massive.ucsd.edu/MSV000082189.
Metabolomic Analysis and Data Processing
HCT116 cells were seeded and cultured in medium in 6-well plates, and subsequent metabolomic analysis was performed based on a previously reported method (21, 22). Briefly, cells were extracted with 1 ml ice-cold 80% methanol containing 1.5 μg/ml 1,2-13C2-glutamine as an IS. The cell extracts were subsequently concentrated in a SPD2010–230 SpeedVac concentrator (Thermo Scientific, Holbrook, NY) and reconstituted in 100 μl deionized water before being subjected to LC-MS analysis. A 20 μl aliquot of the sample was separated by an Xbridge Amide HPLC column (3.5 μm, 4.6 mm × 100 mm, Waters, Milford, MA) in a LC-30A UFLC system (Shimadzu, Kyoto, Japan). The temperature of the column oven was set at 40 °C. The mobile phase A consisted of 5 mm ammonium acetate, 95% water and 5% acetonitrile (pH 9.0), and the mobile phase B was acetonitrile.
The eluent was then introduced into a Triple TOF 5600 system (SCIEX, Framingham, MA) operated in the negative ion mode. ESI conditions were set as follows: Ion Source Gas 1 (GS1) at 33 psi, Ion Source Gas 2 (GS2) at 33 psi, Curtain gas (CUR) at 25 psi, source temperature at 475 °C and ion spray voltage floating at −4500 V. Mass spectrometer parameters were as follows: N2 as the collision gas, Q1 vacuum gauge: 2.2×10⁻⁵ torr, TOF vacuum 0.309×10⁻⁶ torr. Information-dependent acquisition (IDA) was employed for metabolite identification. The TOF/MS scan was set in the m/z range of 50 to 1000 Da, the declustering potential (DP) was set at −95 V, and the collision energy (CE) was set at −5 V. For the TOF-MS/MS scan, the IDA settings were set as follows: DP at −95 V, CE at −30 V with a spread of ± 10 V, charge state −1, intensity threshold at 500 cps, and maximum number of candidate ions at 4; isotopes within 4 Da were excluded. Accumulation times for TOF-MS and MS/MS scan were set at 250 ms and 100 ms, respectively.
For metabolomic data processing, peak areas were extracted from raw data to generate a data matrix and normalized against IS and protein concentrations of each samples. Principal component analysis (PCA) was performed to determine the difference between the control versus the butyrate-treated groups. Orthogonal projections to latent structures discriminant analysis (OPLS-DA) was subsequently used to screen potential biomarkers according to the variable importance in the project (VIP) value. Student's t-test was performed, and metabolites displaying p value<0.05 were assigned as metabolic biomarkers. These metabolites with significant level changes were identified by matching the accurate m/z of acquired precursors (mass tolerance <10 ppm) and fragment ions with entries from metabolome databases including the human metabolome database (HMDB, http://www.hmdb.ca/), MassBank (http://www.massbank.jp) and METLIN (http://metlin.scripps.edu).
Viability and Proliferation Rate Assays
To determine cell viability, 200 μl cell suspensions (∼5×10⁴ cells/well) were dispensed in 96-well plates and preincubated with butyrate at the indicated concentrations for 24 h. After the butyrate treatments, the culture medium was replaced by 100 μl nonphenol red medium containing 10% storing solution of CCK-8 (Dojindo, Kanagawa, Japan). The plate was incubated at 37 °C for 30 min, and the resultant OD480 values were recorded by an automatic microplate reader (Synergy H1, BioTek, Winooski, VT) to determine the number of viable cells. For determination of proliferation, cells were seeded in 6 individual 96-well plates at a density of ∼1×10⁴ cells/well and treated with the indicated reagents in culture medium containing 2% FBS. From the first day to the eighth day after the cells were seeded, cell viability was determined by CCK-8 every 24 h, and the proliferation curves were plotted. For the determination of proliferation by BrdU incorporation, a cell proliferation assay kit (Merck Millipore) was used. Cells were plated in a 96-well plate and treated with the indicated reagents. The measurement of the proliferation rate was performed according to the manufacturer's instructions.
RNA Interference
Scrambled small interfering RNA (siRNA) and siRNA targeting PKM2 were purchased from Santa Cruz (Dallas, TX). HCT116 cells were transfected with scrambled (sc-37007) and PKM2 siRNA (sc-62820) using lipofectamineTM RNAiMAX reagent (Invitrogen, Grand Island, NY) for 24 h in an antibiotic-free culture medium according to the manufacturer's instructions.
Statistical Analysis
Data are presented as the mean ± S.E. Statistical differences between two groups were determined by Student's t-test, whereas comparisons among three or more groups were analyzed by one-way ANOVA followed by the Tukey-Kramer test. p < 0.05 was considered statistically significant. Statistical analyses were performed by GraphPad Prism version 6.01 (GraphPad Software, La Jolla, CA).
RESULTS
Butyrate Suppresses the Warburg Effect in Colorectal Cancer Cells
We first verified the inhibited proliferation of colorectal cancer cells induced by butyrate in the HCT116 cell line. As in Fig. 1A, butyrate significantly inhibited the proliferation of HCT116 cells in a dose-dependent manner. The growth curve study validated that 1 mm butyrate completely inhibited the proliferation of HCT116 cells, and even the lowest dose of 0.25 mm butyrate was able to notably influence the cell proliferation rate (Fig. 1B). We also validated this inhibitory effect of butyrate on cancerous colonocyte proliferation using the other two colorectal cancer cell lines, namely, HT29 (supplemental Fig. S1A) and LoVo (supplemental Fig. S1B) cells.
Fig. 1.

Determination of butyrate's inhibitory effect in colorectal cancer cells. A, HCT116 cells were treated with butyrate for 24 h, and the number of viable cells in response to the treatment was determined by a CCK-8 cell viability assay (n = 5). Data are presented as the mean ± S.E., *p < 0.05, **p < 0.01, ***p < 0.001. B, Effect of 6-day prolonged treatment with butyrate on proliferation determined by CCK-8 (n = 5). Data are presented as the mean ± S.E.
Because continuous and rapid proliferation of cancer cells largely depends on metabolic reprogramming known as the Warburg effect, we asked whether butyrate disrupts the metabolism of colorectal cancer cells to suppress cell proliferation. To this end, we employed an HRMS-based metabolomics approach and comprehensively probed the metabolome changes in HCT116 cells upon treatment with butyrate. The butyrate-mediated metabolomic changes were characterized by processing the UPLC-Q/TOF data of the extracts from nontreated and butyrate-treated HCT116 cells (24 h treatment) via PCA. The two groups of data both showed good reproducibility and separation in the PCA model (Fig. 2A). Then, we used OPLS-DA to analyze the same set of data (supplemental Fig. S2A) and selected the endogenous metabolites with a VIP value > 1, whose contributions to the OPLS-DA model and the reliability were further verified via S-Plot (supplemental Fig. S2B). A t-test was finally performed, with those metabolites with p value<0.05 assigned as potential biomarkers (supplemental Table S3A, SI). Based on the accurate mass and MS/MS fragmentation information, we identified a total of 48 metabolites that markedly changed in response to the butyrate treatment (supplemental Table S3B, SI). Fig. 2B displays a heat map illustrating the abundance level changes of the representative metabolites from the identified biomarkers.
Fig. 2.

Butyrate induces metabolic reprogramming of colorectal cancer cells. HCT116 cells were treated with butyrate (1 mm) for 24 h, and the intracellular metabolites were extracted and analyzed by LC-MS/MS accordingly. A, Score plots of the principal component analysis model differentiated metabolites of the butyrate-treated HCT116 cells from those of the nontreated cells. B, A heatmap shows the differences in the identified potential biomarkers between the butyrate-treated cells and the control group. C, Metabolic pathway enrichment analysis of potential biomarkers identified from the butyrate-treated cells. Representative metabolites involved in glycolysis (D), nucleotide synthesis (E), and the TCA cycle (F) that underwent expression level changes after the 24-hr butyrate treatment are summarized (n = 5). G, A schematic overview of butyrate-induced metabolic reprogramming in colorectal cancer cells. Data are presented as the mean ± S.E., *p < 0.05, **p < 0.01, ***p < 0.001. G6P: glucose-6-phosphate; 3PG: 3-phosphoglyceric acid; PEP: phosphoenolpyruvic acid; R5P: ribulose-5-phosphate; 5′-IMP: inosine 5′-monophosphate; 5′-GMP: guanosine 5′-monophosphate; 5′-UMP: uridine 5′-monophosphate; PYR: pyruvate; LAC: lactate; Ac-CoA: acetyl coenzyme A; TCA cycle: tricarboxylic-acid cycle.
To gain metabolic insight into the regulatory roles of butyrate in mediating the metabolism of HCT116 cells, we conducted a pathway enrichment analysis and summarized the butyrate-perturbed pathways based on the identified metabolites using MetaboAnalyst (Fig. 2C). A variety of pathways including pyruvate metabolism, glycolysis, amino/nucleotide sugar metabolism, the TCA cycle, PPP, amino acid metabolism and purine/pyrimidine metabolism were altered by butyrate treatment. Specifically, we noticed that several metabolite intermediates involved in glycolysis, such as fructose 1,6-bisphosphate (FBP), 3-phosphoglyceric acid (3PG) and phosphoenolpyruvate (PEP), and those involved in nucleotide synthesis, such as ribose 5-phosphate (R5P), glutamine and 5′-NMPs (Fig. 2D–2E), were significantly decreased. Moreover, metabolites of serine and glycine biosynthesis, such as 3′-phospho-l-serine (3′P-Ser), serine and glycine converted by a glycolytic intermediate 3-PG, were also decreased (Fig. 2E). By contrast, a marked increase (∼3-fold) in pyruvate was observed with simultaneously increased levels of acetyl-CoA and downstream TCA metabolites in the butyrate-treated cells (Fig. 2F). This is in line with the finding that pyruvate is transported from the cytosol to the mitochondria and is metabolized to acetyl-CoA, which further enters the TCA cycle and produces citrate as well as downstream intermediates. The Warburg effect, characterized by pronounced accumulation of lactate from the metabolism of pyruvate but a repressed TCA cycle and oxidative phosphorylation, is a hallmark of the cancer metabolism pattern. Intriguingly, we found that butyrate treatment of HCT116 cells significantly decreased the level of lactate, albeit with a remarkably enriched source of pyruvate (Fig. 2D), indicative of a metabolic shift from anabolic processes such as building block preparation and glycolysis essential for tumor cell proliferation to oxidative phosphorylation and energy production. Fig. 2G presents a schematic description for the intriguing metabolic reprogramming induced by butyrate treatment in HCT116 cells.
Butyrate-induced Metabolic Reprogramming Underlies Proliferative Suppression
After revealing the significantly altered metabolic patterns of colorectal cancer cells induced by butyrate treatment, we sought to discover the link between the reprogrammed metabolic phenotype and the proliferative suppression effect. Consequently, we supplemented key intermediates involved in the butyrate-remodeled metabolic pathways of cells and investigated whether such supplementation can directly modulate the consequent inhibition of proliferation by butyrate. Because pyruvate is the metabolite that channels glycolysis and the TCA cycle and displayed the most significant change in response to butyrate treatment, we first added pyruvate to HCT116 cells and characterized the corresponding metabolic pattern. Interestingly, the metabolic program induced by pyruvate supplementation resembled that of the butyrate-treated cells, exhibiting an overall down-regulation of glycolysis and nucleotide synthesis pathway with a promoted TCA cycle (Fig. 3A). In addition, coadministration of pyruvate (5 mm) with butyrate further strengthened the inhibition of the proliferation rate induced by butyrate (Fig. 3B). These facts suggest that pyruvate remodels the metabolic phenotype in a manner like the butyrate-treated HCT116 cells, and such phenotype directly influences the cells' proliferative decisions.
Fig. 3.

Butyrate-induced metabolic reprogramming underlies its inhibitory effect on cancer colorectal cell proliferation. A, Altered levels of representative metabolites in response to the supplementation of pyruvate in HCT116 cells (n = 5, treatment lasting 24 h). B, Effect of pyruvate supplementation (5 mm) on cell viability of butyrate-treated cells (n = 5, treatment lasting 24 h). The different concentrations of administered butyrate are labeled in the chart. C, BrdU incorporation showed interference of the 48 h butyrate treatment with nucleotide synthesis (n = 4). D, The influence of coadministration of butyrate and hypoxanthine (500 μm) for 24 h on cell viability (n = 5). The different concentrations of administered butyrate are labeled in the chart. E, Addition of hypoxanthine to cells reversed the decrease in the BrdU incorporation rate induced by the butyrate treatment (n = 4). Data are presented as the mean ± S.E., *p < 0.05, **p < 0.01, ***p < 0.001.
We next sought to elucidate how the butyrate-remodeled metabolic phenotype contributes to the suppressed proliferation. Because the butyrate treatment led to hampered nucleotide synthesis and decreased levels of nucleotides, which have been previously associated with proliferative suppression, we investigated the proliferation rate of butyrate-treated cells using a BrdU incorporation assay. As shown in Fig. 3C, butyrate decreased the incorporation of BrdU into newly synthetized DNA in a concentration-dependent manner. The inhibition of BrdU incorporation by butyrate was also verified in HT29 (supplemental Fig. S3A) and LoVo cells (supplemental Fig. S3B). We thus added additional nucleotides to butyrate-treated cells and tested whether this treatment would reverse the butyrate-suppressed proliferation. We co-administered hypoxanthine (500 μm) with butyrate to HCT116 cells and showed that the supplementation of hypoxanthine reversed the suppressed incorporation of BrdU induced by butyrate and ameliorated the proliferative suppression by butyrate (Fig. 3D–3E), indicating that decreased levels of metabolic intermediates of nucleotide synthesis partially explain the proliferative suppression of butyrate. These observations combinatorially suggest that butyrate may function in a metabolism-dependent manner to suppress cellular proliferation. Butyrate shuttles pyruvate metabolism to the TCA cycle and thereby represses glycolysis and leads to restricted flux to PPP and repressed nucleotide synthesis.
Butyrate Targets Pyruvate Kinase M2 of Colorectal Cancer Cells
Because our metabolomics data strongly indicate that butyrate suppresses the proliferation of colorectal cancer cells via a remodeling metabolism, we hypothesized that butyrate might directly target specific metabolic enzymes or their upstream regulators. A DARTS-based proteomics approach was employed for the discovery of target proteins for butyrate. We selected DARTS as the tool for target discovery because it directly compares the proteomics profiles of butyrate-treated cells after proteolytic digestion and identifies drug-stabilized proteins as targets without additional modification to butyrate, whereas conventional methods usually involve the immobilization of butyrate, which is prone to change its bioactivity. A simple schematic workflow of DARTS for target identification and validation is presented in Fig. 4A.
We first incubated cell lysates with butyrate at concentrations of 0, 0.5, 2, and 8 mm and subsequently added Pronase to digest the butyrate-incubated lysate. The digested lysate was separated by SDS-PAGE and visualized by Coomassie blue staining. As shown by Fig. 4B, relative quantitation by densitometry showed that a band at 60 kDa exhibited a distinctly concentration-dependent increase in abundance with the increment of butyrate dose compared with other bands. We reasoned that this differential abundance in the absence and presence of butyrate occurred because proteins within this band become stabilized and less susceptible to digestive enzymes through binding to butyrate. Consequently, we sought to discover the protein target present in this specific gel band via quantitative proteomics.
To enhance the reliability of the proteomics quantification of in-gel digested proteins, we spiked an equal amount of BSA (MW∼66 kDa) as an IS protein into each sample. The electrophoretic behavior of BSA was evaluated beforehand, showing coelution with the target proteins at ∼60 kDa (supplemental Fig. S4A) and indicating that BSA was suitable for the relative quantification of target proteins in this case. The 60 kDa protein band was subsequently in-gel digested by trypsin and subjected to mass spectrometric analysis with high-sensitivity and high-resolution Q-TOF MS. The identified proteins are summarized in supplemental Table S2, SI. Among the proteins of highest abundance in the ∼60 kDa band, pyruvate kinase PKM (P14618 KPYM_HUMAN), 60 kDa heat shock protein (P10809 CH60_HUMAN) and ATP synthase subunit alpha (P25705 ATPA_HUMAN) ranked in the top 3 among all the hits identified from this protein band.
We then quantified these proteins using the label-free quantitative method with BSA as the IS (supplemental Fig. S4B) and found that the abundance of PKM displayed an elevated trend in abundance upon incubation with an increasing dosage of butyrate following Pronase digestion (Fig. 4C), whereas the other proteins showed negligible changes in abundance (supplemental Fig. S4B). Fig. 4D displays the MS/MS spectrum of a representative unique peptide that assists the identification of PKM, and supplemental Fig. S4C shows the increased abundances of PKM peptides following butyrate treatment of increasing concentrations. The MS/MS spectra of all the peptides included for the relative quantification of PKM and BSA are summarized in supplemental Table S4, SI, and the quantitative details are summarized in supplemental Table S5, SI. The DARTS-based proteomics data strongly indicate that butyrate directly binds to PKM in cell lysates and that the formation of the butyrate-bound protein complexes protects PKM from Pronase digestion. Considering the biological function of PKM in catalyzing the production of pyruvate from PEP, it is highly possible that butyrate reprograms the metabolism of HCT116 colorectal cancer cells and exerts its function of proliferative inhibition by direct binding and consequently modulating the bioactivity of PK.
Although differentiation between PKM1 and PKM2 were not accomplished by MS because of high sequence homology, qPCR and Western blotting experiments both showed that PKM2 is the dominant isomeric form of PK in HCT116 cells (supplemental Fig. S4D–S4E). In addition, Western blotting was performed to analyze the proteins in the HCT116 cell lysate following DARTS treatment and showed that the immunoblotted band of PKM2 displayed a higher abundance upon incubation with the increment of butyrate doses after Pronase digestion, demonstrating that PKM2 became less susceptible to Pronase digestion after binding to butyrate (Fig. 4E). The abundance of the control protein for the Western blotting experiments, namely, GAPDH, held constant with increased concentrations of butyrate, indicating that no stabilizing effect on GAPDH was induced by butyrate. This specific stabilizing effect of butyrate on PKM2 was also confirmed by Western blotting experiments in HT29 and LoVo cells (supplemental Fig. S4F). To further demonstrate the binding of butyrate to PKM2, we performed the DARTS assay using butyrate and recombinant PKM2 protein. The recombinant PKM2 was incubated with different doses of butyrate and subjected to Pronase digestion, followed by SDS-PAGE separation and Coomassie blue staining. As shown in Fig. 4F, butyrate also protected recombinant PKM2 protein from Pronase digestion, demonstrating the interaction between butyrate and PKM2.
Butyrate Remodels Metabolism via Activating PKM2
After the recognition of PKM2 as the binding target of butyrate, we evaluated the kinase activity of butyrate-bound PKM2 by an LDH-coupled colorimetric assay. As shown in Fig. 5A, butyrate treatment accelerated the consumption of NADH, in a dose-dependent manner, revealing a promoting effect on intracellular PK activity by butyrate. In addition, we ruled out the possibility that butyrate may enhance intracellular PK activity via up-regulated expression of PKM2 by real-time PCR and immunoblotting, both displaying constant levels of PKM2 after the administration of butyrate (Fig. 5B). The enhancement of PK activity by butyrate was also demonstrated in HT29 and LoVo cells (supplemental Fig. S5A). Moreover, the activation of PKM2 by butyrate was evidenced by the increased levels of pyruvate upon butyrate treatment (Fig. 2F). The elevated level of pyruvate was unlikely to stem from a changed level of lactate, because neither the expression level nor the activity of LDH was perturbed by the butyrate treatment using the qPCR and LDH assay (supplemental Fig. S5B).
Fig. 5.

Butyrate remodels the cell metabolism and affects cell proliferation via activating PKM2. A, PK activity of the cell lysate after incubation with butyrate for 24 h was determined by an LDH-coupled colorimetric assay. PK activities following the butyrate treatment were calculated by the rate of substrate consumption and were all compared with the PK activity of the untreated group. B, Expression of PKM2 at the mRNA and protein levels was not affected, as shown by real-time PCR and immunoblotting. C, Metabolic programs of HCT116 cells after a 24 h-treatment with the PKM2 activator TEPP-46 mimicked the remodeled metabolic profile modulated by butyrate. D, Influence of the coadministration of TEPP-46 and butyrate for 24 h on cell viability. E, Altered metabolite levels induced by the 24 h-treatment with the PKM2 inhibitor shikonin. F, Influence of the coadministration of shikonin and butyrate for 24 h on cell viability. G, Effect of PKM2 silencing on the BrdU incorporation rate interfered with by butyrate treatment (24 h treatment). The immunoblotting experiments validated the silencing of PKM2 by siPKM2. Data are presented as the mean ± S.E., *p < 0.05, **p < 0.01, ***p < 0.001.
Butyrate and pyruvate are both considered precursors of acetyl-CoA, which is responsible for histone acetylation and affects cell metabolism by regulating gene expression. To evaluate the effect of butyrate-induced pyruvate overproduction on histone acetylation and thereby cell metabolism, we analyzed the acetylation level of histone after the butyrate and pyruvate treatments. As shown in supplemental Fig. S5C, butyrate induced a significant accumulation of acetylated histone H3 as a well-known HDAC inhibitor, whereas the administration of pyruvate alone failed to change the pan-acetylation levels of H3, suggesting that the increased level of pyruvate might directly affect cell proliferation by metabolic remodeling rather than via histone modulation. Our observation seems to contradict previous studies that reported pyruvate functioned as an HDAC inhibitor and increased acetylated H4. The discrepancy can be explained by the low expression levels of SLC5A8, the transporter that is responsible for the uptake of extracellular pyruvate, in cancer cells (23, 24). Because we did not overexpress the transporter in HCT116 cells as previous studies did, this might account for the negligible change of acetylated H3 levels as we observed in this study. Consequently, it will be intriguing to investigate the contribution of increased pyruvate to histone acetylation and the impact on cell fates in future studies.
Next, we aimed to validate whether the activation of PKM2 in colorectal cancer cells by butyrate is responsible for the inhibition of proliferation. We utilized a PKM2 agonist TEPP-46 to treat HCT116 cells and investigated whether similar metabolic programs were induced as that by the butyrate treatment. Fig. 5C shows that TEPP-46 increased the levels of pyruvate and the metabolic intermediates in the TCA cycle while reducing the levels of metabolic intermediates in PPP and glycolysis, mimicking the remodeled metabolic profile modulated by butyrate. In line with the metabolomic profiles, the cell viability assay indicated that TEPP46 treatment also aggravated the butyrate-induced proliferative inhibition (Fig. 5D). Furthermore, we administered the PKM2 inhibitor shikonin to HCT116 cells and examined the corresponding metabolic profiles. The metabolomics data showed that shikonin treatment decreased the levels of pyruvate and metabolic intermediates involved in the TCA cycle with up-regulated G6P (Fig. 5E). We subsequently performed a cell viability assay and demonstrated that the inhibition of PKM2 activity via shikonin significantly reversed the proliferative suppression of HCT116 cells by butyrate (Fig. 5F). Moreover, the reversion was abrogated when a high concentration of butyrate (4 mm) was administered to the cells, suggesting a concentration-dependent competition between the PKM2 activator butyrate and the inhibitor shikonin. To further validate the involvement of PKM2 in the proliferative suppression effect of butyrate, an approach of PKM2 silencing was employed. As shown in Fig. 5G, the siRNA targeting PKM induced selective silencing of PKM2 compared with the scrambled siRNA. After PKM2 silencing, no significant changes in BrdU incorporation was observed in the butyrate-treated HCT116 cells, posing a stark contrast to the scrambled siRNA-treated cells. These results indicate that the presence of PKM2 serves as a prerequisite for butyrate to exert its function in modulating cell proliferation.
Butyrate Activates PKM2 by Inhibiting Phosphorylation and Promoting Tetramerization
The integrative metabolomics and chemical proteomics approaches together with all the biochemical evidence strongly support that butyrate remodels the metabolism and thereby suppresses the proliferation of colorectal cancer cells via targeting PKM2. We next sought to uncover the mechanisms underlying how butyrate activates PKM2. The activity of PKM2 is tightly controlled by its post-translational modification (PTM) status. For instance, phosphorylation is reported to directly result in downregulated intracellular PK activity. As shown in Fig. 6A, the Tyr105-phosphorylated form of PKM2 was gradually decreased after the cells were incubated with increasing dosages of butyrate compared with the nontreated cells, inversely correlated with the butyrate-stimulated PK activity.
Fig. 6.
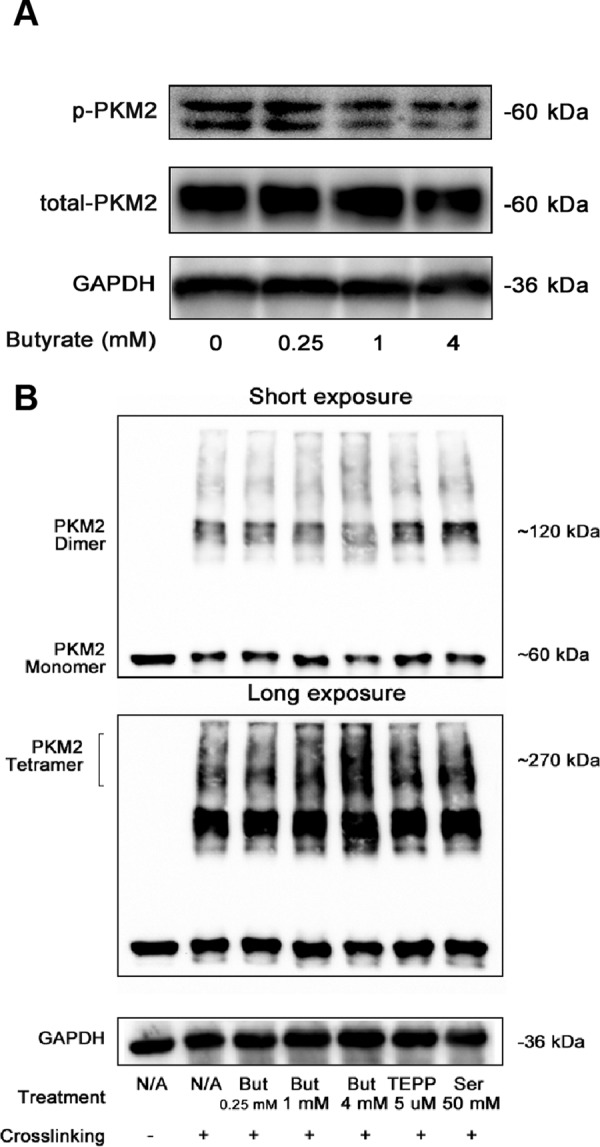
Butyrate inhibits the phosphorylation of PKM2 while promoting tetramerization. A, Effect of butyrate on the Tyr105-phosphorylated form of PKM2 (p-PKM2) was determined by immunoblotting. B, PKM2 oligomerization was affected by incubation with butyrate as well as other PKM2 activators, including TEPP and serine, after glutaraldehyde-crosslinking, as suggested by immunoblotting. The altered abundance of the monomeric and dimeric forms of PKM2 are best presented by the image with a short exposure (10 s), whereas the up-regulated tetrameric forms following treatments of butyrate and other activators are visualized by the image with a long exposure (90 s).
Oligomerization of PKM2 has also been demonstrated to determine its PK activity; thus, we further tested whether butyrate can induce changes to the tetramerization of PKM2. Interestingly, the glutaraldehyde-crosslinking experiment showed that the tetrameric PKM2 was increased in a butyrate dosage-dependent manner in the HCT116 cells, concomitantly with the decreased levels of phosphorylated PKM2 (Fig. 6B). Although the relationship between the tetramerization and phosphorylation of PKM2 is still not clear, it is possible that dephosphorylation favors the formation of PKM2 tetramers. Intriguingly, we found that a 4 mm-butyrate treatment induced a notably higher level of PKM2 tetramers than that induced by 50 mm serine, indicating that butyrate might be a stronger PKM2 activator compared with serine. These results thus provide a mechanistic explanation for PKM2 stimulation by butyrate. By binding to PKM2, butyrate prevents the phosphorylation of PKM2 while promoting the formation of tetrameric PKM2, subsequently leading to enhanced PK activity.
DISCUSSION
Previously, the underlying mechanism of the antitumorigenic function of butyrate has primarily been associated with its role as an endogenous inhibitor of HDAC and subsequent regulation of pro-apoptotic genes and antiproliferative regulators by mediating HDAC-dependent transcription activation (8, 12, 25, 26). Nevertheless, because the rapid proliferation of cancer cells largely depends on the well-defined reprogrammed metabolism for providing various building blocks, we reasoned that butyrate may directly affect the metabolism of colorectal cancer cells to elicit its proliferative suppression effects. In this study, a key kinase involved in glycolysis, PKM2, was identified as the binding target of butyrate and was shown to induce metabolic remodeling and ultimately lead to proliferation arrest upon activation by butyrate. A mechanistic relationship between butyrate-inhibited colorectal cancer cell proliferation and corresponding metabolic programs is thereby established.
It is generally accepted that cancerous colonocytes undergo the Warburg effect by relying on aerobic glycolysis as their primary energy source rather than using butyrate as normal cells do. Although this metabolic program is an insufficient way of ATP production, it is conducive to the uptake of nutrients and synthesis of biomass such as nucleotides and is thus required to support the rapid proliferation of cancer cells (27). Considering the demand of cancer cells on the capacity of metabolic reprogramming, it is highly possible that the proliferation arrest elicited by butyrate is directly linked with its capability to remodel the metabolism of colorectal cancer cells. Consequently, we employed the omics technology to reveal whether butyrate can rewire the metabolism of colorectal cancer cells while concomitantly inhibiting proliferation. Expectedly, the metabolomics data depicted a tilted metabolic balance from glycolysis to oxidative phosphorylation upon butyrate treatment, which reversed the metabolic advantages acquired by cancerous colonocytes. Further supplementation of the key metabolites that were significantly changed by butyrate in HCT116 cells managed to modulate the butyrate-induced proliferative arrest. Such experiments demonstrate that the butyrate-affected metabolism serves as a cause rather than a consequence of the inhibited proliferation. We thus sought to determine the direct protein target of butyrate that mediates the remodeling of colorectal cancer cell metabolism.
In view of the simple structure of butyrate, a DARTS-based proteomic approach was selected for target discovery, whereas the classical affinity bead/chromatography-based approach, which requires modification to butyrate, was avoided (19). The discovered drug targets bound to the target drug itself rather than butyrate mimetics, which could subsequently be visualized directly in Coomassie blue stained SDS-PAGE gels by rough quantitation via densitometry for further identification by proteomics. Proteins of high abundance with relevant functions identified from the specific gel bands are then prioritized to undergo biological validations as potential targets. This strategy of target identification lacks a quantitative basis. In contrast, we used spiked-in protein as IS for each sample when performing relative quantitation, and hence managed to avoid the discrepancy caused by in-gel digestion and instrumental fluctuations, delivering more accurate and reliable quantitation results for gel-separated proteins compared with the conventional approach. Interestingly, we discovered PKM2 as one of the butyrate-bound proteins, which possibly accounts for the pronounced metabolic changes induced by butyrate using HCT-116 cells via this approach.
Immunoblotting experiments also demonstrated that the target protein identified by the quantitative approach, namely, PKM2 binds to butyrate. Further biochemical assays suggested that PKM2 becomes activated upon binding to butyrate and is responsible for the metabolic reprogramming and subsequent proliferation arrest (Fig. 7). This is the first time butyrate was revealed to influence cell fate via PKM2-targeted metabolic transformations, and more importantly, butyrate may represent another endogenous PKM2 activator in addition to the previously identified FBP and serine.
Fig. 7.

A schematic mechanism of how butyrate suppresses the proliferation of colon cancer cells via targeting pyruvate kinase M2 and metabolic reprogramming. PKM2 exists dominantly in its inactive dimeric form in normal HCT116 cells. It thus favors aerobic glycolysis, characterized by pronounced accumulation of lactate but a repressed TCA cycle and oxidative phosphorylation to support rapid cell growth. In contrast, the butyrate treatment dephosphorylates PKM2 while promoting the formation of tetrameric PKM2, enhancing the kinase activity of PKM2. Accordingly, we found that HCT116 cells significantly decrease the level of lactate while pronouncedly increasing the abundance of pyruvate. Concomitantly, metabolic profiles that represent a metabolic shift from anabolic processes (such as building block preparation and glycolysis, which are essential for tumor cell proliferation) to oxidative phosphorylation and energy production are observed, which explains the hampered nucleotide synthesis pathway and consequently inhibited proliferation induced by butyrate treatment.
As a glycolytic enzyme, PK dictates the final rate-limiting step of glycolysis by catalyzing the transfer of a phosphate group from PEP to ADP while generating pyruvate. Four isoforms of PK, including L, R M1 and M2, exist in mammals, among which PKM1 is expressed in most normal cells and its splice variant PKM2 is exclusively found in proliferating cells such as cancer cells and stem cells (28). Intriguingly, low PKM2 activity promotes the flux of glucose into anabolic glycolytic-derived pathways, whereas the substitution of PKM2 with the constitutively active PKM1 diverts the metabolic pathways away from Warburg-derived glycolysis, resulting in enhanced oxygen consumption, reduced levels of lactate and impaired cell proliferation (29, 30). The modulation of PKM2 activity is thus assessed as a tempting means for impeding cancer cell proliferation. This possibility has been critically investigated both in vivo and in vitro. For instance, the synthetic chemicals TEPP-46 and DASA-58, which mimic PKM1 enzymatic properties in PKM2-exppressing H1299 cells, have been demonstrated to alter metabolism by significantly decreasing the incorporation of glucose-derived carbons into intermediates (such as ribose phosphate, acetyl CoA and serine) that are crucial precursors of biomass synthesis (31). In line with our observation, such interference of anabolic metabolism results in impaired cancer cell proliferation; Moreover, the proliferation of human lung cancer cell H1299 xenografts in mice is also effectively suppressed (30). In contrast, ROS-induced oxidation of PKM2 hampers the activity and leads to the alleviation of oxidative stress by increasing antioxidative metabolites, which consequently maintains tumor-cell survival (32). Combining previous clinical research that reported significantly less butyrate in colonic contents of colorectal cancer patients than those of normal individuals and our findings (33, 34), the reduced butyrate production in the process of colon cancer development may account for impaired PKM2 activity and remodeled metabolism favoring the production of biomass for uncontrolled proliferation and thereby promoting the development of colon cancer.
Previous studies have demonstrated FBP and serine as endogenous PKM2 activators that affect cancer cell survival (35–37), whereas our discovery reveals butyrate as another endogenous ligand for PKM2. In particular, our finding provides a reasonable explanation for the differential effects of butyrate in normal and cancerous colonocytes, referred to as the “butyrate paradox.” Because normal and cancerous colon cells possess different capabilities in metabolizing butyrate, colon cancer cells mainly uptake glucose while metabolizing little butyrate, resulting in the accumulation of high levels of butyrate. In this situation, a correspondingly high PKM2 activity is induced because of direct activation by butyrate, which subsequently results in interfered cancer-cell metabolism and proliferation arrest. For normal cells, butyrate is mostly metabolized as an energy source, and the main isoform of PK is the constitutively active PKM1 rather than PKM2. The differential metabolic fates and functional influences on PKM2 and the metabolism between normal cells and their cancerous counterparts thereby explain the opposing effects of butyrate in normal and cancerous cells.
Lastly, our study explored the molecular mechanism of butyrate-induced activation of PKM2. Interestingly, we found butyrate promoted tetramerization of PKM2 but decreased its dimeric form, which is in accordance with previous knowledge that the tetrameric form of PKM2 possesses high PK activity as opposed to its nearly inactive dimers (31). Concomitantly with the tetrameric/dimeric change, we also found that the 105Y-phosphorylated PKM2 was decreased by butyrate. Previously, different PTMs of PKM2 have been reported, including phosphorylation of 37S and 105Y, oxidation of 358C, acetylation of 305K, and succinylation of 311K (32, 38–41), which are all correlated with decreased enzymatic activity. Although the exact relationship between phosphorylation and tetramerization of PKM2 is not clearly understood, our results point to a possible causal effect of phosphorylation on tetramerization. It is possible that the binding of butyrate to PKM2 induces conformational changes that are not readily phosphorylated (39), favoring the tetramer formation and thereby increased PK activity.
CONCLUSION
Here, we introduced a metabolism-guided proteomics strategy for butyrate target discovery. Metabolomics was first employed to monitor the metabolic profiles of cancerous colonocytes altered by butyrate treatment using HRMS. Interestingly, a remodeled metabolic program characterized by pronounced elevation of pyruvate and suppressed levels of other glycolytic intermediates upstream of pyruvate was noted in proliferation-blocked HCT116 cells, establishing a link between metabolic reprogramming and butyrate-inhibited proliferation. To explain the butyrate-remodeled metabolism, a quantitative proteomics approach based on the DARTS assay was subsequently used to deconvolute the binding targets of butyrate. The proteomics results suggest that the glycolytic enzyme pyruvate kinase isoform 2 (PKM2), which is responsible for the conversion of phosphoenolpyruvic acid (PEP) to pyruvate, binds to pyruvate, pointing to a potential involvement of PKM2 in affecting the butyrate-mediated metabolic remodeling of colorectal cancer cells. Additional evidence from immunoblotting experiments and biochemical assays supported our observation and substantiated that butyrate activates PKM2 upon binding and induces a metabolic phenotype that corresponds to inhibited proliferation. Our study thus provides a mechanistic perspective by associating PKM2-mediated metabolic remodeling with the antitumorigenic function of butyrate. This finding suggests that fine-tuning the metabolism of colorectal cancer cells by targeting PKM2 is of significant therapeutic value in the future for treating colorectal cancer while preserving normal colonocyte function.
DATA AVALIABILITY
All Raw mass spectrometric data were deposited into the MassIVE system and can be accessed at ftp://massive.ucsd.edu/MSV000082189 with a project ID of MSV000082189.
Supplementary Material
Footnotes
* This study was supported by the National Natural Science Foundation of China (grants No. 81421005, 81430091, 81720108032, 91429308, 81603193 to H.H.), the Fundamental Research Funds for the Central Universities (2632018ZD07 to H.Y.), the Project for Major New Drugs Innovation and Development (2015ZX09501010 to H.H.), Overseas Expertise Introduction Project for Discipline Innovation (G20582017001 to H.H.), College Students Innovation Project for the R&D of Novel Drugs (J1310032 to W.L.) and Postgraduate Research & Practice Innovation Program of Jiangsu Province (KYCX17_0679 to Q.L.).
 This article contains supplemental material.
1 The abbreviations used are:
- SCFA
- short chain fatty acid
- HDAC
- histone deacetylase
- BSA
- bovine serum albumin
- TCA cycle
- tricarboxylic-acid cycle
- HRMS
- high resolution mass spectrometry
- DARTS
- drug affinity responsive target stability
- PKM2
- pyruvate kinase M2
- CCK-8
- cell counting kit 8
- BCA
- Bicinchoninic acid
- SDS-PAGE
- sodium dodecyl sulfate polyacrylamide gel electrophoresis
- SEM
- standard error of the mean
- ANOVA
- analysis of variance
- PVDF
- polyvinylidene difluoride
- PCA
- principal component analysis
- OPLS-DA
- orthogonal projections to latent structures discriminant analysis
- G6P
- glucose-6-phosphate
- 3PG
- 3-phosphoglyceric acid
- PEP
- phosphoenolpyruvic acid
- R5P
- ribulose-5-phosphate
- 5′-IMP
- inosine 5′-monophosphate
- 5′-GMP
- guanosine 5′-monophosphate
- 5′-UMP
- uridine 5′-monophosphate
- PYR
- pyruvate
- LAC
- Lactate
- Ac-CoA
- acetyl coenzyme A
- PPP
- pentose phosphate pathway
- LDH
- lactate dehydrogenase
- PTM
- post-translational modification
- internal standard
- IS.
REFERENCES
- 1. Tan J., McKenzie C., Potamitis M., Thorburn A. N., Mackay C. R., and Macia L. (2014) The role of short-chain fatty acids in health and disease. Adv. Immunol. 121, 91–119 [DOI] [PubMed] [Google Scholar]
- 2. Koh A., De Vadder F., Kovatcheva-Datchary P., and Backhed F. (2016) From dietary fiber to host physiology: short-chain fatty acids as key bacterial metabolites. Cell 165, 1332–1345 [DOI] [PubMed] [Google Scholar]
- 3. Fung K. Y., Cosgrove L., Lockett T., Head R., and Topping D. L. (2012) A review of the potential mechanisms for the lowering of colorectal oncogenesis by butyrate. Br. J. Nutr. 108, 820–831 [DOI] [PubMed] [Google Scholar]
- 4. Fung K. Y., Ooi C. C., Lewanowitsch T., Tan S., Tan H. T., Lim T. K., Lin Q., Williams D. B., Lockett T. J., Cosgrove L. J., Chung M. C., and Head R. J. (2012) Identification of potential pathways involved in induction of apoptosis by butyrate and 4-benzoylbutyrate in HT29 colorectal cancer cells. J. Proteome Res. 11, 6019–6029 [DOI] [PubMed] [Google Scholar]
- 5. Nor C., Sassi F. A., de Farias C. B., Schwartsmann G., Abujamra A. L., Lenz G., Brunetto A. L., and Roesler R. (2013) The histone deacetylase inhibitor sodium butyrate promotes cell death and differentiation and reduces neurosphere formation in human medulloblastoma cells. Mol. Neurobiol. 48, 533–543 [DOI] [PubMed] [Google Scholar]
- 6. Kuefer R., Genze F., Zugmaier W., Hautmann R. E., Rinnab L., Gschwend J. E., Angelmeier M., Estrada A., and Buechele B. (2007) Antagonistic effects of sodium butyrate and N-(4-hydroxyphenyl)-retinamide on prostate cancer. Neoplasia 9, 246–253 [DOI] [PMC free article] [PubMed] [Google Scholar]
- 7. Elangovan S., Pathania R., Ramachandran S., Ananth S., Padia R. N., Lan L., Singh N., Martin P. M., Hawthorn L., Prasad P. D., Ganapathy V., and Thangaraju M. (2014) The niacin/butyrate receptor GPR109A suppresses mammary tumorigenesis by inhibiting cell survival. Cancer Res. 74, 1166–1178 [DOI] [PMC free article] [PubMed] [Google Scholar]
- 8. Thangaraju M., Cresci G. A., Liu K., Ananth S., Gnanaprakasam J. P., Browning D. D., Mellinger J. D., Smith S. B., Digby G. J., Lambert N. A., Prasad P. D., and Ganapathy V. (2009) GPR109A is a G-protein-coupled receptor for the bacterial fermentation product butyrate and functions as a tumor suppressor in colon. Cancer Res. 69, 2826–2832 [DOI] [PMC free article] [PubMed] [Google Scholar]
- 9. Singh N., Gurav A., Sivaprakasam S., Brady E., Padia R., Shi H., Thangaraju M., Prasad P. D., Manicassamy S., Munn D. H., Lee J. R., Offermanns S., and Ganapathy V. (2014) Activation of Gpr109a, receptor for niacin and the commensal metabolite butyrate, suppresses colonic inflammation and carcinogenesis. Immunity 40, 128–139 [DOI] [PMC free article] [PubMed] [Google Scholar]
- 10. Donohoe D. R., Collins L. B., Wali A., Bigler R., Sun W., and Bultman S. J. (2012) The Warburg effect dictates the mechanism of butyrate-mediated histone acetylation and cell proliferation. Mol. Cell 48, 612–626 [DOI] [PMC free article] [PubMed] [Google Scholar]
- 11. Donohoe D. R., Holley D., Collins L. B., Montgomery S. A., Whitmore A. C., Hillhouse A., Curry K. P., Renner S. W., Greenwalt A., Ryan E. P., Godfrey V., Heise M. T., Threadgill D. S., Han A., Swenberg J. A., Threadgill D. W., and Bultman S. J. (2014) A gnotobiotic mouse model demonstrates that dietary fiber protects against colorectal tumorigenesis in a microbiota- and butyrate-dependent manner. Cancer Discov. 4, 1387–1397 [DOI] [PMC free article] [PubMed] [Google Scholar]
- 12. Kaiko G. E., Ryu S. H., Koues O. I., Collins P. L., Solnica-Krezel L., Pearce E. J., Pearce E. L., Oltz E. M., and Stappenbeck T. S. (2016) The colonic crypt protects stem cells from microbiota-derived metabolites. Cell 167, 1137. [DOI] [PubMed] [Google Scholar]
- 13. Burgess D. J. (2012) Metabolism: Warburg behind the butyrate paradox? Nat. Rev. Cancer 12, 798. [DOI] [PubMed] [Google Scholar]
- 14. Ward P. S., and Thompson C. B. (2012) Metabolic reprogramming: a cancer hallmark even warburg did not anticipate. Cancer Cell 21, 297–308 [DOI] [PMC free article] [PubMed] [Google Scholar]
- 15. Louis P., Hold G. L., and Flint H. J. (2014) The gut microbiota, bacterial metabolites and colorectal cancer. Nat. Rev. Microbiol. 12, 661–672 [DOI] [PubMed] [Google Scholar]
- 16. Cairns R. A., Harris I. S., and Mak T. W. (2011) Regulation of cancer cell metabolism. Nat. Rev. Cancer 11, 85–95 [DOI] [PubMed] [Google Scholar]
- 17. Boroughs L. K., and DeBerardinis R. J. (2015) Metabolic pathways promoting cancer cell survival and growth. Nat. Cell Biol. 17, 351–359 [DOI] [PMC free article] [PubMed] [Google Scholar]
- 18. Vernieri C., Casola S., Foiani M., Pietrantonio F., de Braud F., and Longo V. (2016) Targeting Cancer Metabolism: Dietary and Pharmacologic Interventions. Cancer Discov. 6, 1315–1333 [DOI] [PMC free article] [PubMed] [Google Scholar]
- 19. Lomenick B., Hao R., Jonai N., Chin R. M., Aghajan M., Warburton S., Wang J., Wu R. P., Gomez F., Loo J. A., Wohlschlegel J. A., Vondriska T. M., Pelletier J., Herschman H. R., Clardy J., Clarke C. F., and Huang J. (2009) Target identification using drug affinity responsive target stability (DARTS). Proc. Natl. Acad. Sci. U.S.A. 106, 21984–21989 [DOI] [PMC free article] [PubMed] [Google Scholar]
- 20. Pai M. Y., Lomenick B., Hwang H., Schiestl R., McBride W., Loo J. A., and Huang J. (2015) Drug affinity responsive target stability (DARTS) for small-molecule target identification. Methods Mol. Biol. 1263, 287–298 [DOI] [PMC free article] [PubMed] [Google Scholar]
- 21. Wu M., Ye H., Shao C., Zheng X., Li Q., Wang L., Zhao M., Lu G., Chen B., Zhang J., Wang Y., Wang G., and Hao H. (2017) Metabolomics-proteomics combined approach identifies differential metabolism-associated molecular events between senescence and apoptosis. J. Proteome Res. 16, 2250–2261 [DOI] [PubMed] [Google Scholar]
- 22. Wang L., Ye H., Sun D., Meng T., Cao L., Wu M., Zhao M., Wang Y., Chen B., Xu X., Wang G., and Hao H. (2017) Metabolic pathway extension approach for metabolomic biomarker identification. Anal. Chem. 89, 1229–1237 [DOI] [PubMed] [Google Scholar]
- 23. Thangaraju M., Gopal E., Martin P. M., Ananth S., Smith S. B., Prasad P. D., Sterneck E., and Ganapathy V. (2006) SLC5A8 triggers tumor cell apoptosis through pyruvate-dependent inhibition of histone deacetylases. Cancer Res. 24, 11560–11564 [DOI] [PubMed] [Google Scholar]
- 24. Thangaraju M., Carswell K. N., Prasad P. D., and Ganapathy V. (2009) Colon cancer cells maintain low levels of pyruvate to avoid cell death caused by inhibition of HDAC1/HDAC3. Biochem. J. 1, 379–389 [DOI] [PubMed] [Google Scholar]
- 25. Tan H. T., Tan S., Lin Q., Lim T. K., Hew C. L., and Chung M. C. (2008) Quantitative and temporal proteome analysis of butyrate-treated colorectal cancer cells. Mol. Cell. Proteomics 7, 1174–1185 [DOI] [PubMed] [Google Scholar]
- 26. Fung K. Y., Lewanowitsch T., Henderson S. T., Priebe I., Hoffmann P., McColl S. R., Lockett T., Head R., and Cosgrove L. J. (2009) Proteomic analysis of butyrate effects and loss of butyrate sensitivity in HT29 colorectal cancer cells. J. Proteome Res. 8, 1220–1227 [DOI] [PubMed] [Google Scholar]
- 27. Lunt S. Y., and Vander Heiden M. G. (2011) Aerobic glycolysis: meeting the metabolic requirements of cell proliferation. Annu. Rev. Cell Dev. Biol. 27, 441–464 [DOI] [PubMed] [Google Scholar]
- 28. Luo W., and Semenza G. L. (2012) Emerging roles of PKM2 in cell metabolism and cancer progression. Trends Endocrinol Metab. 23, 560–566 [DOI] [PMC free article] [PubMed] [Google Scholar]
- 29. Christofk H. R., Vander Heiden M. G., Harris M. H., Ramanathan A., Gerszten R. E., Wei R., Fleming M. D., Schreiber S. L., and Cantley L. C. (2008) The M2 splice isoform of pyruvate kinase is important for cancer metabolism and tumour growth. Nature 452, 230–233 [DOI] [PubMed] [Google Scholar]
- 30. Cortes-Cros M., Hemmerlin C., Ferretti S., Zhang J., Gounarides J. S., Yin H., Muller A., Haberkorn A., Chene P., Sellers W. R., and Hofmann F. (2013) M2 isoform of pyruvate kinase is dispensable for tumor maintenance and growth. Proc. Natl. Acad. Sci. U.S.A. 110, 489–494 [DOI] [PMC free article] [PubMed] [Google Scholar]
- 31. Anastasiou D., Yu Y., Israelsen W. J., Jiang J. K., Boxer M. B., Hong B. S., Tempel W., Dimov S., Shen M., Jha A., Yang H., Mattaini K. R., Metallo C. M., Fiske B. P., Courtney K. D., Malstrom S., Khan T. M., Kung C., Skoumbourdis A. P., Veith H., Southall N., Walsh M. J., Brimacombe K. R., Leister W., Lunt S. Y., Johnson Z. R., Yen K. E., Kunii K., Davidson S. M., Christofk H. R., Austin C. P., Inglese J., Harris M. H., Asara J. M., Stephanopoulos G., Salituro F. G., Jin S., Dang L., Auld D. S., Park H. W., Cantley L. C., Thomas C. J., and Vander Heiden M. G. (2012) Pyruvate kinase M2 activators promote tetramer formation and suppress tumorigenesis. Nat. Chem. Biol. 8, 839–847 [DOI] [PMC free article] [PubMed] [Google Scholar]
- 32. Anastasiou D., Poulogiannis G., Asara J. M., Boxer M. B., Jiang J. K., Shen M., Bellinger G., Sasaki A. T., Locasale J. W., Auld D. S., Thomas C. J., Vander Heiden M. G., and Cantley L. C. (2011) Inhibition of pyruvate kinase M2 by reactive oxygen species contributes to cellular antioxidant responses. Science 334, 1278–1283 [DOI] [PMC free article] [PubMed] [Google Scholar]
- 33. Chen H. M., Yu Y. N., Wang J. L., Lin Y. W., Kong X., Yang C. Q., Yang L., Liu Z. J., Yuan Y. Z., Liu F., Wu J. X., Zhong L., Fang D. C., Zou W., and Fang J. Y. (2013) Decreased dietary fiber intake and structural alteration of gut microbiota in patients with advanced colorectal adenoma. Am. J. Clin. Nutr. 97, 1044–1052 [DOI] [PubMed] [Google Scholar]
- 34. O'Keefe S. J. (2016) Diet, microorganisms and their metabolites, and colon cancer. Nat. Rev. Gastroenterol. Hepatol. 13, 691–706 [DOI] [PMC free article] [PubMed] [Google Scholar]
- 35. Jurica M. S., Mesecar A., Heath P. J., Shi W., Nowak T., and Stoddard B. L. (1998) The allosteric regulation of pyruvate kinase by fructose-1,6-bisphosphate. Structure 6, 195–210 [DOI] [PubMed] [Google Scholar]
- 36. Chaneton B., Hillmann P., Zheng L., Martin A. C., Maddocks O. D., Chokkathukalam A., Coyle J. E., Jankevics A., Holding F. P., Vousden K. H., Frezza C., O'Reilly M., and Gottlieb E. (2012) Serine is a natural ligand and allosteric activator of pyruvate kinase M2. Nature 491, 458–462 [DOI] [PMC free article] [PubMed] [Google Scholar]
- 37. Maddocks O. D., Berkers C. R., Mason S. M., Zheng L., Blyth K., Gottlieb E., and Vousden K. H. (2013) Serine starvation induces stress and p53-dependent metabolic remodelling in cancer cells. Nature 493, 542–546 [DOI] [PMC free article] [PubMed] [Google Scholar]
- 38. Yang W., Zheng Y., Xia Y., Ji H., Chen X., Guo F., Lyssiotis C. A., Aldape K., Cantley L. C., and Lu Z. (2012) ERK1/2-dependent phosphorylation and nuclear translocation of PKM2 promotes the Warburg effect. Nat. Cell Biol. 14, 1295–1304 [DOI] [PMC free article] [PubMed] [Google Scholar]
- 39. Bettaieb A., Bakke J., Nagata N., Matsuo K., Xi Y., Liu S., AbouBechara D., Melhem R., Stanhope K., Cummings B., Graham J., Bremer A., Zhang S., Lyssiotis C. A., Zhang Z. Y., Cantley L. C., Havel P. J., and Haj F. G. (2013) Protein tyrosine phosphatase 1B regulates pyruvate kinase M2 tyrosine phosphorylation. J. Biol. Chem. 288, 17360–17371 [DOI] [PMC free article] [PubMed] [Google Scholar]
- 40. Lv L., Li D., Zhao D., Lin R., Chu Y., Zhang H., Zha Z., Liu Y., Li Z., Xu Y., Wang G., Huang Y., Xiong Y., Guan K. L., and Lei Q. Y. (2011) Acetylation targets the M2 isoform of pyruvate kinase for degradation through chaperone-mediated autophagy and promotes tumor growth. Mol. Cell 42, 719–730 [DOI] [PMC free article] [PubMed] [Google Scholar]
- 41. Wang F., Wang K., Xu W., Zhao S., Ye D., Wang Y., Xu Y., Zhou L., Chu Y., Zhang C., Qin X., Yang P., and Yu H. (2017) SIRT5 desuccinylates and activates pyruvate kinase M2 to block macrophage IL-1beta production and to prevent DSS-induced colitis in mice. Cell Rep. 19, 2331–2344 [DOI] [PubMed] [Google Scholar]
Associated Data
This section collects any data citations, data availability statements, or supplementary materials included in this article.