

Abstract
Exercise is known to confer major health benefits, but the underlying mechanisms are not well understood. The systemic effects of exercise on multi-organ systems are thought to be partly because of myokines/cytokines secreted by skeletal muscle. The extent to which exercise alters cytokine expression and secretion in different muscle fiber types has not been systematically examined. Here, we assessed changes in 66 mouse cytokines in serum, and in glycolytic (plantaris) and oxidative (soleus) muscles, in response to sprint, endurance, or chronic wheel running. Both acute and short-term exercise significantly altered a large fraction of cytokines in both serum and muscle, twenty-three of which are considered novel exercise-regulated myokines. Most of the secreted cytokine receptors profiled were also altered by physical activity, suggesting an exercise-regulated mechanism that modulates the generation of soluble receptors found in circulation. A greater overlap in cytokine profile was seen between endurance and chronic wheel running. Between fiber types, both acute and chronic exercise induced significantly more cytokine changes in oxidative compared with glycolytic muscle. Further, changes in a subset of circulating cytokines were not matched by their changes in muscle, but instead reflected altered expression in liver and adipose tissues. Last, exercise-induced changes in cytokine mRNA and protein were only minimally correlated in soleus and plantaris. In sum, our results indicate that exercise regulates many cytokines whose pleiotropic actions may be linked to positive health outcomes. These data provide a framework to further understand potential crosstalk between skeletal muscle and other organ compartments.
Keywords: Cytokines, Secretome, Cell secretion, Inflammatory response, Mouse models, cytokines, exercise, skeletal muscle
Physical inactivity is a major risk factor contributing to cardio-metabolic disorders in modern society (1, 2). Conversely, regular exercise confers systemic health benefits (3–6). The underlying mechanisms responsible for the positive physiological effects of exercise, however, are not well understood (7, 8). The systemic effects of exercise on multi-organ systems has long thought to be, at least in part, because of myokines and cytokines secreted by skeletal muscle in response to exercise (9–11). These exercise-induced myokines are believed to mediate crosstalk between skeletal muscle and other organ compartments. Depending on the method used and biological contexts, proteomics-based analyses of muscle “secretome” have identified hundreds of proteins secreted by muscle cells (12–19). The functions for most of these muscle-derived secretory proteins are poorly defined, and it is unclear whether their expression and secretion are regulated by muscle contraction in vivo. Importantly, biologically potent molecules, such as cytokines, that normally exist at low levels (typically in the ng/ml and pg/ml range) are generally not detected by current proteomics methods.
The cytokine interleukin (IL) 1-6 is one of the first myokines shown to be actively secreted by contracting skeletal muscle in human (20, 21). Since its discovery, other cytokines such as IL-7 (22), IL-15 (23), leukemia inhibitory factor (LIF) (24), and vascular endothelial growth factor (VEGF) (25) have also been shown to be functionally relevant exercise-induced myokines, either acting in an autocrine/paracrine manner within muscle or acting via an endocrine fashion to affect biological processes in non-muscle tissues. Recent in vitro studies using electrical pulse stimulation of primary human myotubes and antibody-based detection approaches also identified significant numbers of contraction-induced myokines/cytokines (26, 27). Although these in vitro studies allow the unequivocal identification of bona fide muscle cell-derived myokines, limitations to these cell models have also been noted. Although differentiated primary myotubes in culture disk serve as a reasonable proxy for mature muscle cells, they do not capture the three-dimensional muscle fibers in the context of other potentially important accessory cell types (e.g. vascular endothelial cells, satellite cells, immune cells, and sympathetic nerve cells), nor do the cultured myotubes fully resemble the metabolically distinct glycolytic and oxidative fiber types. Further, electrical pulse stimulation of myotubes does not fully recapitulate both the stimulatory and inhibitory pathways induced by exercising skeletal muscle (28). As such, in vivo studies in humans or animal models will complement and extend the in vitro studies, enabling a more complete understanding of skeletal muscle's response to exercise.
Cytokines, chemokines, and secreted cytokine receptors constitute a large family of secretory proteins with pleiotropic immune and non-immune functions (29–33). As such, changes in local and systemic levels of these molecules in response to exercise could potentially account, at least in part, for the positive effects of physical activities. The present studies aimed to address three related questions. First, although a handful of cytokines has thus far been shown to be secreted by exercising muscle in vivo, the extent to which different types of physical activity (sprint, endurance, voluntary wheel running) regulates cytokine expression and secretion in glycolytic versus oxidative muscle fibers has not been systematically examined. Most human exercise studies examined transcriptional and protein changes in vastus lateralis, a quadriceps muscle with mixed fiber types. The metabolism of in vitro differentiated primary human myotubes also tended to be glycolytic rather than oxidative. Thus, the use of mouse exercise models allows us to address questions that are difficult to study in humans and primary cell culture system. Second, it is generally assumed that changes in serum cytokine in response to exercise are directly related to changes in their expression and secretion in skeletal muscle. It remains unknown to what extent the changes in plasma cytokine levels is because of secondary adaptive changes in their expression and secretion in non-muscle tissues in response to exercise. This could potentially occur if the primary exercise-induced cytokines in turn stimulate the expression and secretion of secondary cytokines in other non-muscle tissues. Thirdly, several transcriptomics studies have been carried out to look at changes in human muscle gene expression in response to exercise (34–37). Whether changes in mRNA level translate into changes in protein level in human skeletal muscle are often not examined, in large part limited by the availability of protein-specific antibodies and the cost of validating many candidate proteins.
With the use of the conventional ELISA method, it is not feasible to simultaneously measure the levels of large numbers of cytokines in a mouse because of limited blood volume that could be sampled. Technological advancement in recent years has made it feasible now to simultaneously quantify many cytokines in serum and tissues using only small volume of blood or quantity of tissue. Using a bead-based multiplex profiling method, we seek to measure cytokine levels in mice in response to an acute sprint or endurance run, or a short-term access to a running wheel for 1 week (representing chronic exercise). Here, we examined a total of 66 known cytokines (including secreted cytokine receptors and acute phase proteins) that represent a well-studied set of molecules with diverse functions and activities. These cytokines act on diverse cell types to modulate a variety of biological processes that include inflammation, chemotaxis, apoptosis, metabolism, angiogenesis, and cell proliferation (38). Given the pleiotropic systemic effects of exercise, we hypothesized that acute and chronic exercise would dynamically alter cytokine levels in circulation and in different muscle fiber types (e.g. oxidative and glycolytic). Indeed, our results show that exercise modulates the expression of a large number of cytokines in different muscle fiber types depending on the type of physical activity (sprint, endurance, or chronic wheel running). Many of these cytokines are considered novel exercise-regulated myokines. Concordance between mRNA and protein level was observed for only a small subset of cytokines. Further, we showed that a subset of circulating cytokines is likely induced and secreted in non-muscle tissues in response to exercise, highlighting the primary skeletal muscle response to exercise and the secondary adaptive response in nonmuscle tissues.
EXPERIMENTAL PROCEDURES
Animals
Eight-week-old C57BL/6J male mice were purchased from The Jackson Labs. All mice were housed in polycarbonate cages under a 12:12-h light-dark photocycle (6 AM - 6 PM) and had access to food and water ad libitum throughout the study period. Mice were allowed to acclimate for 1 week before experimentation. All animal experiments were approved by the Animal Care and Use Committee of The Johns Hopkins University School of Medicine.
Mice were randomly divided into 4 groups of 10 mice for the following control or exercise paradigms: sedentary, sprint exercise, endurance exercise, and voluntary exercise. At 9 weeks of age, blood was collected from the tail vein for pre-exercise measurements from all mice, including the sedentary group. Although serum samples from the sedentary group were not used for analysis, blood was still collected from this group to normalize treatment and handling among all groups. Samples were collected at the same time of day for all mice (10:30 AM). Serum was separated using Microvette® CB 300 LH (The SARSTEDT Group, Numbrecht, Germany), and separated serum was stored at −80 °C until analysis.
For sprint and endurance exercise conditions, mice were acclimatized to the treadmill (Exer 3/6 treadmill; Columbus Instruments, Columbus, OH) for 3 days before the exercise test as follows: day 1: mice were placed on the stationary treadmill for 10 min (with the shock grid on); day 2: mice were run on the treadmill at a speed of 5 m/min for 10 min at a 10° incline; day 3: mice were run on the treadmill at 10 m/min for 10 min at a 10° incline. A shock grid at the back of the treadmill encouraged mice to continue running by administering a mild shock each time they stepped off the belt. The acute exercise tests were performed on the fourth day when the mice were 10 weeks of age.
Sprint exercise: Baseline blood glucose and lactate levels were measured with glucose and lactate meters (Nova Biomedical, Waltham, MA) from a drop of blood obtained through the tail vein. Mice were run on the treadmill set to a fixed incline of 15° until exhaustion using the following speed protocol: 5 m/min for 1 min, 10 m/min for 2 min, then 2 min intervals of the following speeds (m/min): 10, 14, 18, 22, 26, 28, 30, 32, 34, 36, 38, 40. Mice were run in multiple groups beginning at 9:30 AM. A mouse was considered exhausted when it remained on the shock grid for 5 continuous seconds and, after being blown by one puff of air at 5 s, still didn't move back to treadmill within 2 s of the air puff. Immediately after finishing the run, blood glucose and lactate levels were measured (Table I). Within 5 min of finishing the run, mice were anesthetized with isoflurane, euthanized with cervical dislocation, and the following tissues were collected: blood from the retro-orbital sinus via heparin-coated capillary tubes (Fisher 22-362-566, Waltham, MA), soleus, plantaris, and gastrocnemius muscles, visceral (epididymal) and subcutaneous (inguinal) white adipose tissue, and liver. Separated serum and tissues were flash frozen in liquid nitrogen, and all samples were stored at −80 °C until analysis.
Table I. Body weight, total run time and distance, and pre- and postexercise blood glucose and lactate levels. All values shown as average ± S.E. n = 10 mice per group.
| Body weight (g) | Pre-exercise Glucose (mg/dL) | Pre-exercise Lactate (mm) | Total run Time (min) | Total run distance (m) | Post-exercise Glucose (mg/dL) | Post-exercise Lactate (mm) | |
|---|---|---|---|---|---|---|---|
| Sprint | 25.7 ± 0.6 | 186 ± 6 | 2.0 ± 0.3 | 11 ± 1 | 156 ± 20 | 199 ± 9 | 11.0 ± 0.6 |
| Endurance run | 26.6 ± 0.6 | 176 ± 5 | 3.0 ± 0.4 | 72 ± 5 | 912 ± 85 | 210 ± 6 | 5.5 ± 0.3 |
| Voluntary wheel running | 25.7 ± 0.5 | 187 ± 6 | – | ||||
| Sedentary | 25.3 ± 0.4 | 193 ± 6 | 2.3 ± 0.2 |
Endurance exercise: Baseline blood glucose and lactate levels were measured and then mice were run on the treadmill at a fixed incline of 10° until exhaustion using the following speed protocol: 10 m/min for 30 min, then an increase of 2 m/min every 15 min thereafter. Mice were run in multiple groups beginning at 9:30 AM. Mice were considered exhausted using the same criteria as detailed above. After measuring post-run glucose and lactate values (Table I), mice were euthanized within 5 min of finishing the run and tissues were collected in the same manner as described above.
Voluntary exercise: At 10 weeks of age, mice were separated into individual cages and a running wheel (Columbus Instrument) was placed in each cage such that mice had free access to it. This represents a form of chronic exercise. After 1 week, mice were sacrificed, and tissues were collected as described above. Running wheels were left in the cages until the time of sacrifice (10:30 AM).
Sedentary control: At 10 weeks of age, mice that are normally housed in the cage (with no running wheel) were sacrificed and tissues were collected as described above. Mice were sacrificed at 10:00 AM.
Throughout the study, all mice were treated in the exact same manner, except for the exercise itself, to facilitate accurate analysis by minimizing any potential confounding factors.
Muscle Lysate Preparation
One plantaris and one soleus muscle from each mouse was used. Muscles were lysed in 500 μl PBS supplemented with protease inhibitor mixture (Sigma, St. Louis, MO). First, muscles were homogenized with a 1 ml glass dounce homogenizer (Wheaton, Millville, NJ), using the loose pestle followed by the tight pestle. Subsequently, the suspension was subjected to sonication to complete the tissue lysis (Branson Sonifier 150; 5–10 s at the lowest setting). Homogenates were centrifuged at 12,000 × g for 20 min at 4 °C and the supernatant was transferred to a new tube. Total protein content in the supernatant was quantified with a Bradford protein assay (Sigma), and the cleared lysate was stored at −80 °C until analysis.
Multiplex Assays for Measuring Cytokine Protein Level
Multiplex assays for 66 mouse cytokines (covering most of the well-studied cytokines) were performed using a Luminex bead-based multiplex system according to manufacturer's protocol (EMD Millipore, Billerica, MA). This method is sensitive and reproducible (39, 40) and has been validated in multiple studies (27, 41). The following 4 assay kits (covering 66 analytes according to their dynamic range) from Millipore were used to measure the concentrations of cytokines in mouse serum, soleus homogenate, and plantaris homogenate: MCYTOMAG-70K, MECY2MAG-73K, MSCRMAG-42K, and MTH17MAG-47K. IFN-γ protein levels in soleus and plantaris were measured with the kit MCYTOMAG-70K. However, IFN-γ levels in serum were measured using a more sensitive assay kit MECY2MAG-73K. Many cytokine receptors are known to be proteolytic cleaved and the soluble ligand-binding ectodomain circulates in plasma (42). Thus, secreted sCD30, sIL-1RI, sIL-1RII, sIL-2Ra, sIL-4R, sIL-6R, sTNFRI, sTNFRII, sVEGFR1, sVEGFR2, sVEGFR3, sgp130, and sRAGE were also measured as part of the 66 cytokines profiled. The experiments were set up according to the manufacturer's protocol and the assays were performed as we have previously described (43). In brief, standards were provided for each mouse cytokine, from which standard curves were generated. Serum was diluted according to the manufacturer's protocol and cleared muscle lysates were assayed undiluted. For soleus lysates, an average of 18.05 ± 6.79 pg protein was added per well, and for plantaris lysates, an average of 38.84 ± 10.43 pg protein was added per well. All samples (n = 10 mice per group) and standards were analyzed using a Luminex 200 instrument (Luminex, Austin, TX) and XPonent 3.1 Software (Millipore, Billerica, MA). Concentrations were determined for each of the 66 mouse cytokines relative to an appropriate 6-point regression standard curve in which the mean fluorescence for each cytokine standard was transformed into known concentrations (pg/ml or ng/ml). For muscle lysates, cytokine concentrations were normalized to total protein before further analysis. The multiplex assays were carried out on three separate occasions, each time with different samples: (1) pre- and post-exercise serum from sprint and endurance mice, (2) pre- and post-exercise serum from voluntary running mice, and (3) all muscle lysates from all 4 exercise regimes. All samples that were used for direct comparison or normalization were run on the same plate.
QuantiGene Plex Assay (QGP) for Measuring Cytokine mRNA Level
QuantiGene Plex assays enable simultaneous quantification of up to 80 genes of interest in a single well of a 96-well plate. This method is hybridization-based and incorporates branched DNA (bDNA) technology (44, 45). Because it relies on signal amplification rather than target amplification for direct measurement of RNA transcripts, no RNA isolation and reverse transcription is needed. QuantiGene assay has comparable or better linear range and relative accuracy when compared with standard real-time PCR method (46). All Gene-specific QuantiGene probes were validated and provided by Thermo Fisher Scientific. Soleus and plantaris muscle fibers harvested from mice were weighed, and placed on dry ice until ready to process. Five to fifteen milligrams of tissue was used in sample preparation. Tissues were lysed in 300 μl of homogenizing solution (QGP Assay Kit, Thermo Fisher Scientific, Waltham, MA) per 10 mg tissue, using an MP24 fastprep (MP Biomedicals, Santa Ana, CA) with MP lysing matrix A tubes (Cat #6910–100, MP Biomedicals). Tissue homogenates were heated at 65 °C for 1 h, with vortexing every 10 min. Heated samples were centrifuged at room temperature for 15 min at 16,000 × g to sediment the matrix, and the supernatant was transferred to clean microcentrifuge tubes. The supernatant was clarified by repeating the above centrifugation step, and the resultant supernatant transferred to another clean microcentrifuge tube. Supernatants were added directly to the QGP hybridization plate following the addition of master mix prepared according to manufacturer's instructions. The hybridization plate was incubated overnight at 57 °C with shaking at 600 rpm. The next day, the plate was processed according to manufacturer's instructions, and read on a Luminex 200 instrument (Luminex, Austin, TX). Data was analyzed and fold change calculated according to manufacturer's instructions, using Hprt and Actb as reference genes. Statistical analyses were performed using a one-way ANOVA with Dunnett's post-test with the sedentary group as the control.
Quantitative Real-time PCR Analysis
Total RNA was isolated from liver, visceral (epididymal) and subcutaneous (inguinal) white adipose tissues using Trizol® (Life Technologies, Carlsbad, CA). Random primers and GoScript reverse transcriptase (Promega) were used to generate cDNA. Quantitative real-time PCR analyses were performed on CFX Connect Real-Time system (Bio-Rad, Hercules, CA) using iTaq Universal SYBR Green Supermix (Bio-Rad). The data were normalized to 36B4 (also known as acidic ribosomal phosphoprotein P0 (RPLP0)) to generate a ΔCt value, and then a ΔΔCt was obtained by normalizing the data to the mean ΔCt of the control group (47). 36B4 gene was selected for normalization because it had the least variation across tissue samples. All primers used for real-time PCR analyses are listed in supplemental Table S1.
Confirmatory Experiment with a Second Cohort of Mice
A second independent cohort of endurance and sedentary mice was used to confirm some of the findings obtained from the multiplex assays. As before, 8-week-old C57BL/6J mice were purchased from Jackson Labs for the experiments with n = 10 per group. However, data for the endurance group reflects n = 6 because 2 mice refused to run despite being adequately acclimated to the treadmill and 2 mice were running when the treadmill experienced technical issues so had to be taken out of the study. The experiments were conducted exactly as described previously except for timing of the pre-exercise blood draws. Given that a large volume of serum was needed to satisfy the volume requirements for multiple ELISAs, blood was drawn on two separate occasions before the exercise experiment: once 3 weeks before the endurance run and once 2 weeks before the run. Serum from both blood draws was combined before it was assayed. Mice were allowed to recover for two full weeks after the last pre-exercise blood draw as opposed to the 1 week of recovery with the first cohort. Thus, the mice in this second cohort were ∼2 weeks older and a few grams heavier than their counterparts in the first cohort on the day of the experiment. Otherwise, all data including time to exhaustion, blood glucose, and blood lactate levels matched very well between the two cohorts.
Soleus and plantaris lysates were prepared as described except both muscles were used, and the volume of buffer was reduced to 350 μl. These changes were implemented to increase the signal in the ELISAs.
The following cytokines were measured via ELISA in the pre- and post-exercise serum from the endurance group and soleus and plantaris lysates from all endurance and sedentary mice: MCP-5, KC, MIP-2, MIP-3, IFNγ, and sTNFRI. ELISAs for all targets were purchased from R&D Systems except for sTNFRI, which was purchased from Thermo Scientific. Assays were carried out according to the manufacturer's protocol. Muscle lysates were assayed undiluted, and cytokine concentrations in these samples were first normalized to total protein before further analysis.
Data analysis
For a given analyte, not all samples were successfully detected in the multiplex analysis. Data for a given analyte was analyzed when analyte levels were detected in at least 3 out of the 10 samples. To enable paired t test analysis (where N ≥ 3), serum analyte levels must be detected in both pre- and post-exercise samples from the same mouse. It should be noted that the majority (∼90%) of statistically significant data were obtained from sample size n = 9–10. For statistical analysis, a paired t test was used to analyze pre-exercise versus post-exercise serum data. The nonparametric Wilcoxon matched pairs test was used to analyze data in which the differences (post minus pre) were not Gaussian. Lysate data were analyzed by 1-way-ANOVA. The means from each exercise condition were compared with that from the sedentary condition using Dunnett's post-test. p < 0.05 was considered significant. All data is reported as mean ± S.E. Data was analyzed using Graph Pad Prism 7 software. For each data set, false discovery rate analysis was also performed with GraphPad Prism 7 using the recommended two-stage step-up method of Benjamini, Krieger and Yekutieli. The false discovery rate (Q) was set to 5%.
RESULTS
Three exercise paradigms—sprint, endurance exercise, and voluntary wheel running—representing acute and chronic forms of physical activity, were used in the present study to assess changes in circulating serum cytokines, as well as their protein levels in glycolytic (plantaris) and oxidative (soleus) muscles. A bead-based multiplex profiling method was used to quantify 66 cytokines in both serum and muscle lysates. We could reliably detect and measure up to 52 cytokines from among the 66 cytokines profiled (Tables II and III). This is not surprising given that some cytokines are expressed at very low levels and are only up-regulated in the context of immune activation in response to infection. Remarkably, a large fraction of the cytokines detected were significantly altered by acute and chronic exercise (Tables II and III). When adjusted for false discovery, most of the significant changes remain (supplemental Table S2 and S3). Using a second independent cohort of mice subjected to an endurance run, we confirmed the validity of the multiplex assay using the standard, conventional ELISA method. Of the six chosen targets analyzed, three (CCL12, CXCL1, and CXCL2) were significantly different between pre- and post-exercise serum, and the direction of change matched that of the multiplex data (supplemental Fig. S1). Similarly, three targets were significantly different between sedentary and exercised soleus, and the direction of change matched that of the multiplex data (CCL12, IFN-γ, and sTNFRI). In agreement with the multiplex data, none of the targets (except sTNFRI) were significantly different between sedentary and exercised plantaris as measured by ELISA.
Table II. Summary of cytokine protein levels in serum in response to sprint, endurance run, or voluntary wheel running for 1 week. All values shown as average ± S.E. Those cytokines that are below the detection limit of the assay are indicated by “–”. n = 10 mice per group. *p < 0.05; **p < 0.01; ***p < 0.001.
| Analyte | Serum cytokine |
|||||
|---|---|---|---|---|---|---|
| Sprint |
Endurance |
1-week wheel running |
||||
| Pre-exercise (pg/ml) | Postexercise (pg/ml) | Pre-exercise (pg/ml) | Postexercise (pg/ml) | Pre-exercise (pg/ml) | Post-exercise (pg/ml) | |
| G-CSF | 290 ± 26 | 341 ± 73 | 343 ± 69 | 250 ± 33 | 3244 ± 457 | 787 ± 149*** |
| Eotaxin-1/CCL11 | 1265 ± 171 | 1526 ± 233 | 1417 ± 261 | 1654 ± 216 | 1344 ± 378 | 1475 ± 342 |
| GM-CSF | 77 ± 32 | 52 ± 10 | – | 30 ± 9 | 48 ± 11 | 69 ± 30 |
| IFN-β1 | – | – | – | – | – | – |
| IFN-γ | 491 ± 50 | 337 ± 49** | 472 ± 37 | 285 ± 36*** | 367 ± 54 | 113 ± 10** |
| IL-1α | 111 ± 15 | 125 ± 12 | 125 ± 25 | 122 ± 22 | 148 ± 27 | 247 ± 84 |
| IL-1β | 37 ± 15 | 20 ± 7 | 21 ± 5 | 37 ± 14 | – | 23 ± 6 |
| IL-2 | – | – | – | – | 8 ± 1 | 6 ± 3 |
| IL-3 | – | – | – | – | – | – |
| IL-4 | – | – | – | – | – | – |
| IL-5 | 13 ± 2 | 9 ± 1 | 15 ± 3 | 11 ± 1 | 11 ± 2 | |
| IL-6 | 15 ± 4 | 30 ± 11 | 11 ± 2 | 9 ± 0 | 56 ± 10 | 15 ± 3* |
| IL-7 | 13 ± 2 | 5 ± 1 | 6 ± 1 | |||
| IL-9 | 377 ± 131 | 443 ± 308 | 669 ± 549 | 501 ± 155 | 229 ± 45 | 272 ± 40 |
| IL-10 | 13 ± 3 | 10 ± 2 | – | – | 4 ± 1 | 9 ± 4 |
| IL-11 | 304 ± 49 | 274 ± 21 | 416 ± 40 | 476 ± 115 | – | – |
| IL-12 (p40) | 15 ± 3 | 17 ± 2 | 10 ± 1 | 14 ± 3 | 15 ± 5 | 15 ± 4 |
| IL-12 (p70) | 20 ± 5 | 26 ± 9 | 12 ± 5 | 17 ± 6 | ||
| IL-13 | 36 ± 4 | 42 ± 1 | 32 ± 0 | 40 ± 4 | 11 ± 2 | 10 ± 2 |
| IL-15 | 33 ± 17 | 42 ± 17 | 64 ± 51 | 78 ± 26 | 63 ± 27 | 100 ± 36 |
| IL-16 | 3525 ± 311 | 2590 ± 431* | 4062 ± 338 | 2321 ± 186*** | 4761 ± 747 | 1509 ± 147** |
| IL-17A | – | – | – | – | – | – |
| IL-17A/F | 1922 ± 77 | 1567 ± 73* | 1919 ± 126 | 1828 ± 295 | 286 ± 39 | 203 ± 15 |
| IL-17F | – | – | – | 10 ± 5 | 14 ± 8 | |
| IL-20 | 1431 ± 187 | 2183 ± 343* | 1568 ± 220 | 2427 ± 446 | 434 ± 91 | 359 ± 76 |
| IL-21 | – | – | – | – | – | – |
| IL-22 | 7 ± 3 | 53 ± 49 | 9 ± 2 | 10 ± 2 | 15 ± 5 | 9 ± 2 |
| IL-23 | 388 ± 66 | 884 ± 212 | 410 ± 53 | 762 ± 106 | 735 ± 91 | 352 ± 61 |
| IL-27 | 1212 ± 186 | 1311 ± 137 | 920 ± 120 | 1110 ± 72 | 1307 ± 307 | 1201 ± 102 |
| IL-28B | – | 17104 ± 9808 | – | – | – | 119 ± 22 |
| IL-33 | – | 2062 ± 2016 | – | 98 ± 31 | – | – |
| IP-10/CXCL10 | 159 ± 9 | 154 ± 19 | 172 ± 13 | 109 ± 19* | 246 ± 19 | 229 ± 7 |
| KC/CXCL1 | 125 ± 25 | 309 ± 78* | 143 ± 27 | 284 ± 30** | 619 ± 110 | 392 ± 52* |
| LIF | – | – | – | – | – | – |
| LIX/CXCL5 | 5100 ± 1955 | 4250 ± 1027 | 3935 ± 1499 | 4771 ± 1302 | 717 ± 224 | 2998 ± 1013 |
| MCP-1/CCL2 | 102 ± 25 | 102 ± 13 | 61 ± 8 | 77 ± 7 | 27 ± 6 | 49 ± 9 |
| M-CSF | 21 ± 7 | 35 ± 10 | 23 ± 9 | 14 ± 3 | 14 ± 4 | |
| MIG/CXCL9 | 171 ± 13 | 208 ± 17 | 188 ± 22 | 172 ± 17 | 136 ± 14 | 151 ± 20 |
| MIP-1α/CCL3 | 74 ± 11 | 90 ± 7 | 68 ± 5 | 85 ± 16 | 40 ± 11 | 51 ± 14 |
| MIP-1β/CCL4 | 41 ± 6 | 38 ± 4 | 35 ± 0 | 36 ± 13 | 46 ± 5 | 37 ± 4 |
| MIP-2/CXCL2 | 199 ± 32 | 215 ± 21 | 124 ± 13 | 169 ± 15* | 206 ± 56 | 270 ± 28 |
| RANTES/CCL5 | 24 ± 4 | 26 ± 3 | 17 ± 2 | 19 ± 2 | 16 ± 2 | 16 ± 3 |
| TNF-α | 9 ± 0 | 11 ± 2 | 9 ± 1 | 14 ± 3 | 15 ± 4 | 15 ± 4 |
| VEGF | – | – | – | – | – | – |
| Exodus-2/CCL21 | 10433 ± 392 | 10817 ± 635 | 11022 ± 379 | 11095 ± 433 | 20853 ± 1796 | 20777 ± 1125 |
| Fractalkine/CX3CL1 | 2431 ± 92 | 2607 ± 116 | 2427 ± 57 | 2770 ± 119* | 609 ± 47 | 730 ± 47 |
| MDC/CCL22 | 394 ± 46 | 492 ± 53 | 496 ± 48 | 455 ± 40 | 161 ± 34 | 136 ± 20 |
| MCP-5/CCL12 | 416 ± 36 | 392 ± 33 | 368 ± 37 | 293 ± 31* | 252 ± 36 | 160 ± 23** |
| MIP-3α/CCL20 | 269 ± 11 | 237 ± 9 | 272 ± 11 | 215 ± 10* | 102 ± 6 | 74 ± 4** |
| MIP-3β/CCL19 | 687 ± 52 | 676 ± 71 | 745 ± 70 | 776 ± 122 | 143 ± 29 | 77 ± 12 |
| TARC/CCL17 | 327 ± 13 | 227 ± 12*** | 359 ± 61 | 176 ± 9** | 73 ± 10 | 56 ± 6 |
| TIMP-1 | 4641 ± 198 | 4515 ± 678 | 4842 ± 222 | 2905 ± 52*** | 5184 ± 372 | 3313 ± 179*** |
| sCD30 | – | – | – | – | – | 67 ± 0 |
| sgp130 | 658 ± 69 | 430 ± 53* | 527 ± 32 | 459 ± 43 | 616 ± 56 | 649 ± 54 |
| sIL-1RI | 1760 ± 298 | 1679 ± 198 | 2189 ± 263 | 1705 ± 210 | 2914 ± 362 | 1966 ± 378 |
| sIL-1RII | 6343 ± 149 | 6348 ± 117 | 6445 ± 153 | 6685 ± 134 | 11780 ± 446 | 11412 ± 281 |
| sIL-2Ra | 366 ± 25 | 376 ± 20 | 367 ± 14 | 392 ± 32 | 467 ± 21 | 448 ± 26 |
| sIL-4R | 2434 ± 477 | 1851 ± 257 | 2481 ± 311 | 1601 ± 153** | 2859 ± 204 | 2302 ± 163 |
| sIL-6R | 11627 ± 508 | 10710 ± 437 | 11691 ± 226 | 11713 ± 487 | 19337 ± 639 | 17804 ± 754 |
| sRAGE | 252 ± 63 | 332 ± 140 | 347 ± 154 | – | – | – |
| sTNFRI | 2786 ± 205 | 2823 ± 196 | 3032 ± 252 | 2101 ± 139*** | 8200 ± 597 | 6461 ± 372* |
| sTNFRII | 5833 ± 559 | 5028 ± 292 | 5851 ± 663 | 5156 ± 589** | 9591 ± 572 | 7926 ± 288* |
| sVEGFR1 | 997 ± 349 | 618 ± 100 | 507 ± 70 | 507 ± 74 | 368 ± 79 | 707 ± 240 |
| sVEGFR2 | 33031 ± 1833 | 28423 ± 2901 | 29170 ± 1504 | 36032 ± 1903 | – | – |
| sVEGFR3 | 26831 ± 1438 | 28009 ± 711 | 29247 ± 448 | 29785 ± 888 | 61281 ± 2402 | 62438 ± 2043 |
| EPO | 1257 ± 98 | 1393 ± 82* | 1030 ± 85 | 1143 ± 73 | 123 ± 10 | 100 ± 16 |
| # of cytokine detected | 48 | 45 | 49 | |||
| # of cytokine changed | 8 | 13 | 10 | |||
| % of cytokine changed | 17% | 29% | 20% | |||
Table III. Summary of cytokine protein levels in soleus and plantaris muscles in response to sprint, endurance run, or voluntary wheel running for 1 week. All values are normalized to the control sedentary group and shown as fold change ± S.E. Those cytokines that are below the detection limit of the assay are indicated by “–”. n = 10 mice per group. *p < 0.05; **p < 0.01; ***p < 0.001.
| Analyte | Soleus (protein) |
Plantaris (protein) |
||||
|---|---|---|---|---|---|---|
| Sprint/Sedentary (Fold change) | Endurance/Sedentary (Fold change) | Voluntary wheel running/Sedentary (Fold change) | Sprint/Sedentary (Fold change) | Endurance/Sedentary (Fold change) | Voluntary wheel running/Sedentary (Fold change) | |
| G-CSF | – | – | – | – | – | – |
| Eotaxin-1/CCL11 | 1.09 ± 0.08 | 0.82 ± 0.03 | ***0.57 ± 0.01 | 1.10 ± 0.07 | 0.96 ± 0.10 | **0.64 ± 0.05 |
| GM-CSF | 1.57 ± 0.34 | 1.35 ± 0.21 | – | 0.36 ± 0.08 | 0.43 ± 0.13 | 0.17 ± 0.03 |
| IFN-β1 | – | – | – | – | – | – |
| IFN-γ | *1.47 ± 0.12 | *1.55 ± 0.22 | ***0.10 ± 0.01 | 0.67 ± 0.10 | 0.97 ± 0.21 | **0.15 ± 0.02 |
| IL-1α | *1.23 ± 0.10 | ***1.40 ± 0.08 | ***0.20 ± 0.01 | 0.83 ± 0.07 | 1.05 ± 0.18 | **0.31 ± 0.02 |
| IL-1β | *1.57 ± 0.17 | ***1.86 ± 0.18 | 1.13 ± 0.03 | 1.17 ± 0.08 | *1.36 ± 0.10 | 0.78 ± 0.05 |
| IL-2 | 1.21 ± 0.08 | *1.28 ± 0.09 | ***0.18 ± 0.01 | 0.80 ± 0.08 | 1.02 ± 0.17 | **0.32 ± 0.02 |
| IL-3 | – | – | – | – | – | – |
| IL-4 | 1.07 ± 0.13 | 0.81 ± 0.13 | – | 0.76 ± 0.09 | 0.97 ± 0.18 | **0.32 ± 0.02 |
| IL-5 | 2.16 ± 0.46 | 1.14 ± 0.20 | 0.36 ± 0.06 | 0.63 ± 0.21 | 0.49 ± 0.18 | 0.20 ± 0.10 |
| IL-6 | *1.29 ± 0.10 | **1.42 ± 0.12 | ***0.17 ± 0.01 | 0.81 ± 0.08 | 1.06 ± 0.18 | ***0.22 ± 0.01 |
| IL-7 | – | – | – | 0.74 ± 0.15 | 1.48 ± 0.54 | – |
| IL-9 | 1.13 ± 0.06 | ***1.35 ± 0.07 | ***0.22 ± 0.02 | 0.86 ± 0.08 | 1.08 ± 0.14 | ***0.19 ± 0.02 |
| IL-10 | *2.22 ± 0.51 | 1.33 ± 0.17 | 1.08 ± 0.26 | 0.79 ± 0.14 | 0.94 ± 0.20 | 1.24 ± 0.16 |
| IL-11 | – | – | – | – | – | – |
| IL-12 (p40) | **1.73 ± 0.18 | ***2.10 ± 0.15 | ***0.16 ± 0.01 | 0.75 ± 0.13 | 0.86 ± 0.13 | ***0.10 ± 0.01 |
| IL-12 (p70) | – | – | – | – | – | – |
| IL-13 | – | – | – | 0.48 ± 0.11 | 0.75 ± 0.19 | 0.21 ± 0.03 |
| IL-15 | 1.65 ± 0.22 | **2.06 ± 0.21 | *0.14 ± 0.02 | *0.56 ± 0.10 | 0.76 ± 0.11 | ***0.05 ± 0.01 |
| IL-16 | 0.89 ± 0.08 | 0.71 ± 0.03 | ***1.88 ± 0.18 | 1.14 ± 0.08 | 0.98 ± 0.09 | 0.90 ± 0.11 |
| IL-17A | – | – | – | 0.63 ± 0.10 | 0.90 ± 0.18 | – |
| IL-17A/F | – | – | – | – | – | – |
| IL-17F | – | – | – | – | – | – |
| IL-20 | 1.23 ± 0.08 | 1.56 ± 0.13 | *1.70 ± 0.19 | 0.71 ± 0.13 | 1.62 ± 0.54 | 0.97 ± 0.23 |
| IL-21 | – | – | – | – | – | – |
| IL-22 | *1.51 ± 0.18 | 1.35 ± 0.17 | **0.28 ± 0.01 | 0.83 ± 0.11 | 0.71 ± 0.11 | ***0.23 ± 0.01 |
| IL-23 | 1.28 ± 0.13 | 1.22 ± 0.26 | – | 0.47 ± 0.06 | 0.53 ± 0.08 | – |
| IL-27 | – | – | – | 0.77 ± 0.08 | 0.91 ± 0.17 | – |
| IL-28B | – | – | – | 0.65 ± 0.07 | 0.71 ± 0.11 | – |
| IL-33 | 1.04 ± 0.11 | *0.61 ± 0.07 | *0.64 ± 0.06 | 1.27 ± 0.17 | 0.86 ± 0.12 | 0.62 ± 0.07 |
| IP-10/CXCL10 | *1.58 ± 0.14 | *1.61 ± 0.19 | 1.01 ± 0.13 | 0.81 ± 0.05 | 0.96 ± 0.10 | ***0.25 ± 0.05 |
| KC/CXCL1 | 1.52 ± 0.11 | **1.72 ± 0.26 | *0.45 ± 0.02 | 0.61 ± 0.0769 | 1.01 ± 0.17 | ***0.12 ± 0.01 |
| LIF | – | – | – | – | – | – |
| LIX/CXCL5 | – | – | – | 0.49 ± 0.09 | 0.85 ± 0.21 | – |
| MCP-1/CCL2 | 1.22 ± 0.16 | 1.46 ± 0.31 | 0.96 ± 0.18 | 1.21 ± 0.19 | 1.15 ± 0.14 | 0.91 ± 0.20 |
| M-CSF | 1.68 ± 0.32 | 0.90 ± 0.21 | 0.34 ± 0.03 | 0.75 ± 0.07 | 0.89 ± 0.16 | ***0.24 ± 0.01 |
| MIG/CXCL9 | 1.51 ± 0.09 | 1.56 ± 0.21 | 1.35 ± 0.27 | 1.06 ± 0.06 | 1.01 ± 0.08 | ***0.39 ± 0.07 |
| MIP-1α/CCL3 | 1.45 ± 0.16 | 1.54 ± 0.14 | 1.18 ± 0.06 | 1.22 ± 0.09 | ***1.51 ± 0.10 | **0.60 ± 0.07 |
| MIP-1β/CCL4 | – | – | – | – | – | – |
| MIP-2/CXCL2 | 1.58 ± 0.29 | ***2.89 ± 0.39 | 1.30 ± 0.18 | 0.45 ± 0.12 | 0.82 ± 0.26 | 0.18 ± 0.05 |
| RANTES/CCL5 | *1.46 ± 0.15 | *1.49 ± 0.18 | ***0.21 ± 0.01 | 0.76 ± 0.10 | 0.73 ± 0.13 | ***0.19 ± 0.02 |
| TNF-α | – | – | – | – | – | – |
| VEGF | **0.64 ± 0.09 | ***0.63 ± 0.05 | ***0.38 ± 0.03 | ***0.62 ± 0.05 | **0.70 ± 0.05 | *0.76 ± 0.07 |
| Exodus-2/CCL21 | 0.70 ± 0.12 | *0.54 ± 0.11 | 0.69 ± 0.06 | 1.08 ± 0.07 | 0.80 ± 0.05 | *0.66 ± 0.11 |
| Fractalkine/CX3CL1 | – | – | **0.62 ± 0.05 | – | 1.09 ± 0.34 | – |
| MDC/CCL22 | 1.12 ± 0.10 | 1.16 ± 0.10 | 0.80 ± 0.06 | 0.87 ± 0.07 | 1.04 ± 0.17 | 0.63 ± 0.11 |
| MCP-5/CCL12 | 0.61 ± 0.08 | *0.42 ± 0.06 | *1.51 ± 0.18 | 0.73 ± 0.08 | 0.73 ± 0.15 | 0.92 ± 0.24 |
| MIP-3α/CCL20 | 1.11 ± 0.06 | *1.20 ± 0.05 | ***0.33 ± 0.01 | 0.84 ± 0.06 | 0.90 ± 0.14 | ***0.29 ± 0.03 |
| MIP-3β/CCL19 | 1.20 ± 0.16 | 1.00 ± 0.11 | **1.65 ± 0.14 | 0.96 ± 0.09 | 1.15 ± 0.08 | 0.86 ± 0.11 |
| TARC/CCL17 | – | – | – | – | – | – |
| TIMP-1 | 0.76 ± 0.09 | 0.55 ± 0.06 | ***4.16 ± 0.67 | 0.87 ± 0.11 | 0.78 ± 0.13 | *3.01 ± 1.01 |
| sCD30 | 0.95 ± 0.05 | 0.82 ± 0.07 | 0.77 ± 0.03 | 0.88 ± 0.13 | 0.83 ± 0.26 | |
| sgp130 | 1.09 ± 0.11 | 1.34 ± 0.11 | *0.60 ± 0.09 | 1.39 ± 0.11 | 1.64 ± 0.25 | 2.02 ± 1.12 |
| sIL-1RI | 1.10 ± 0.09 | 1.14 ± 0.04 | ***0.57 ± 0.03 | 0.86 ± 0.06 | 1.03 ± 0.07 | **0.66 ± 0.06 |
| sIL-1RII | 1.04 ± 0.10 | 0.78 ± 0.05 | 0.78 ± 0.06 | *1.65 ± 0.33 | 1.19 ± 0.08 | 0.82 ± 0.11 |
| sIL-2Ra | – | – | – | – | – | – |
| sIL-4R | – | – | – | – | – | – |
| sIL-6R | 1.08 ± 0.17 | 0.80 ± 0.10 | 0.94 ± 0.07 | **2.10 ± 0.41 | 1.48 ± 0.14 | 0.69 ± 0.07 |
| sRAGE | 1.19 ± 0.10 | 1.28 ± 0.14 | ***0.17 ± 0.01 | 0.73 ± 0.06 | 0.82 ± 0.13 | ***0.16 ± 0.06 |
| sTNFRI | 0.87 ± 0.06 | **0.73 ± 0.06 | 0.82 ± 0.05 | 1.10 ± 0.07 | 1.07 ± 0.05 | 0.82 ± 0.14 |
| sTNFRII | 0.89 ± 0.06 | 0.70 ± 0.05 | ***1.66 ± 0.13 | 1.11 ± 0.07 | 1.08 ± 0.06 | 1.05 ± 0.14 |
| sVEGFR1 | 1.05 ± 0.06 | *0.79 ± 0.03 | ***0.64 ± 0.03 | 1.23 ± 0.12 | 1.32 ± 0.09 | 0.71 ± 0.07 |
| sVEGFR2 | *0.84 ± 0.04 | ***0.61 ± 0.03 | *0.83 ± 0.04 | 0.91 ± 0.05 | 0.79 ± 0.06 | 0.88 ± 0.10 |
| sVEGFR3 | 0.89 ± 0.11 | 0.90 ± 0.07 | 0.88 ± 0.04 | 1.52 ± 0.10 | 1.49 ± 0.15 | 1.46 ± 0.37 |
| EPO | 1.24 ± 0.10 | *1.40 ± 0.09 | – | 0.63 ± 0.08 | 0.90 ± 0.17 | – |
| # of cytokine detected | 45 | 45 | 42 | 51 | 52 | 44 |
| # of cytokine changed | 11 | 21 | 26 | 4 | 3 | 22 |
| % of cytokine changed | 24% | 47% | 62% | 8% | 6% | 50% |
In serum, we observed significant changes in eight (17%), thirteen (29%), and ten (20%) circulating cytokines in response to a single bout of sprint, endurance run, and 1-week voluntary wheel running, respectively (Table II). A much greater overlap was seen between a single bout of endurance run and voluntary wheel running (Fig. 1). Except for CXCL1, the direction of change in serum levels was consistent among all the overlapping cytokines in three of the exercise paradigms. Although there was overlap, a single bout of sprint and endurance run also altered different sets of cytokines (Fig. 1). Of the serum cytokines altered by acute or chronic exercise, 4 were up-regulated and 14 were downregulated.
Fig. 1.
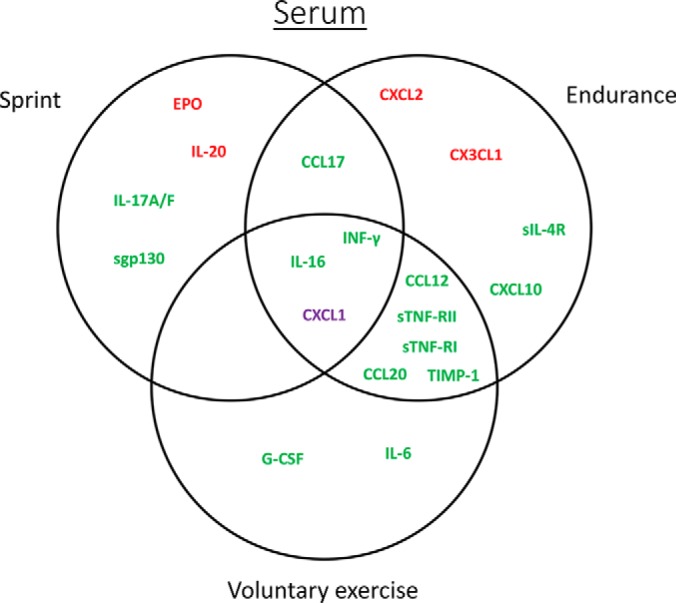
Vein diagram of cytokines altered by sprint, endurance run, or voluntary wheel running in serum. Upregulated cytokines are highlighted in red. Downregulated cytokines are highlighted in green. Cytokines that are upregulated in one exercise paradigm but downregulated in another are highlighted in purple.
In oxidative soleus muscle, an even greater proportion of the detected cytokine was altered by acute and chronic exercise relative to the sedentary control group (Table III). The protein levels of eleven (24%), twenty-one (47%), and twenty-six (62%) cytokines were significantly changed in response to a single bout of sprint, endurance run, and 1-week voluntary wheel running, respectively. Again, we observed a much greater overlap between a single bout of endurance run and 1-week voluntary wheel running (Fig. 2A). However, the direction of change (up or downregulated) among the overlapping cytokines was different depending on the types of physical activity (Table III and Fig. 2A). Despite significant overlap, different types of physical activity clearly altered different sets of cytokines in soleus muscle (Fig. 2A). Of the 34 cytokines whose levels changed in soleus muscle by acute or chronic exercise, 11 were up-regulated, 11 were downregulated, and 12 were either up or downregulated depending on the types of physical activity.
Fig. 2.

Vein diagram of cytokines altered by sprint, endurance run, or voluntary wheel running in (A) soleus and (B) plantaris muscles. Upregulated cytokines are highlighted in red. Downregulated cytokines are highlighted in green. Cytokines that are upregulated in one exercise paradigm but downregulated in another are highlighted in purple.
A very different cytokine profile was seen for the glycolytic (plantaris) when compared with the oxidative (soleus) muscle. Relative to the sedentary control group, the protein levels of four (8%), three (6%), and twenty-two (50%) cytokines were significantly changed in plantaris muscle in response to a single bout of sprint, endurance run, and 1-week voluntary wheel running, respectively (Table III). In striking contrast to the soleus muscle, only 3–4 cytokines were altered by a single bout of sprint or endurance run in the plantaris muscle (Fig. 2B). Most of the cytokine changes in plantaris were seen in mice subjected to 1-week of voluntary wheel running. Minimal (1–2 cytokines) overlap was observed in plantaris for the three different types of exercise. Of the 25 cytokines altered in plantaris muscle by acute or chronic exercise, 4 were up-regulated, 20 were downregulated, and 1 was either up or downregulated depending on the types of physical activity.
Next, we asked how many of the systemic changes in circulating serum cytokines paralleled the local protein changes in soleus and plantaris. This would help address which among the systemic cytokine changes in blood is directly because of the expression and secretion from skeletal muscle. Surprisingly, for a single bout of sprint, no overlap in cytokine profiles was seen between serum, soleus, and plantaris muscles (Fig. 3A). Different sets of cytokines were apparently altered in oxidative (soleus) and glycolytic (plantaris) muscles, with most of the changes seen in soleus muscle fibers. Combined, a total of 21 cytokines were altered by sprint, with 13 upregulated, 7 downregulated, and 1 with opposite changes between serum and soleus muscle.
Fig. 3.

Vein diagram of cytokines altered by (A) sprint, (B) endurance run, or (C) voluntary wheel running in serum and in soleus and plantaris muscles. Up-regulated cytokines are highlighted in red. Downregulated cytokines are highlighted in green. Cytokines that are up-regulated in one tissue but downregulated in another are highlighted in purple.
For a single bout of endurance run, most of the cytokine changes were seen in serum and soleus muscle (Fig. 3B). However, no overlap (common to all three) was seen between serum, soleus, and plantaris. Although seven cytokine changes showed overlap between serum and soleus muscle, the direction of change (up or downregulated) was different for three of the cytokines (Fig. 3B). Combined, a total of 28 cytokines were altered by a single bout of endurance run, with 13 upregulated, 12 downregulated, and 3 with opposite changes between serum and soleus muscle.
Of the three different types of exercise, the greatest number of cytokines changes were seen in the 1-week voluntary wheel running group relative to the sedentary control group (Fig. 3C). Large numbers of cytokine changes showed overlap between serum and soleus or plantaris, as well as as between oxidative (soleus) and glycolytic (plantaris) fibers. Interestingly, most of the cytokine changes induced by voluntary wheel running were in the “downregulated” direction (Fig. 3C; highlighted in green); in contrast, a large fraction of the cytokine changes seen in sprint and endurance run were in the “up-regulated” direction (Fig. 3A and 3B; highlighted in red). Combined, a total of 34 cytokines were altered by 1-week voluntary wheel running, with 2 up-regulated, 28 downregulated, 4 with opposite changes between different tissues.
We next examined changes in cytokine mRNA levels in oxidative (soleus) and glycolytic (plantaris) muscles in response to the three different types of exercise. We used the QuantiGene Plex assays to simultaneously measure the mRNA levels of 63 cytokines (Table IV). Except for CXCL9 transcript, we were able to detect the mRNA of 62 cytokines. Relative to the sedentary control group, the mRNA levels of six (10%), eight (13%), and fourteen (22%) cytokines were significantly changed in soleus in response to sprint, endurance run, and voluntary wheel running, respectively. In plantaris muscle, however, the mRNA levels of five (8%), thirteen (21%), and five (8%) cytokines were significantly changed in response to sprint, endurance, and voluntary wheel running, respectively. Surprisingly, most of the mRNA changes in soleus and plantaris show relatively little overlap between the three types of physical activity (Fig. 4A and 4B). In soleus muscle, 10 cytokine mRNA were up-regulated, 7 downregulated, and 3 changed in the opposing directions depending on the types of exercise. In plantaris muscle, 5 cytokine mRNA were up-regulated, 12 downregulated, and 1 changed in the opposite direction between endurance and chronic wheel running.
Table IV. Summary of cytokine mRNA levels in soleus and plantaris muscles in response to sprint, endurance run, or voluntary wheel running for 1 week. All values are normalized to the control sedentary group and shown as fold change ± S.E. Those cytokines whose mRNA that are not detected are indicated by “–”. n = 10 mice per group. *p < 0.05; **p < 0.01; ***p < 0.001.
| Accesion # | Gene | Soleus Muscle (mRNA) |
Plantaris Muscle (mRNA) |
||||
|---|---|---|---|---|---|---|---|
| Sprint/Sedentary Fold change | Endurance/sedentary Fold change | Voluntary wheel running/sedentary Fold change | Sprint/Sedentary Fold change | Endurance/sedentary Fold change | Voluntary wheel running/sedentary Fold change | ||
| NM_009971 | G-CSF/Csf-3 | 0.71 ± 0.13 | 0.45 ± 0.14 | 0.87 ± 0.18 | 1.10 ± 0.29 | – | 0.91 ± 0.22 |
| NM_009969 | GM-CSF/Csf-2 | 1.40 ± 0.18 | 1.10 ± 0.16 | 0.92 ± 0.21 | 1.13 ± 0.12 | 0.72 ± 0.05 | 0.80 ± 0.08 |
| NM_010510 | IFN-β1 | 1.50 ± 0.23 | 1.27 ± 0.19 | 1.06 ± 0.26 | 1.09 ± 0.16 | 0.82 ± 0.07 | 0.87 ± 0.08 |
| NM_008337 | IFN-γ | 1.33 ± 0.21 | 1.25 ± 0.23 | 0.92 ± 0.20 | 0.93 ± 0.10 | 0.73 ± 0.06 | 0.81 ± 0.10 |
| NM_010554 | IL-1α | 1.42 ± 0.37 | 2.18 ± 0.54 | 0.98 ± 0.15 | 1.37 ± 0.18 | 0.58 ± 0.05 | 0.94 ± 0.17 |
| NM_008361 | IL-1β | 1.28 ± 0.12 | 1.02 ± 0.17 | 1.37 ± 0.13 | 1.14 ± 0.15 | 0.73 ± 0.07 | 0.89 ± 0.11 |
| NM_008366 | IL-2 | 1.40 ± 0.45 | 2.33 ± 1.3 | 0.59 ± 0.11 | 1.24 ± 0.30 | 0.74 ± 0.13 | 1.24 ± 0.37 |
| NM_010556 | IL-3 | 1.60 ± 0.19 | 1.25 ± 0.19 | 0.98 ± 0.19 | 1.14 ± 0.13 | 0.97 ± 0.08 | 0.91 ± 0.21 |
| NM_021283 | IL-4 | 1.35 ± 0.20 | 1.05 ± 0.21 | 0.80 ± 0.19 | **2.31 ± 0.42 | 1.37 ± 0.22 | 1.55 ± 0.24 |
| NM_010558 | IL-5 | 1.34 ± 0.21 | 1.20 ± 0.20 | 0.95 ± 0.23 | 1.00 ± 0.16 | 0.71 ± 0.07 | 0.77 ± 0.08 |
| NM_031168 | IL-6 | 1.53 ± 0.25 | 1.38 ± 0.20 | 1.28 ± 0.28 | 0.91 ± 0.10 | 0.73 ± 0.06 | 0.81 ± 0.11 |
| NM_008371 | IL-7 | 1.50 ± 0.23 | 1.29 ± 0.14 | 0.93 ± 0.20 | 1.05 ± 0.12 | 0.94 ± 0.13 | 0.85 ± 0.10 |
| NM_008373 | IL-9 | 1.22 ± 0.10 | 1.13 ± 0.13 | 0.79 ± 0.17 | 1.32 ± 0.15 | 0.71 ± 0.07 | 0.84 ± 0.13 |
| NM_010548 | IL-10 | 1.34 ± 0.19 | 1.35 ± 0.33 | 0.95 ± 0.09 | 1.08 ± 0.08 | 0.73 ± 0.06 | 0.82 ± 0.19 |
| NM_008350 | IL-11 | 1.22 ± 0.18 | 1.03 ± 0.12 | 0.95 ± 0.16 | 1.14 ± 0.11 | 0.89 ± 0.06 | 0.89 ± 0.08 |
| NM_008352 | IL-12 (p40)/ IL-12B | 1.47 ± 0.16 | 1.19 ± 0.18 | *1.54 ± 0.15 | 1.24 ± 0.17 | 0.82 ± 0.06 | 1.02 ± 0.17 |
| NM_008351 | IL-12 (p70) | 1.17 ± 0.16 | 1.09 ± 0.20 | 0.96 ± 0.19 | 1.04 ± 0.10 | *0.71 ± 0.06 | 0.75 ± 0.07 |
| NM_008355 | IL-13 | 1.39 ± 0.20 | 1.35 ± 0.38 | 0.87 ± 0.18 | 1.01 ± 0.13 | 0.79 ± 0.11 | 0.87 ± 0.23 |
| NM_008357 | IL-15 | 1.07 ± 0.06 | 0.90 ± 0.07 | ***0.59 ± 0.04 | 1.09 ± 0.07 | 1.04 ± 0.04 | 1.16 ± 0.05 |
| NM_010551 | IL-16 | 1.05 ± 0.06 | **0.67 ± 0.04 | 0.86 ± 0.06 | 1.10 ± 0.08 | 0.83 ± 0.15 | 0.95 ± 0.07 |
| NM_010552 | IL-17A/CTLA8 | 1.47 ± 0.20 | 1.26 ± 0.18 | 1.06 ± 0.24 | 1.00 ± 0.14 | 0.87 ± 0.06 | 0.78 ± 0.09 |
| NM_021380 | IL-20 | 0.99 ± 0.11 | *0.57 ± 0.13 | **0.53 ± 0.10 | 0.97 ± 0.07 | ***0.55 ± 0.06 | *0.75 ± 0.06 |
| NM_021782 | IL-21 | 1.29 ± 0.18 | 1.06 ± 0.13 | 0.96 ± 0.22 | 1.26 ± 0.19 | 0.81 ± 0.08 | 0.90 ± 0.12 |
| NM_016971 | IL-22 | 1.52 ± 0.27 | 1.20 ± 0.19 | 1.07 ± 0.30 | 1.12 ± 0.14 | 0.69 ± 0.07 | 0.78 ± 0.11 |
| NM_031252 | IL-23 | 1.52 ± 0.27 | 1.33 ± 0.19 | 1.03 ± 0.25 | 0.96 ± 0.12 | 0.80 ± 0.07 | 0.82 ± 0.08 |
| NM_145636 | IL-27 | 1.25 ± 0.10 | 1.07 ± 0.14 | 0.90 ± 0.11 | 1.30 ± 0.07 | *0.90 ± 0.08 | 1.08 ± 0.17 |
| NM_177396 | IL-28B/IFNl3 | 1.29 ± 0.16 | 0.94 ± 0.11 | 0.78 ± 0.17 | 1.08 ± 0.12 | 0.67 ± 0.05 | 0.76 ± 0.12 |
| NM_029594 | IL-31 | 1.45 ± 0.26 | 1.15 ± 0.15 | 1.02 ± 0.23 | 0.96 ± 0.14 | 0.71 ± 0.05 | 0.73 ± 0.07 |
| NM_133775 | IL-33 | 1.16 ± 0.08 | *1.31 ± 0.11 | 0.94 ± 0.06 | 1.27 ± 0.10 | 1.29 ± 0.10 | 0.91 ± 0.08 |
| NM_021274 | IP-10/CXCL10 | 1.10 ± 0.17 | 1.53 ± 0.22 | *2.57 ± 0.72 | 0.72 ± 0.08 | 0.64 ± 0.15 | 0.76 ± 0.11 |
| NM_008176 | KC/CXCL1 | ***1.74 ± 0.11 | 1.36 ± 0.15 | 0.94 ± 0.10 | ***2.65 ± 0.45 | 1.45 ± 0.18 | 0.99 ± 0.12 |
| NM_008501 | LIF | 1.26 ± 0.18 | 0.95 ± 0.10 | 1.00 ± 0.16 | 0.95 ± 0.07 | **0.64 ± 0.04 | 0.81 ± 0.06 |
| NM_009141 | LIX/CXCL5 | 1.68 ± 0.35 | 1.46 ± 0.21 | 1.63 ± 0.36 | 1.35 ± 0.16 | 1.02 ± 0.06 | 1.09 ± 0.13 |
| NM_011333 | MCP-1/CCL2 | 1.24 ± 0.11 | 1.21 ± 0.09 | *2.59 ± 0.81 | 1.21 ± 0.27 | 1.12 ± 0.18 | 1.37 ± 0.23 |
| NM_007778 | M-CSF/Csf-1 | 0.97 ± 0.05 | **0.67 ± 0.03 | 0.81 ± 0.09 | 0.96 ± 0.04 | ***0.58 ± 0.03 | 0.94 ± 0.06 |
| NM_008599 | MIG/CXCL9 | – | – | – | – | – | – |
| NM_011337 | MIP-1α/CCL3 | 1.45 ± 0.20 | 1.06 ± 0.17 | 1.02 ± 0.21 | 0.95 ± 0.12 | 0.74 ± 0.07 | 0.78 ± 0.08 |
| NM_013652 | MIP-1β/CCL4 | 1.25 ± 0.13 | 1.00 ± 0.17 | 1.02 ± 0.13 | 1.12 ± 0.15 | *0.62 ± 0.10 | 0.90 ± 0.06 |
| NM_009140 | MIP-2/CXCL2 | 1.56 ± 0.25 | 1.31 ± 0.21 | 1.16 ± 0.30 | 1.11 ± 0.16 | 0.90 ± 0.09 | 0.93 ± 0.10 |
| NM_013653 | RANTES/CCL5 | 0.91 ± 0.07 | 0.71 ± 0.18 | ***2.22 ± 0.30 | 0.88 ± 0.14 | 0.55 ± 0.09 | 1.18 ± 0.21 |
| NM_013693 | TNF-α | 1.16 ± 0.21 | 0.91 ± 0.14 | 1.09 ± 0.18 | 1.11 ± 0.16 | 0.81 ± 0.04 | **1.63 ± 0.17 |
| NM_001287056 | VEGF-A | 0.97 ± 0.11 | 0.85 ± 0.03 | ***0.41 ± 0.03 | *0.85 ± 0.06 | *0.87 ± 0.02 | ***0.76 ± 0.02 |
| NM_002989 | Exodus-2/CCL21 | 1.09 ± 0.16 | 1.20 ± 0.07 | 0.78 ± 0.10 | 1.03 ± 0.06 | 0.79 ± 0.10 | *0.73 ± 0.07 |
| NM_009142 | Fractalkine/CX3CL1 | 1.03 ± 0.12 | 0.83 ± 0.08 | 1.25 ± 0.11 | 0.93 ± 0.07 | **0.70 ± 0.03 | 1.01 ± 0.08 |
| NM_009137 | MDC/CCL22 | 1.34 ± 0.20 | 1.25 ± 0.31 | 1.41 ± 0.27 | 1.17 ± 0.15 | 0.91 ± 0.08 | 1.31 ± 0.22 |
| NM_011331 | MCP-5/CCL12 | 1.32 ± 0.21 | 1.00 ± 0.11 | *1.64 ± 0.19 | 1.05 ± 0.12 | 0.74 ± 0.05 | 0.92 ± 0.09 |
| NM_016960 | MIP-3α/CCL20 | 1.36 ± 0.20 | 1.07 ± 0.12 | 1.01 ± 0.21 | 1.05 ± 0.12 | 0.76 ± 0.08 | 0.87 ± 0.09 |
| NM_011888 | MIP-3β/CCL19 | 1.23 ± 0.09 | 1.00 ± 0.15 | 0.77 ± 0.11 | 1.10 ± 0.10 | 0.79 ± 0.04 | 0.77 ± 0.07 |
| NM_011332 | TARC/CCL17 | 1.38 ± 0.16 | 1.05 ± 0.13 | 1.17 ± 0.22 | 1.16 ± 0.14 | 0.60 ± 0.06 | 0.83 ± 0.09 |
| NM_011593 | TIMP-1 | 0.84 ± 0.12 | 0.75 ± 0.05 | ***8.37 ± 2.16 | 0.88 ± 0.14 | *0.46 ± 0.05 | ***2.3 ± 0.23 |
| NM_009401 | CD30/ Tnfrsf8 | 1.36 ± 0.26 | 1.39 ± 0.25 | 1.14 ± 0.28 | 1.04 ± 0.13 | 0.67 ± 0.04 | 0.91 ± 0.10 |
| NM_010560 | gp130/ IL-6ST | **1.13 ± 0.03 | *0.88 ± 0.03 | ***0.64 ± 0.03 | 1.05 ± 0.03 | **0.87 ± 0.02 | 0.91 ± 0.03 |
| NM_008362 | IL-1RI | 1.08 ± 0.06 | 1.12 ± 0.03 | ***0.71 ± 0.02 | 1.03 ± 0.05 | 0.95 ± 0.05 | 0.95 ± 0.06 |
| NM_010555 | IL-1RII | 1.40 ± 0.14 | 1.27 ± 0.11 | 0.92 ± 0.13 | 1.05 ± 0.05 | 0.90 ± 0.07 | 0.88 ± 0.08 |
| NM_008367 | IL-2Ra | *1.53 ± 0.14 | 1.22 ± 0.13 | 0.68 ± 0.13 | *1.30 ± 0.11 | 1.01 ± 0.05 | 0.78 ± 0.07 |
| NM_001008700 | IL-4R | *1.39 ± 0.14 | **1.48 ± 0.08 | 1.18 ± 0.12 | 1.08 ± 0.07 | 1.14 ± 0.05 | 0.94 ± 0.05 |
| NM_010559 | IL-6R | *1.30 ± 0.10 | *1.31 ± 0.07 | **0.62 ± 0.06 | 1.16 ± 0.11 | **1.37 ± 0.05 | 0.87 ± 0.05 |
| NM_007425 | RAGE/Ager | 1.12 ± 0.11 | 1.13 ± 0.12 | 1.15 ± 0.13 | 1.25 ± 0.10 | 0.91 ± 0.07 | 0.96 ± 0.10 |
| NM_011609 | TNF-RI/Tnfrsf1a | 1.16 ± 0.07 | 0.93 ± 0.03 | 0.88 ± 0.04 | 1.06 ± 0.04 | **0.86 ± 0.03 | 1.04 ± 0.02 |
| NM_011610 | TNF-RII/Tnfrsf1b | 1.27 ± 0.12 | 1.21 ± 0.08 | 1.26 ± 0.09 | 1.16 ± 0.05 | 0.95 ± 0.04 | 1.01 ± 0.04 |
| NM_010228 | VEGFR1/Flt1 | *1.27 ± 0.09 | 1.10 ± 0.04 | ***0.52 ± 0.06 | 1.14 ± 0.08 | 0.99 ± 0.03 | 0.84 ± 0.03 |
| NM_010612 | VEGFR2/Kdr | 0.87 ± 0.06 | ***0.55 ± 0.03 | ***0.50 ± 0.04 | **0.77 ± 0.05 | ***0.43 ± 0.02 | 0.95 ± 0.04 |
| NM_008029 | VEGFR3/Flt4 | 1.10 ± 0.10 | 1.13 ± 0.06 | 0.81 ± 0.07 | 1.03 ± 0.05 | 0.96 ± 0.05 | 0.98 ± 0.04 |
| # of cytokine changed | 6 | 8 | 14 | 5 | 13 | 5 | |
| % of cytokine changed | 10% | 13% | 22% | 8% | 21% | 8% | |
Fig. 4.

Vein diagram of cytokine mRNA altered by sprint, endurance run, or voluntary wheel running in (A) soleus and (B) plantaris muscles. Up-regulated cytokines are highlighted in red. Downregulated cytokines are highlighted in green. Cytokines that are up-regulated in one exercise paradigm but downregulated in another are highlighted in purple.
Next, we addressed the issue of concordance between changes in cytokine mRNA and protein expression in soleus and plantaris muscles. In oxidative (soleus) muscle, parallel reductions in transcript and protein were observed for IL-15, VEGF, sIL1RI, sVEGFR1, sVEGFR2, and sgp130, whereas parallel increases were only observed for CCL12 and TIMP-1. In glycolytic (plantaris) muscle, parallel reductions in transcript and protein were observed for VEGF and CCL21, whereas a parallel increase was only observed for TIMP-1. Essentially, most of the cytokine changes reported here showed discordance between transcript and protein levels (comparing Tables III and IV).
Given that the changes in a subset of serum cytokines were not matched by the corresponding changes in their protein levels in muscle, we addressed whether this could be because of secondary adaptive changes in their expression in nonmuscle tissues. Acute and chronic exercise can alter systemic metabolism in response to energetic demands, and we have previously shown that different metabolic states alters circulating cytokine levels (43). Thus, we determined the expression of cytokine transcripts in liver and two major fat depots (visceral and subcutaneous white adipose tissues), major metabolic organs known to produce and secrete a wide array of cytokines and chemokines in response to different physiological stimuli. We focused our analyses only on those cytokines whose altered serum levels were not accounted for by changes in protein levels in skeletal muscle in response to exercise. As shown in Fig. 5, depending on the types of exercise, expression of cytokine transcripts could be either up- or down-regulated in the liver and/or adipose tissues. With a couple exceptions, most of these changes in mRNA paralleled the cytokine changes seen in circulation. For example, for a single bout of sprint, increased serum EPO and IL-20 levels were paralleled by increased mRNA expression in visceral white adipose tissue, whereas reduced serum IL-17F, sgp130, and INF-γ levels were paralleled by reduction in mRNA expression in either visceral or subcutaneous adipose tissue. For a single bout of endurance run, reduced serum sIL-4R, sTNF-RII, TIMP-1, IL-16, INF-γ, and CCL20 levels were paralleled by reduced mRNA expression in liver and/or adipose tissue. For voluntary wheel running, reduction in serum sTNF-RII, TIMP-1, and CCL12 levels were paralleled by reduced mRNA expression in subcutaneous adipose tissue. These results suggest that changes in a subset of circulating cytokines could, at least in part, be accounted for by the corresponding changes in transcript levels in liver and/or adipose tissues.
Fig. 5.

Quantitative real-time PCR analysis of select cytokine transcripts in liver and adipose tissues in response to acute and chronic exercise. Relative mRNA expression of different cytokines in liver, visceral (epididymal) and subcutaneous (inguinal) fat depots. We only focus our analysis on those cytokines whose altered circulating levels were not matched by the corresponding changes in protein levels in skeletal muscle. All mRNA expression values were normalized to 36B4. These values were then normalized to the sedentary condition and the data are shown as average ± S.E. All p values were calculated using an unpaired t test with Welch's correction (comparing the exercise condition to the sedentary condition). *< 0.05; ** p < 0.01; *** p < 0.001.
DISCUSSION
Here, we undertook an antibody-based profiling approach to determine the extent by which exercise modulates local cytokine levels in glycolytic and oxidative muscle fibers, as well as their systemic circulating levels, in response to three different types of physical activity—an acute sprint and endurance run, or chronic exercise in the form of voluntary wheel running. We chose to focus on cytokine family members as potential myokines given their well-known pleiotropic functions that could potentially link exercise to myriad physiological effects that include immunity (48), inflammation (6), metabolism (43), food intake (32, 49), and autophagy (50).
All the significant changes in cytokine mRNA and protein levels are summarized in Table V. From our antibody-based profiling studies of exercise-regulated cytokines, several notable observations are highlighted. (1) Chronic exercise in the form of wheel running consistently induced more cytokine changes than an acute single bout of sprint or endurance run. This is perhaps not surprising as repeated bouts of exercise lead to skeletal muscle adaptation (51). (2) Acute and chronic exercise appear to alter distinct sets of cytokines in serum and skeletal muscle, with varying degrees of overlap depending on the type of physical activity. This presumably reflects differences in skeletal muscle adaptation to repeated voluntary wheel running versus a stress-like response to an acute bout of exercise. (3) There is more overlap in cytokine profile between a single bout of endurance exercise and chronic wheel running, particularly in serum and oxidative soleus muscle. This suggests that exercise intensity affects the nature of the cytokine response, as endurance and chronic wheel running represent low-intensity exercise whereas an exhaustive sprint reflects high-intensity exercise. (4) We observed more exercise-regulated cytokine changes in skeletal muscle than in serum. This could reflect a higher local concentration of cytokines and hence our greater ability to reliably detect their differences. The circulating plasma levels of most cytokines are in the nanogram and picogram per milliliter range. Because of the dilution effect of plasma, only relatively large changes in cytokine secretion into circulation by skeletal muscle in response to exercise would be detected. Alternatively, a subset of exercise-regulated cytokines act locally within skeletal muscle and are not secreted into circulation. (5) Interestingly, between muscle fiber types, we observed significantly more cytokine changes in oxidative soleus compared with glycolytic plantaris muscles irrespective of the types of exercise (sprint, endurance, wheel running). With some exceptions (52), in most human exercise studies, gene and protein expression analyses were performed on quadriceps muscle biopsies consisting of mixed fiber types. As such, cytokine response to exercise in different muscle fiber types in human is largely unknown. Our study thus highlighted the utility of animal models in addressing questions difficult to answer in human-based exercise studies. (6) In oxidative soleus muscle, we observed significant overlaps in cytokine profiles in response to sprint, endurance run, and chronic wheel running. In striking contrast, only minimal overlaps in cytokine profiles were observed in glycolytic plantaris muscle. Thus, not only more cytokines are changed in soleus compared with plantaris, those changes seen in soleus also show greater overlaps between different types of physical activity. These types of unexpected insights relevant to skeletal muscle physiology illustrate the advantage of assessing gene and protein expression in different muscle fiber types. (7) In a single bout of exhaustive sprint and endurance run, we observed significantly more cytokines being up-regulated than downregulated in serum and in muscle. This may reflect normal physiological stress responses associated with acute exercise. In marked contrast, chronic voluntary wheel running predominantly resulted in cytokine down-regulation in serum and muscle. These differences likely reflect skeletal muscle adaptation to chronic exercise and may be linked to general improvements in inflammatory profiles associated with regular exercise.
Table V. Summary of all the statistically significant changes in cytokine mRNA and protein levels in response to sprint (S), endurance run (E), and voluntary wheel running (VWR).

IL-6 is the first and most widely studied exercise-regulated cytokine (53). As expected based on previous studies in humans, we observed a significant increase in IL-6 protein level in mouse skeletal muscle in response to a single bout of sprint or endurance exercise (Table III). Interestingly, only oxidative (soleus), but not glycolytic (plantaris), muscle fibers show increased IL-6 protein level in response to sprint or endurance run. One week of voluntary wheel running, however, resulted in reduced IL-6 in both soleus and plantaris, as well as in serum. This reduction presumably reflects skeletal muscle adaptation to repeated bouts of exercise. In healthy humans subjected to 10 weeks of endurance training, contraction-induced IL-6 expression was reduced (54). Intriguingly, neither sprint nor endurance run acutely raised the circulating level of IL-6 in serum (Table II). This could be because of exercise intensity, or insufficient quantities of IL-6 being secreted into systemic circulation to acutely raise its serum level. Although most human studies reported increase plasma IL-6 levels after high intensity exercise, some studies did not observe a similar increase in plasma IL-6 after a lower intensity exercise (37). It has been noted that circulating levels of cytokines can vary widely between individuals subjected to different types of exercise (28).
Intriguingly, most of the secreted cytokine receptors (10 out of 13) profiled are altered by exercise. These include sgp130, sRAGE, sIL-1RI, sIL-1RII, sIL-4R, sIL-6R, sTNF-RI, sTNF-RII, sVEGFR1, and sVEGFR2. The soluble form of cytokine receptors in plasma can be generated by multiple mechanisms that include ectodomain shedding by zinc metalloproteinases (e.g. TACE/ADAM17 and ADAM19), as well as by alternative mRNA splicing (42). Protease-mediated release of receptor ectodomain has been demonstrated for TNF-RI, TNF-RII, IL-1RII, IL-4R, IL-6R, whereas the soluble form of gp130, RAGE, VEGFR1, and VEGFR2 are generated by alternative mRNA splicing (42, 55). Although previous studies have looked at soluble IL-6R levels in response to exercise in humans (56, 57), our current study represents the first attempt to quantify changes in multiple secreted cytokine receptors in response to exercise. Our results suggest that soluble cytokine receptors could be generated by potentially novel exercise-regulated proteolytic and alternative mRNA splicing mechanisms. In principle, these soluble receptors could influence cytokine signaling by functioning as receptor agonists or antagonists.
Interestingly, there is a subset of 17 circulating cytokines whose changes in serum were not matched by their corresponding changes in muscle. Presumably, these cytokines (EPO, IL-20, IL-17A/F, sgp130, sIL-4R, CCL17, G-CSF, CX3CL1, CXCL1, IL-16, TIMP-1, sTNF-RII, sTNF-RI, IFN-γ, CXCL10, CCL20, and CCL12) are produced and secreted by non-muscle tissues. These changes could be attributed to several potential mechanisms that are dependent or independent of contracting skeletal muscle. Primary cytokines, and other potential myokines, that are secreted into circulation by contracting skeletal muscle could convey a signal to other non-muscle tissues to alter the expression and secretion of secondary cytokines. Liver and adipose tissues are also known to produce and secrete a variety of different cytokines. Given the energetics demands of contracting skeletal muscle, indirect metabolic changes in liver and adipose tissue induced by exercise could potentially also alter the expression and secretion of secondary cytokines. In support, we indeed observed parallel changes in cytokine expression in liver and/or adipose tissue in response to exercise that could, at least in part, account for their changes in circulation but not in skeletal muscle. Thus, our data highlighted the primary cytokine response of skeletal muscle and the secondary cytokine response in non-muscle tissues resulting from potential exercise-mediated tissue crosstalk.
When skeletal muscles isolated from the same mice were subjected to quantitative mRNA analysis, we found only minimal concordance between cytokine mRNA and protein levels, irrespective of exercise regimen. These observations suggest the importance of posttranscriptional regulation of cytokine expression and secretion in contracting skeletal muscle in vivo. Some of these posttranscriptional mechanisms could involve exercise-regulated stabilization of cytokine mRNA transcripts and/or microRNA (miRNA) mediated regulation of mRNA translation (28). Given that posttranscriptional control of cytokine/myokine expression in response to exercise is largely unexplored, our data provided a basis and impetus to further explore these underappreciated mechanisms in the context of physical activity.
Of the 66 cytokines profiled, a surprisingly large fraction is altered by acute and/or short-term exercise. Most of these altered cytokines are shown for the first time to be regulated by exercise in vivo. In recent studies, Scheler et al. profiled 23 different cytokines in cultured human myotubes using similar bead-based multiplex approach and showed that 11 cytokines are regulated by electrical pulse stimulation (27); these include IL-8, CXCL1, IL-6, LIF, IL-4, IL-13, IL17A, IL-1β, G-CSF, TNF, and CCL2. Raschke et al. used an antibody array to profile 179 peptides (covering different classes of secretory proteins in addition to cytokines), and identified 23 novel exercise regulated cytokines in electrical pulse stimulated human myotubes (26); these include IL-1α, IL-3, IL-10, IL-16, IL-22, IL-28A, IL-29, IL-31, IFN-γ, TPO, RAGE, CCL1, CCL4, CCL15, CCL17, CCL18, CCL21, CCL23, CCL24, CCL26, CXCL6, CXCL9, and CXCL13. Of the known exercise-regulated cytokines reported in cultured human myotubes (26, 27), we were able to confirm most them in vivo, in particular those cytokines that were included in our multiplex assay. This suggests that many of the cytokine responses we observed are most likely because of changes in the expression and secretion of cytokines from skeletal myotubes. Our results validate the use of rodent exercise models to study cytokine/myokine response in humans. Excluding these recently described exercise-regulated cytokines in cultured human myotubes, our in vivo mouse studies—involving three different exercise regimens and two different muscle fiber types—identified an additional 23 novel exercise-regulated cytokines/myokines not previously reported. These include IL-9, IL-12 (p40), IL-20, IL-33, M-CSF, CXCL10, CXCL2, CCL5, CX3CL1, CCL3, CCL12, CCL19, CCL20, EPO, TIMP-1, sgp130, sIL-1RI, sIL-1RII, sIL-6R, sTNF-RI, sTNF-RII, sVEGFR1, and sVEGFR2. Of these novel exercise-regulated myokines, a subset (IL-20, CXCL2, CX3CL1, CXCL10, CCL12, CCL20, sTNF-RI, sTNF-RII, TIMP) can be considered “exercise factors” based on the definition that they are produced by skeletal muscle in response to exercise and are secreted into the circulation (11).
Most of the exercise-regulated cytokines we uncovered play myriad roles in the immune and non-immune systems. Many cytokine functions are physiological context-dependent, and their effects are cell-type specific (38); their excessive production or suppression are often causally linked to disease. In the context of exercise, the levels of a surprisingly large number of cytokines are changed either locally within skeletal muscle or systemically. It appears that both the pro- and anti-inflammatory cytokines are altered by acute and chronic exercise in rodents (Table V) and in humans (58). It has been suggested that the beneficial local and systemic effects of chronic exercise are because of exercise-induced hormesis, whereby a low level of stress up-regulates existing cellular and molecular pathways that improve whole-body physiology (e.g. metabolism and immunity) (58, 59). Thus, it may be a specific combination of cytokines (with diverse and opposing functions) whose direction, magnitude, and duration of change underlie exercise-induced hormesis. In this context, it is worth noting that chronic exercise with running wheel induced more cytokine changes than either an acute low-intensity (endurance) or high-intensity (sprint) exercise. Although this is beyond the scope of the present study, future investigations using genetic gain- or loss-of-function mouse models of select cytokines are clearly needed to further pinpoint the biological effects of muscle-derived cytokines/myokines in muscle and non-muscle tissues.
Several limitations and caveats are noted in the present studies. First, we did not analyze all the known cytokines discovered to date. This is limited by cost and the availability of cytokine-specific multiplex reagents. Second, we did not use an in vitro exercise model (e.g. EPS-stimulated myotubes) to directly show that the cytokine changes we see in soleus and plantaris muscle fibers are indeed derived from skeletal myotubes and not from other potential cell types such as satellite cells, endothelial cells, fibroblastic cells, and resident immune cells. It is known that eccentric or resistance exercise, or prolonged running (e.g. marathon), in humans result in muscle damage, leading to the influx of inflammatory leukocytes that can be the source of cytokines up-regulated in muscle [extensively reviewed in (60)]. Although we cannot rule out this possibility, the type and duration of exercise the mice were subjected to in our study generally do not cause significant muscle damage. Indeed, when obese mice were subjected to endurance interval training, significantly less inflammation and macrophage infiltration were observed in skeletal muscle (61). Because our in vivo study confirmed most of the exercise-regulated cytokines in cultured human myotubes (26, 27), we presume the novel exercise-regulated cytokines found in the present study are likely to be derived from myotubes. Third, we only measured transcript, and not protein, levels of a select set of cytokines in liver and adipose tissues. Thus, whether changes in mRNA translate into changes in protein levels remain to be determined. Fourth, we did not directly demonstrate the release of cytokines from exercised muscle into circulation. Although this may be technically challenging to perform in mice, in situ cytokine flux analysis will provide further insights into how different muscle fiber types modulate the production and secretion of cytokines in response to different exercise. Fifth, although mice run only during the dark cycle (62), one potential caveat of the voluntary exercise group was that the mice had access to the running wheel until the morning before they were sacrificed. However, when we examined the cytokine profiles, the number and type of cytokine changes were significantly different between acute (sprint and endurance run) and chronic (wheel running) exercise groups despite some overlaps (Fig. 1 and 2), suggesting that we could discriminate between the two exercise effects. Sixth, the pre-exercise values of some cytokines in the voluntary wheel running group were significantly higher than the pre-exercise values for the sprint and endurance groups. The reason for this is unknown. Although all mice were handled identically, the serum samples from the wheel running group were not analyzed at the same time as the sprint and endurance groups. However, samples that were directly compared with one another or used for normalization were always analyzed on the same plate; specifically, serum samples from the pre- and post-sprint and endurance groups were run together while the samples from the pre- and postwheel running were run together. Our analyses focused on the changes in cytokine levels in each pre- and post-exercise condition. We do not directly compare serum data between exercise regimens. Thus, the differences in absolute values between exercise conditions should not affect the interpretation of our data. Despite these limitations, our current studies reveal important insights concerning exercise regulation of local and systemic cytokine levels.
In summary, our current cytokine profiling studies in mice, along with other published studies on exercise-regulated myokines in humans and animal models, indicate that physical activity can significantly alter the skeletal muscle secretome. Many myokines/cytokines have pleiotropic functions, and some may have opposite effects depending on biological and physiological contexts. Given this complexity, we speculate that a right combination, magnitude, and direction of myokine changes induced by regular exercise, rather than one or two dominant secretory proteins, are likely responsible for the multi-organ effects and health benefits of exercise. The inherent systems-level response to physical activity may pose a major challenge to produce an “exercise pill” that can mimic and recapitulate all the local and systemic physiological and adaptive processes induced and suppressed by regular exercise.
Supplementary Material
Footnotes
* This work was supported, in part, by NIH grant DK084171 (to G.W.W.), DP2OD008618 (to C.H.), F31DK116537 (to H.C.L). SYT was supported by an NIH pre-doctoral training grant (T32GM007445). The serum cytokine profiling was performed at the Integrated Physiology Core of the Diabetes Research Center (DRC) at The Johns Hopkins University School of Medicine, funded by NIDDK grant P60DK079637.
 This article contains supplemental material.
1 The abbreviations used are:
- IL
- Interleukin
- CCL
- Chemokine (C-C motif) ligand
- CXCL
- Chemokine (C-X-C motif) ligand
- CX3CL
- Chemokine (C-X3-C motif) ligand
- EPO
- Erythropoietin
- G-CSF
- Granulocyte colony-stimulating factor
- GM-CSF
- Granulocyte macrophage colony-stimulating factor
- IFN-γ
- Interferon-γ
- LIF
- Leukemia inhibitory factor
- M-CSF
- Macrophage colony-stimulating factor
- MCP
- Monocyte chemoattractant protein
- MIP
- Macrophage inflammatory protein
- TIMP
- Tissue inhibitor of metalloproteinase
- TNF-α
- Tumor necrosis factor alpha
- TNF-R
- Tumor necrosis factor receptor
- sRAGE
- Soluble receptor for advanced glycation end products
- VEGF
- Vascular endothelial growth factor.
REFERENCES
- 1. Lee I. M., Shiroma E. J., Lobelo F., Puska P., Blair S. N., Katzmarzyk P. T., and Lancet Physical Activity Series Working G. (2012) Effect of physical inactivity on major non-communicable diseases worldwide: an analysis of burden of disease and life expectancy. Lancet 380, 219–229 [DOI] [PMC free article] [PubMed] [Google Scholar]
- 2. Booth F. W., Roberts C. K., Thyfault J. P., Ruegsegger G. N., and Toedebusch R. G. (2017) Role of Inactivity in Chronic Diseases: Evolutionary Insight and Pathophysiological Mechanisms. Physiol. Rev. 97, 1351–1402 [DOI] [PMC free article] [PubMed] [Google Scholar]
- 3. Li S., Zhao J. H., Luan J., Ekelund U., Luben R. N., Khaw K. T., Wareham N. J., and Loos R. J. (2010) Physical activity attenuates the genetic predisposition to obesity in 20,000 men and women from EPIC-Norfolk prospective population study. PLoS Med. 7, e1000332. [DOI] [PMC free article] [PubMed] [Google Scholar]
- 4. Goodyear L. J., and Kahn B. B. (1998) Exercise, glucose transport, and insulin sensitivity. Annu. Rev. Med. 49, 235–261 [DOI] [PubMed] [Google Scholar]
- 5. Zierath J. R., and Wallberg-Henriksson H. (2015) Looking ahead perspective: Where will the future of exercise biology take us? Cell Metab. 22, 25–30 [DOI] [PubMed] [Google Scholar]
- 6. Pedersen B. K. (2017) Anti-inflammatory effects of exercise: role in diabetes and cardiovascular disease. Eur. J. Clin. Invest. 47, 600–611 [DOI] [PubMed] [Google Scholar]
- 7. Hawley J. A., Hargreaves M., Joyner M. J., and Zierath J. R. (2014) Integrative biology of exercise. Cell 159, 738–749 [DOI] [PubMed] [Google Scholar]
- 8. Neufer P. D., Bamman M. M., Muoio D. M., Bouchard C., Cooper D. M., Goodpaster B. H., Booth F. W., Kohrt W. M., Gerszten R. E., Mattson M. P., Hepple R. T., Kraus W. E., Reid M. B., Bodine S. C., Jakicic J. M., Fleg J. L., Williams J. P., Joseph L., Evans M., Maruvada P., Rodgers M., Roary M., Boyce A. T., Drugan J. K., Koenig J. I., Ingraham R. H., Krotoski D., Garcia-Cazarin M., McGowan J. A., and Laughlin M. R. (2015) Understanding the Cellular and Molecular Mechanisms of Physical Activity-Induced Health Benefits. Cell Metab. 22, 4–11 [DOI] [PubMed] [Google Scholar]
- 9. Pedersen B. K. (2009) Edward F. Adolph distinguished lecture: muscle as an endocrine organ: IL-6 and other myokines. J. Appl. Physiol. 107, 1006–1014 [DOI] [PubMed] [Google Scholar]
- 10. Pedersen B. K., and Febbraio M. A. (2012) Muscles, exercise and obesity: skeletal muscle as a secretory organ. Nat. Rev. Endocrinol. 8, 457–465 [DOI] [PubMed] [Google Scholar]
- 11. Catoire M., and Kersten S. (2015) The search for exercise factors in humans. FASEB J. 29, 1615–1628 [DOI] [PubMed] [Google Scholar]
- 12. Hartwig S., Raschke S., Knebel B., Scheler M., Irmler M., Passlack W., Muller S., Hanisch F. G., Franz T., Li X., Dicken H. D., Eckardt K., Beckers J., de Angelis M. H., Weigert C., Haring H. U., Al-Hasani H., Ouwens D. M., Eckel J., Kotzka J., and Lehr S. (2014) Secretome profiling of primary human skeletal muscle cells. Biochim. Biophys. Acta 1844, 1011–1017 [DOI] [PubMed] [Google Scholar]
- 13. Deshmukh A. S., Cox J., Jensen L. J., Meissner F., and Mann M. (2015) Secretome analysis of lipid-induced insulin resistance in skeletal muscle cells by a combined experimental and bioinformatics workflow. J. Proteome Res. 14, 4885–4895 [DOI] [PubMed] [Google Scholar]
- 14. Chan C. Y., Masui O., Krakovska O., Belozerov V. E., Voisin S., Ghanny S., Chen J., Moyez D., Zhu P., Evans K. R., McDermott J. C., and Siu K. W. (2011) Identification of differentially regulated secretome components during skeletal myogenesis. Mol. Cell. Proteomics 10, M110 004804 [DOI] [PMC free article] [PubMed] [Google Scholar]
- 15. Henningsen J., Rigbolt K. T., Blagoev B., Pedersen B. K., and Kratchmarova I. (2010) Dynamics of the skeletal muscle secretome during myoblast differentiation. Mol. Cell. Proteomics 9, 2482–2496 [DOI] [PMC free article] [PubMed] [Google Scholar]
- 16. Yoon J. H., Kim D., Jang J. H., Ghim J., Park S., Song P., Kwon Y., Kim J., Hwang D., Bae Y. S., Suh P. G., Berggren P. O., and Ryu S. H. (2015) Proteomic analysis of the palmitate-induced myotube secretome reveals involvement of the annexin A1-formyl peptide receptor 2 (FPR2) pathway in insulin resistance. Mol. Cell. Proteomics 14, 882–892 [DOI] [PMC free article] [PubMed] [Google Scholar]
- 17. Yoon J. H., Song P., Jang J. H., Kim D. K., Choi S., Kim J., Ghim J., Kim D., Park S., Lee H., Kwak D., Yea K., Hwang D., Suh P. G., and Ryu S. H. (2011) Proteomic analysis of tumor necrosis factor-alpha (TNF-alpha)-induced L6 myotube secretome reveals novel TNF-alpha-dependent myokines in diabetic skeletal muscle. J. Proteome Res. 10, 5315–5325 [DOI] [PubMed] [Google Scholar]
- 18. Yoon J. H., Yea K., Kim J., Choi Y. S., Park S., Lee H., Lee C. S., Suh P. G., and Ryu S. H. (2009) Comparative proteomic analysis of the insulin-induced L6 myotube secretome. Proteomics 9, 51–60 [DOI] [PubMed] [Google Scholar]
- 19. Norheim F., Raastad T., Thiede B., Rustan A. C., Drevon C. A., and Haugen F. (2011) Proteomic identification of secreted proteins from human skeletal muscle cells and expression in response to strength training. Am. J. Physiol. Endocrinol Metab 301, E1013–E1021 [DOI] [PubMed] [Google Scholar]
- 20. Ostrowski K., Rohde T., Zacho M., Asp S., and Pedersen B. K. (1998) Evidence that interleukin-6 is produced in human skeletal muscle during prolonged running. J. Physiol. 508, 949–953 [DOI] [PMC free article] [PubMed] [Google Scholar]
- 21. Steensberg A., van Hall G., Osada T., Sacchetti M., Saltin B., and Klarlund Pedersen B. (2000) Production of interleukin-6 in contracting human skeletal muscles can account for the exercise-induced increase in plasma interleukin-6. J. Physiol. 529, 237–242 [DOI] [PMC free article] [PubMed] [Google Scholar]
- 22. Haugen F., Norheim F., Lian H., Wensaas A. J., Dueland S., Berg O., Funderud A., Skalhegg B. S., Raastad T., and Drevon C. A. (2010) IL-7 is expressed and secreted by human skeletal muscle cells. Am. J. Physiol. Cell Physiol 298, C807–C816 [DOI] [PubMed] [Google Scholar]
- 23. Quinn L. S., Anderson B. G., Strait-Bodey L., Stroud A. M., and Argiles J. M. (2009) Oversecretion of interleukin-15 from skeletal muscle reduces adiposity. Am. J. Physiol. Endocrinol. Metab. 296, E191–E202 [DOI] [PMC free article] [PubMed] [Google Scholar]
- 24. Broholm C., Laye M. J., Brandt C., Vadalasetty R., Pilegaard H., Pedersen B. K., and Scheele C. (2011) LIF is a contraction-induced myokine stimulating human myocyte proliferation. J. Appl. Physiol. 111, 251–259 [DOI] [PubMed] [Google Scholar]
- 25. Hoier B., Olsen K., Nyberg M., Bangsbo J., and Hellsten Y. (2010) Contraction-induced secretion of VEGF from skeletal muscle cells is mediated by adenosine. Am. J. Physiol. 299, H857–H862 [DOI] [PubMed] [Google Scholar]
- 26. Raschke S., Eckardt K., Bjorklund Holven K., Jensen J., and Eckel J. (2013) Identification and validation of novel contraction-regulated myokines released from primary human skeletal muscle cells. PLoS ONE 8, e62008. [DOI] [PMC free article] [PubMed] [Google Scholar]
- 27. Scheler M., Irmler M., Lehr S., Hartwig S., Staiger H., Al-Hasani H., Beckers J., de Angelis M. H., Haring H. U., and Weigert C. (2013) Cytokine response of primary human myotubes in an in vitro exercise model. Am. J. Physiol. Cell Physiol. 305, C877–C886 [DOI] [PubMed] [Google Scholar]
- 28. Peake J. M., Della Gatta P., Suzuki K., and Nieman D. C. (2015) Cytokine expression and secretion by skeletal muscle cells: regulatory mechanisms and exercise effects. Exerc. Immunol. Rev. 21, 8–25 [PubMed] [Google Scholar]
- 29. Akira S., Hirano T., Taga T., and Kishimoto T. (1990) Biology of multifunctional cytokines: IL 6 and related molecules (IL 1 and TNF). FASEB J. 4, 2860–2867 [PubMed] [Google Scholar]
- 30. Dinarello C. A. (2007) Historical insights into cytokines. Eur. J. Immunol. 37, S34–S45, [DOI] [PMC free article] [PubMed] [Google Scholar]
- 31. Buchanan J. B., and Johnson R. W. (2007) Regulation of food intake by inflammatory cytokines in the brain. Neuroendocrinology 86, 183–190 [DOI] [PubMed] [Google Scholar]
- 32. Zorrilla E. P., Sanchez-Alavez M., Sugama S., Brennan M., Fernandez R., Bartfai T., and Conti B. (2007) Interleukin-18 controls energy homeostasis by suppressing appetite and feed efficiency. Proc. Natl. Acad. Sci. U.S.A. 104, 11097–11102 [DOI] [PMC free article] [PubMed] [Google Scholar]
- 33. Luheshi G. N., Gardner J. D., Rushforth D. A., Loudon A. S., and Rothwell N. J. (1999) Leptin actions on food intake and body temperature are mediated by IL-1. Proc. Natl. Acad. Sci. U.S.A. 96, 7047–7052 [DOI] [PMC free article] [PubMed] [Google Scholar]
- 34. Pourteymour S., Eckardt K., Holen T., Langleite T., Lee S., Jensen J., Birkeland K. I., Drevon C. A., and Hjorth M. (2017) Global mRNA sequencing of human skeletal muscle: Search for novel exercise-regulated myokines. Mol. Metab. 6, 352–365 [DOI] [PMC free article] [PubMed] [Google Scholar]
- 35. Lundberg T. R., Fernandez-Gonzalo R., Tesch P. A., Rullman E., and Gustafsson T. (2016) Aerobic exercise augments muscle transcriptome profile of resistance exercise. Am. J. Physiol. 310, R1279–R1287 [DOI] [PMC free article] [PubMed] [Google Scholar]
- 36. Catoire M., Mensink M., Boekschoten M. V., Hangelbroek R., Muller M., Schrauwen P., and Kersten S. (2012) Pronounced effects of acute endurance exercise on gene expression in resting and exercising human skeletal muscle. PLoS ONE 7, e51066. [DOI] [PMC free article] [PubMed] [Google Scholar]
- 37. Catoire M., Mensink M., Kalkhoven E., Schrauwen P., and Kersten S. (2014) Identification of human exercise-induced myokines using secretome analysis. Physiol. Genomics 46, 256–267 [DOI] [PubMed] [Google Scholar]
- 38. Borish L. C., and Steinke J. W. (2003) 2. Cytokines and chemokines. J. Allergy Clin. Immunol. 111, S460–S475 [DOI] [PubMed] [Google Scholar]
- 39. Dupont N. C., Wang K., Wadhwa P. D., Culhane J. F., and Nelson E. L. (2005) Validation and comparison of luminex multiplex cytokine analysis kits with ELISA: determinations of a panel of nine cytokines in clinical sample culture supernatants. J. Reproductive Immunol. 66, 175–191 [DOI] [PMC free article] [PubMed] [Google Scholar]
- 40. Tighe P., Negm O., Todd I., and Fairclough L. (2013) Utility, reliability and reproducibility of immunoassay multiplex kits. Methods 61, 23–29 [DOI] [PubMed] [Google Scholar]
- 41. Moncunill G., Aponte J. J., Nhabomba A. J., and Dobano C. (2013) Performance of multiplex commercial kits to quantify cytokine and chemokine responses in culture supernatants from Plasmodium falciparum stimulations. PLoS ONE 8, e52587. [DOI] [PMC free article] [PubMed] [Google Scholar]
- 42. Levine S. J. (2008) Molecular mechanisms of soluble cytokine receptor generation. J. Biol. Chem. 283, 14177–14181 [DOI] [PMC free article] [PubMed] [Google Scholar]
- 43. Petersen P. S., Lei X., Seldin M. M., Rodriguez S., Byerly M. S., Wolfe A., Whitlock S., and Wong G. W. (2014) Dynamic and extensive metabolic state-dependent regulation of cytokine expression and circulating levels. Am. J. Physiol. 307, R1458–1470 [DOI] [PMC free article] [PubMed] [Google Scholar]
- 44. Collins M. L., Irvine B., Tyner D., Fine E., Zayati C., Chang C., Horn T., Ahle D., Detmer J., Shen L. P., Kolberg J., Bushnell S., Urdea M. S., and Ho D. D. (1997) A branched DNA signal amplification assay for quantification of nucleic acid targets below 100 molecules/ml. Nucleic Acids Res. 25, 2979–2984 [DOI] [PMC free article] [PubMed] [Google Scholar]
- 45. Flagella M., Bui S., Zheng Z., Nguyen C. T., Zhang A., Pastor L., Ma Y., Yang W., Crawford K. L., McMaster G. K., Witney F., and Luo Y. (2006) A multiplex branched DNA assay for parallel quantitative gene expression profiling. Anal. Biochem. 352, 50–60 [DOI] [PubMed] [Google Scholar]
- 46. Canales R. D., Luo Y., Willey J. C., Austermiller B., Barbacioru C. C., Boysen C., Hunkapiller K., Jensen R. V., Knight C. R., Lee K. Y., Ma Y., Maqsodi B., Papallo A., Peters E. H., Poulter K., Ruppel P. L., Samaha R. R., Shi L., Yang W., Zhang L., and Goodsaid F. M. (2006) Evaluation of DNA microarray results with quantitative gene expression platforms. Nat. Biotechnol. 24, 1115–1122 [DOI] [PubMed] [Google Scholar]
- 47. Schmittgen T. D., and Livak K. J. (2008) Analyzing real-time PCR data by the comparative C(T) method. Nat. Protoc. 3, 1101–1108 [DOI] [PubMed] [Google Scholar]
- 48. Lin Y. S., Jan M. S., and Chen H. I. (1993) The effect of chronic and acute exercise on immunity in rats. Int. J. Sports Med. 14, 86–92 [DOI] [PubMed] [Google Scholar]
- 49. Reed J. A., Clegg D. J., Smith K. B., Tolod-Richer E. G., Matter E. K., Picard L. S., and Seeley R. J. (2005) GM-CSF action in the CNS decreases food intake and body weight. J. Clin. Invest. 115, 3035–3044 [DOI] [PMC free article] [PubMed] [Google Scholar]
- 50. He C., Bassik M. C., Moresi V., Sun K., Wei Y., Zou Z., An Z., Loh J., Fisher J., Sun Q., Korsmeyer S., Packer M., May H. I., Hill J. A., Virgin H. W., Gilpin C., Xiao G., Bassel-Duby R., Scherer P. E., and Levine B. (2012) Exercise-induced BCL2-regulated autophagy is required for muscle glucose homeostasis. Nature 481, 511–515 [DOI] [PMC free article] [PubMed] [Google Scholar]
- 51. Egan B., and Zierath J. R. (2013) Exercise metabolism and the molecular regulation of skeletal muscle adaptation. Cell Metab. 17, 162–184 [DOI] [PubMed] [Google Scholar]
- 52. Hiscock N., Chan M. H., Bisucci T., Darby I. A., and Febbraio M. A. (2004) Skeletal myocytes are a source of interleukin-6 mRNA expression and protein release during contraction: evidence of fiber type specificity. FASEB J. 18, 992–994 [DOI] [PubMed] [Google Scholar]
- 53. Pedersen B. K., and Febbraio M. A. (2008) Muscle as an endocrine organ: focus on muscle-derived interleukin-6. Physiol. Rev. 88, 1379–1406 [DOI] [PubMed] [Google Scholar]
- 54. Fischer C. P., Plomgaard P., Hansen A. K., Pilegaard H., Saltin B., and Pedersen B. K. (2004) Endurance training reduces the contraction-induced interleukin-6 mRNA expression in human skeletal muscle. Am. J. Physiol. 287, E1189–E1194 [DOI] [PubMed] [Google Scholar]
- 55. Malherbe P., Richards J. G., Gaillard H., Thompson A., Diener C., Schuler A., and Huber G. (1999) cDNA cloning of a novel secreted isoform of the human receptor for advanced glycation end products and characterization of cells co-expressing cell-surface scavenger receptors and Swedish mutant amyloid precursor protein. Brain Res. Mol. Brain Res. 71, 159–170 [DOI] [PubMed] [Google Scholar]
- 56. Gray S. R., Clifford M., Lancaster R., Leggate M., Davies M., and Nimmo M. A. (2009) The response of circulating levels of the interleukin-6/interleukin-6 receptor complex to exercise in young men. Cytokine 47, 98–102 [DOI] [PubMed] [Google Scholar]
- 57. Leggate M., Nowell M. A., Jones S. A., and Nimmo M. A. (2010) The response of interleukin-6 and soluble interleukin-6 receptor isoforms following intermittent high intensity and continuous moderate intensity cycling. Cell Stress Chaperones 15, 827–833 [DOI] [PMC free article] [PubMed] [Google Scholar]
- 58. Pedersen B. K., and Hoffman-Goetz L. (2000) Exercise and the immune system: regulation, integration, and adaptation. Physiol. Rev. 80, 1055–1081 [DOI] [PubMed] [Google Scholar]
- 59. Peake J. M., Markworth J. F., Nosaka K., Raastad T., Wadley G. D., and Coffey V. G. (2015) Modulating exercise-induced hormesis: Does less equal more? J. Appl. Physiol. (1985) 119, 172–189 [DOI] [PubMed] [Google Scholar]
- 60. Paulsen G., Mikkelsen U. R., Raastad T., and Peake J. M. (2012) Leucocytes, cytokines and satellite cells: what role do they play in muscle damage and regeneration following eccentric exercise? Exerc. Immunol. Rev. 18, 42–97 [PubMed] [Google Scholar]
- 61. Samaan M. C., Marcinko K., Sikkema S., Fullerton M. D., Ziafazeli T., Khan M. I., and Steinberg G. R. (2014) Endurance interval training in obese mice reduces muscle inflammation and macrophage content independently of weight loss. Physiol. Rep. 2 [DOI] [PMC free article] [PubMed] [Google Scholar]
- 62. Bains R. S., Wells S., Sillito R. R., Armstrong J. D., Cater H. L., Banks G., and Nolan P. M. (2018) Assessing mouse behaviour throughout the light/dark cycle using automated in-cage analysis tools. J. Neurosci. Methods 300, 37–47 [DOI] [PMC free article] [PubMed] [Google Scholar]
Associated Data
This section collects any data citations, data availability statements, or supplementary materials included in this article.