

Abstract
Ovarian cancer (OC) cells frequently metastasize to the omentum and adipocytes play a significant role in ovarian tumor progression. Therapeutic interventions targeting aberrant DNA methylation in ovarian tumors have shown promise in the clinic but the effects of epigenetic therapy on the tumor microenvironment are understudied. Here, we examined the effect of adipocytes on OC cell behavior in culture and impact of targeting DNA methylation in adipocytes on OC metastasis. The presence of adipocytes increased OC cell migration and invasion and proximal and direct co-culture of adipocytes increased OC proliferation alone or after treatment with carboplatin. Treatment of adipocytes with hypomethylating agent guadecitabine decreased migration and invasion of OC cells towards adipocytes. Subcellular protein fractionation of adipocytes treated with guadecitabine revealed decreased DNA methyltransferase 1 (DNMT1) levels even in the presence of DNA synthesis inhibitor, aphidicolin. Methyl-Capture- and RNA-sequencing analysis of guadecitabine-treated adipocytes revealed derepression of tumor suppressor genes and EMT inhibitors. SUSD2, a secreted tumor suppressor downregulated by promoter CpG island methylation in adipocytes, was upregulated after guadecitabine treatment, and recombinant SUSD2 decreased OC cells migration and invasion. Integrated analysis of the methylomic and transcriptomic data identified pathways associated with inhibition of matrix metalloproteases and fatty acid α-oxidation suggesting a possible mechanism of how epigenetic therapy of adipocytes decreases metastasis. In conclusion, the effect of DNMT inhibitor on fully differentiated adipocytes suggests that hypomethylating agents may impact the tumor microenvironment to decrease cancer cell metastasis.
Keywords: Ovarian Cancer, Epigenetics, Adipocytes, DNA methylation
Introduction
Increased adiposity is associated with increased cancer incidence, morbidity, and mortality (1). Cancer-associated adipocytes support the growth and metastasis of cancer cells, contributing to an invasive and aggressive phenotype (1). Approximately 22,440 women were diagnosed with epithelial ovarian cancer (EOC) in 2016 and the five-year survival rate was only 28.3%, making EOC the deadliest gynecologic disease (2). EOC patients are often diagnosed at late stage with 80% of metastasis commonly found on the omentum (3), a membranous fatty tissue layer in the lower abdominal area, and a recent meta-analysis that included 25,157 women with EOC from 47 epidemiological studies demonstrated that EOC risk is associated with higher Body Mass Index (BMI) and weight, suggesting that increased adiposity is correlated with EOC risk (4).
The degree of adipose tissue invasion is indicative of the aggressiveness of the tumor (3), and obesity contributes to OC metastatic success through increased lipogenesis and lipid transport, demonstrating the importance of the role adipocytes play in tumor progression as a rich energy source of free fatty acids (5). EOC-associated adipocytes have been shown to transfer lipids to OC cells through upregulation of FABP4 (3), and overexpression of SIK2 in metastatic ovarian tumor samples from adipocyte-rich areas promotes OC cell fatty acid oxidation and activates the PI3K/AKT pathway leading to cancer cell growth (6). Due to the supportive role adipocytes play in OC tumor growth, adipocytes might serve as an additional therapeutic target for OC metastasis.
Obesity-induced, pro-inflammatory cytokines promote DNMT1 expression and its enzymatic activity, leading to greater global DNA methylation and epigenetic silencing of genes in adipocytes (7,8). The presence of cancer cells may epigenetically modify adipocytes, lead to disruption of cell signaling between adipocytes and OC cells, and promote OC metastasis. Inhibiting DNMT1 in adipocytes was previously shown to demethylate and reexpress adiponectin, an important regulator of glucose and lipid metabolism (7), providing proof of concept that epigenetic inhibition in adipocytes can result in reexpression of hypermethylated genes. Adipocytes secrete cytokines that increase OC cell homing and once adjacent to the adipocyte, OC cells alter metabolic processes of adipocytes to undergo lipolysis and transfer of lipids (3). The epigenetic alterations that occur in adipocytes after OC cell interaction remain unexplored.
Adipose tissue responds to changing metabolic settings such as obesity by epigenetic regulation of metabolic genes (8) like adiponectin DNA methylation, which can be reversed by hypomethylating therapy (7). However, epigenetic targeting of adipocytes has not been studied in the context of cancer progression where DNA methylation alterations may have occurred due to OC cell interaction. We have demonstrated that the next generation DNMT inhibitor guadecitabine (SGI-110) has significant activity against OC (9,10), but effects of the hypomethylating agent on the microenvironment in general and on adipocytes in particular are not well understood. Here we show that guadecitabine has direct effects on adipocytes. Guadecitabine treatment decreased DNMT1 levels and global demethylation, corresponding to gene expression changes in adipocytes. Furthermore, epigenetic reexpression of tumor suppressor genes, including SUSD2 suppressed OC migration and invasion. We demonstrate that guadecitabine-treated adipocytes inhibited OC cell migration and invasion, suggesting that in addition to direct effects of DNMT inhibitors on tumor cells, epigenetic-induced alterations in the tumor microenvironment may contribute to decreased OC cell metastasis and has implications that adipocytes may be a therapeutic target for inhibiting OC cell metastasis.
Materials and Methods
Cell culture
High-grade serous (HGS) EOC cell lines OVCAR4, OVCAR5, OVCAR8, and OVCAR8-RFP were grown in DMEM media. OVCAR8 cells were transduced to express red fluorescent protein (RFP) using commercially procured lentiviral particles expressing RFP and blasticidin gene selection marker (11). Kuramochi (HGSOC) and SKOV3 (endometrioid OC) cells were grown in RPMI 1640 media and McCoy’s 5A media, respectively. Normal, human primary subcutaneous pre-adipocytes (ATCC PCS-210-010) were grown in fibroblast basal medium (ATCC PCS-201-030) supplemented with phenol red. Simpson-Golabi-Behman syndrome (SGBS) human adipocyte cells were (provided by Dr. Martin Wabitsch) differentiated as described (12). All media was supplemented with 10% fetal bovine serum (FBS), antibiotic-antimycotic, 25mM HEPES, MEM vitamins, and MEM nonessential amino acids. Cells were treated with guadecitabine (Astex Pharmaceuticals, Inc) dissolved in DMSO or carboplatin (Sigma) dissolved in PBS. Cells were treated with 100nM guadecitabine and refreshed every day for 3 days.
Adipogenic induction of pre-adipocytes
Preadipocytes were differentiated following an adipogenic differentiation protocol (13). Briefly, preadipocytes were seeded at 18,000 cells/cm2. Initiation of adipogenesis was induced by replacing the fibroblast basal medium with adipogenic induction medium (AIM) for 15 days. Oil Red O staining was performed to confirm adipocyte differentiation.
Western blot
Adipocyte conditioned media was collected and concentrated (Amicon Ultra-0.5 Centrifugal Filter Units 10 kDa or 30 kDa; Millipore) and proteins were extracted with RIPA, as described previously (9). Primary antibodies were DNMT1 (Cell Signaling #5032S, histone H3 (Cell Signaling #4499S), GAPDH (Santa Cruz #sc-25778), PPARγ (Cell Signaling #2435P) and SUSD2 (Prestige Antibodies #HPA004117). After incubation with peroxidase labeled secondary anti-rabbit (KPL #374-1506) or anti-mouse antibodies (KPL #474-1806), protein bands were visualized using ECL reagents.
Propidium iodide cell cycle and cell proliferation analysis using flow cytometry
Cell cycle analysis of preadipocyte and adipocytes was performed according to Kim et al. (14). Cells were treated with aphidicolin, ethanol fixed, stained with propidium iodide, and analyzed on BD LSR II flow cytometer. For cell proliferation analysis, OVCAR8-RFP cells were seeded directly onto adipocytes (1:3) treated with guadecitabine. Then, OVCAR8-RFP and adipocytes were treated with carboplatin for 1 week, imaged using EVOS FL Auto Cell Imaging System and analyzed on BD LSR II flow cytometer.
Caspase-Glo 3/7 apoptosis assay and trypan blue assay
Caspase-Glo 3/7 assay (Promega) was performed according to manufacturer’s protocol on preadipocytes or adipocytes seeded in a 96-well plate, treated with aphidicolin (1-4μg/mL, 4×) or guadecitabine, respectively. Trypan Blue assay was performed at 0.4% trypan blue.
Subcellular fractionation
Cytoplasm and nuclear extraction protocol was adapted from O’Hagan et al. (15). Cell pellets were sequentially washed in CEBN buffer to obtain the cytoplasm, CEB buffer (CEBN without IGEPAL CA-630) to obtain the total nuclear fraction, and soluble nuclear buffer to obtain the chromatin and soluble nuclear fraction.
qRT-PCR
RNA was extracted with RNeasy kit (Qiagen #74104), cDNA was prepared using M-MLV RT system (Promega), and qPCR was performed with cDNA and primers. Data normalized to EEF control gene. Fold change calculated using 2−Δ (ΔCT); where ΔCT = CT, target – CT, GAPDH and Δ(ΔCT) = ΔCT, stimulated – ΔCT, control. Primer sequences listed in Supplemental Table S1. TSH2B and GAPDH primers were control primers provided in Diagenode MethylCap kit.
MTT cell proliferation assay
MTT assay was performed as described (9). OC cells in 96-well plates were treated with centrifuged and clarified adipocyte conditioned media or recombinant SUSD2 (100, 500ng/mL) with carboplatin (7 days). OC cells were seeded in the top compartment of 0.45 micron Boyden chamber assay (Corning #353095) with proximally cocultured adipocytes in the bottom of the 24-well plate in serum-free media.
Migration and invasion assay
Adipocytes seeded in 24-well plates were treated with guadecitabine (100nM, 3× daily). After drug treatment, to remove any direct effects of guadecitabine on tumor cells, old media was diluted (75% with serum-free media) and this dilution approach was performed 4× before replacing the media with 500μl of fresh serum-free media prior to the addition of cancer cells 24h later. Adipocytes cannot be washed due to sensitivity to air and agitation; therefore, dilution was utilized to remove guadecitabine from the media. To test whether residual guadecitabine has any effect on cell migration and invasion, we repeated this experiment as stated above with guadecitabine in 10% FBS serum media without adipocytes. Clarified adipocyte conditioned media (serum-free) was collected after guadecitabine treatment was removed, diluted 4×, and replaced with fresh media (24h) to be used as chemoattractant. Recombinant, human SUSD2 (Abnova #H00056241-P01) (100, 500ng/mL) in 10% FBS DMEM was also used as a chemoattractant in the bottom of the well to test the effect of SUSD2 on migration and invasion. Cells (200,000) were seeded in migration (8μm pore; Corning #354578) and matrigel invasion Boyden chamber inserts (8μm pore; Corning #354480) with serum-free media and allowed to migrate or invade for 8h and 16h, respectively. The HEMA3 stain set (Protocol) was used to stain inserts. Cells were imaged using the 5× objective (5 fields per insert) and counted using ImageJ.
BrdU cell proliferation assay through ELISA and fluorescence microscopy
BrdU cell proliferation assay was performed (Cell Signaling Technologies) according to manufacturer’s protocol on preadipocytes treated with aphidicolin daily (1-4μg/ml, 4×). Also, adipocytes were differentiated on glass coverslips in 6-well plates and treated with aphidicolin. Cells were stained with 10μM BrdU (2h), fixed in 10% formalin, permeabilized (0.1% Triton X-100 buffer), acid-treated (HCl and phosphate/citric acid buffer), and stained (BrdU primary antibody 1:10,000, Cell Signaling #5292S; Alexa Fluor 568 secondary antibody 1:10,000, Invitrogen #A10042). Slides were mounted using Fluoroshield (Sigma) and viewed on Nikon NiE microscope.
SUSD2 ELISA
Adipocytes were seeded in 6-well plate in serum-free DMEM:F12 and treated with guadecitabine (100nM, 3× daily); on day 4, adipocyte-conditioned media was collected, centrifuged to clarify, and used in SUSD2 ELISA assay (LifeSpan BioSciences, Inc.) according to manufacturer’s protocol.
Indirect Flow Cytometry of SUSD2
Adipocytes (~1×10⁶ cells) were harvested, not permeabilized, incubated with primary SUSD2 antibody (1:1000; Prestige Antibodies #HPA004117), 10% FBS overnight at 4°C. Cells were washed with PBS (3X), incubated with secondary Alexa Fluor 488 antibody (1:5000; Invitrogen #A11034) for 1h at RT in the dark, washed with PBS (3X), suspended in 0.5mL PBS, 3% BSA, filtered, and analyzed on BD LSR II flow cytometer.
Next Generation Sequencing Analyses
For Methyl-Capture-sequencing (MC-seq) library preparation, DNA was extracted with AllPrep kit (Qiagen #80204) from adipocytes, sonicated (180-200bp), and used as input for methylated DNA capture kit (Diagenode) according to manufacturer’s protocol. MC- and RNA-seq libraries were prepared with NEXTflex Methyl-Seq1 kit (Bioo Scientific) or TruSeq Stranded mRNA Library Prep Kit (Illumina #RS-122-2101) respectively, according to manufacturer’s protocol. Libraries were verified using Qubit and Bioanalyzer, prior to sequencing on Illumina NextSeq. NextSeq read sequences were cleaned using Trimmomatic version 0.32 with the parameters “2:20:5 LEADING:3 TRAILING:3 SLIDINGWINDOW:4:15 MINLEN:17” to remove adapter sequences and perform quality trimming. Custom perl scripts and FASTX-Toolkit version 0.0.13.2 (-l 17 -v -M 1 –i) were used to identify partial adapters.
For MC-seq data, reads were mapped against GRCh38.p5 using Bowtie version 2.2.9 (-k 20). A custom perl script was used to obtain only the mapping results with the best alignment score. Initial differential methylation analysis was carried out using the MethylAction package (version 2.0) in R (version 3.3.1) and Gencode v24 as the annotation (16). Window sizes of 50 base-pairs were used in the getCounts function of the package. The Goldmine package (version 1.0) in R was used to assign biological annotation to the joined window results produced by MethylAction (16).
For RNA-seq data, the resulting reads were mapped against GRCh38.p5 using TopHat2 version 2.1.1 with parameters “–b2-very-sensitive –read-edit-dist 2 –max-multihits 100”. Read counts for each gene were created using custom perl scripts and Gencode v24 as the annotation. Custom perl scripts were used for estimation of transcript abundances based on Fragments Per Kilobase of exon per Million fragments mapped (FPKM). Initial differential expression analysis was carried out using the DESeq2 package (version 1.12.4) in R/Bioconductor (R version 3.3.1) (17). Pathway analysis was performed on both MC- and RNA-seq data using Ingenuity Pathway Analysis (Qiagen).
Statistical analysis
All data are presented as mean values ± SD of at least three biological experiments unless otherwise indicated. IC50 values were determined by Prism 6 (GraphPad Software), using logarithm normalized sigmoidal dose curve fitting. The estimate variation within each group was similar therefore student’s t-test was used to statistically analyze the significant difference among different groups by using Prism 4.0 (GraphPad Software).
Results
Epigenetic inhibition of adipocytes decreases OC cell migration and invasion
Adipocytes of the omentum play a key role in promoting the growth of metastatic lesions (18). To examine the effects of adipocytes on migration and invasion, EOC cells were seeded in the top compartment of the Boyden chamber and allowed to migrate (8h) and invade (16h) towards adipocytes in the bottom of the well. The presence of adipocytes increased (P < 0.05) migration (>20-fold; Fig. 1A) and invasion (>10-fold; Fig. 1B) of all EOC cells lines examined (Supplemental Fig. S1A, B). Based on previous evidence of obesity-induced methylation changes in adipose tissue (8) and altered methylation in adipocytes by DNMT inhibition (7), we hypothesized that epigenetic inhibition of adipocytes may demethylate and reexpress factors that could affect migration and invasion of OC cells. Guadecitabine pretreatment of adipocytes (100nM, 3X daily) decreased (P < 0.05) EOC cell migration (>26%; Fig. 1C) and invasion (>27%; Fig. 1D) towards adipocytes with the exception of SKOV3 (Supplemental Fig. S1C, D). To test whether residual guadecitabine has any effect on cell migration and invasion, we repeated this experiment as before with guadecitabine (100nM, 3X daily) in 10% FBS serum media without adipocytes. There was no change in migration and invasion in the presence of residual guadecitabine (Supplemental Fig. S2A, B), suggesting that decreased cell migration and invasion towards adipocytes were a result of guadecitabine treatment of adipocytes and not residual drug concentration. To assess whether guadecitabine has an effect on adipocyte viability, adipocytes were treated with guadecitabine (100nM, daily 3X) and caspase assay was performed. No effect on caspase levels in adipocytes was observed after guadecitabine treatment (Supplemental Fig. S2G), demonstrating that a change in adipocyte population was not responsible for the decreased migration and invasion after guadecitabine treatment.
Figure 1. Guadecitabine treatment of adipocytes decreases migration and invasion of epithelial ovarian cancer cells.
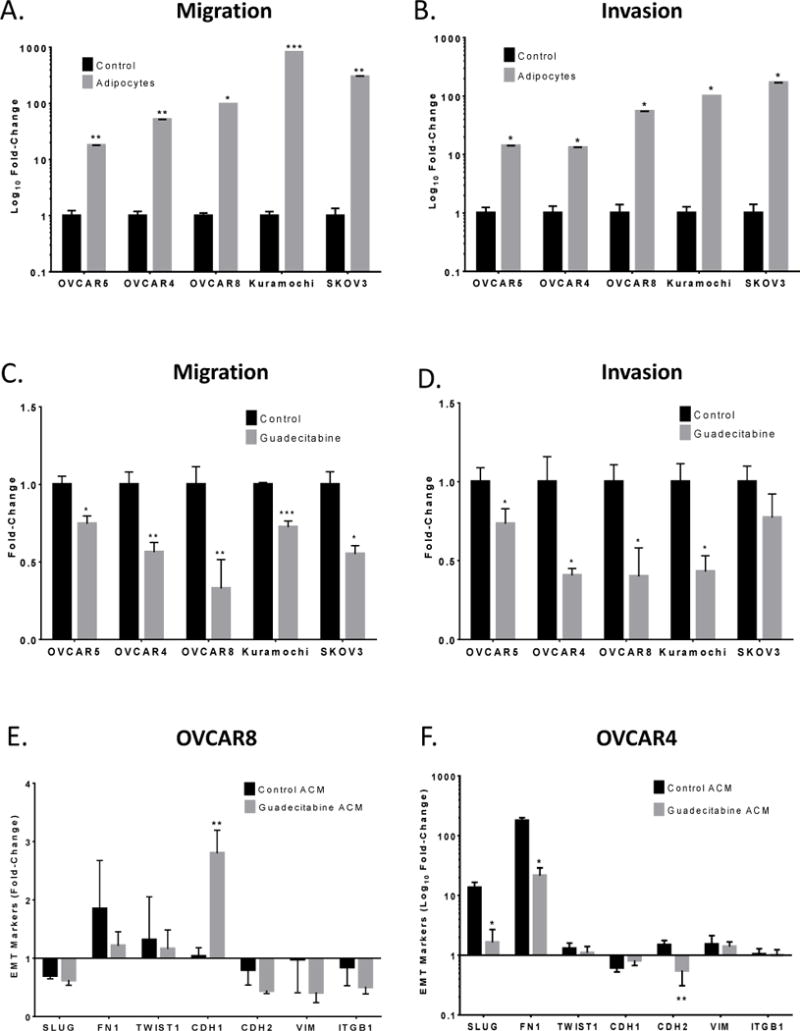
(A). OVCAR5, OVCAR4, OVCAR8, Kuramochi, and SKOV3 cells (200,000) were seeded in the top of the Boyden chamber and allowed to migrate (8h) or (B) invade (16h) towards adipocytes in a 24-well plate. (C). Adipocytes were treated with guadecitabine (100nM, daily 3X), removed and replaced with serum-free media; then ovarian cancer cells (200,000) were seeded in the top of the Boyden chamber and allowed to migrate (8h) or (D) invade (16h). (E). Adipocyte-conditioned media (ACM) collected from adipocytes treated with guadecitabine (100nM, daily 3X) or blank media was used to culture OVCAR8 and (F) OVCAR4 cells for 24h. EMT markers (SLUG, FN1, TWIST1, CDH1, CDH2, VIM, ITGB1) were analyzed by qRT-PCR with RNA from OVCAR8 and OVCAR4 cells. All experiments were performed in triplicate. (*P < 0.05, **P < 0.01).
Adipocyte-cancer cell 2-way communication occurs through secreted factors in the Boyden chamber assay. To assess if similar results could be obtained using ACM, migration and invasion assays were repeated with Kuramochi and OVCAR4 cells. A decrease (P < 0.001) in migration (Supplemental Fig. S2C, D) and invasion (Supplemental Fig. S2E, F) towards ACM compared to adipocytes was observed and no effect of ACM from guadecitabine-treated adipocytes on either migration or invasion was seen (Supplemental Fig. S2C-F). One explanation for these observations is that cytokines present in ACM may be unstable and without constant cytokine secretion by adipocytes, migration and invasion was not induced. However, as initial Boyden chamber assays of adipocytes and OC cells were indirectly cocultured, secreted factors were likely responsible for the observed effects.
Decreased EOC cell migration and invasion after guadecitabine treatment of adipocytes suggested an alteration of secreted factors into the media. ACM collected from adipocytes treated with or without guadecitabine was used to culture OVCAR8 and OVCAR4 cells and expression of known EMT genes (SLUG, FN1, TWIST1, CDH1, CDH2, VIM, and ITGB1) were examined relative to basal EMT marker levels in OVCAR4/8 cells grown in regular media. Guadecitabine ACM increased (P < 0.01) CDH1 expression in OVCAR8 (Fig. 1E) and decreased (P < 0.05) expression of SLUG, FN1, and CDH2 in OVCAR4 (Fig. 1F), suggesting that guadecitabine altered secretion of adipokine(s) which modified EMT marker expression in EOC.
Guadecitabine induces decreased DNMT1 levels in adipocytes
The known molecular mechanism of guadecitabine is incorporation of decitabine (5-aza-CdR) into replicating DNA during cell division which covalently binds DNMT on carbon 6 of decitabine and leads to DNMT depletion (19,20). However, as mature adipocytes do not divide (21), and the cultures represented a heterogeneous mixture of mature and preadipocytes, we tested whether undifferentiated adipocytes may have contributed to the observed response to guadecitabine. Expression of the preadipocyte marker DLK1 (22) was low (P<0.001) in adipocytes (Supplemental Fig. S3A) compared to mature adipocyte marker PPARγ (Supplemental Fig. S3B). Furthermore, after adipocyte differentiation (i.e., mature), increased (P < 0.05) expression of FABP4 was observed (Supplemental Fig. S3A). Because of the known mechanism of action of guadecitabine and the absence of preadipocyte markers in the differentiated cultures, it was of interest to determine whether or not any cells in the differentiated culture were undergoing DNA synthesis. Optimal concentration of aphidicolin to inhibit DNA synthesis (1μg/mL aphidicolin, daily 4X) was determined by BrdU ELISA (Supplemental Fig. S3C). No cell toxicity was detected by caspase 3/7 (Supplemental Fig. S3D) and trypan blue assays (Supplemental Fig. S3E). BrdU staining in preadipocytes was reduced after aphidicolin treatment (P < 0.05), whereas aphidicolin treatment of adipocytes resulted in negative BrdU staining similar to control (Fig. 2A). In addition, aphidicolin treatment decreased (P < 0.05) preadipocyte cell proliferation but had no effect on adipocyte proliferation (Fig. 2B). Furthermore, cell cycle analysis revealed that 6.78% of preadipocytes were in S phase whereas only 1.80% of adipocytes were in S phase with no difference after aphidicolin treatment (Fig. 2C).
Figure 2. Guadecitabine degrades DNMT1 in the absence of DNA synthesis and cell division.
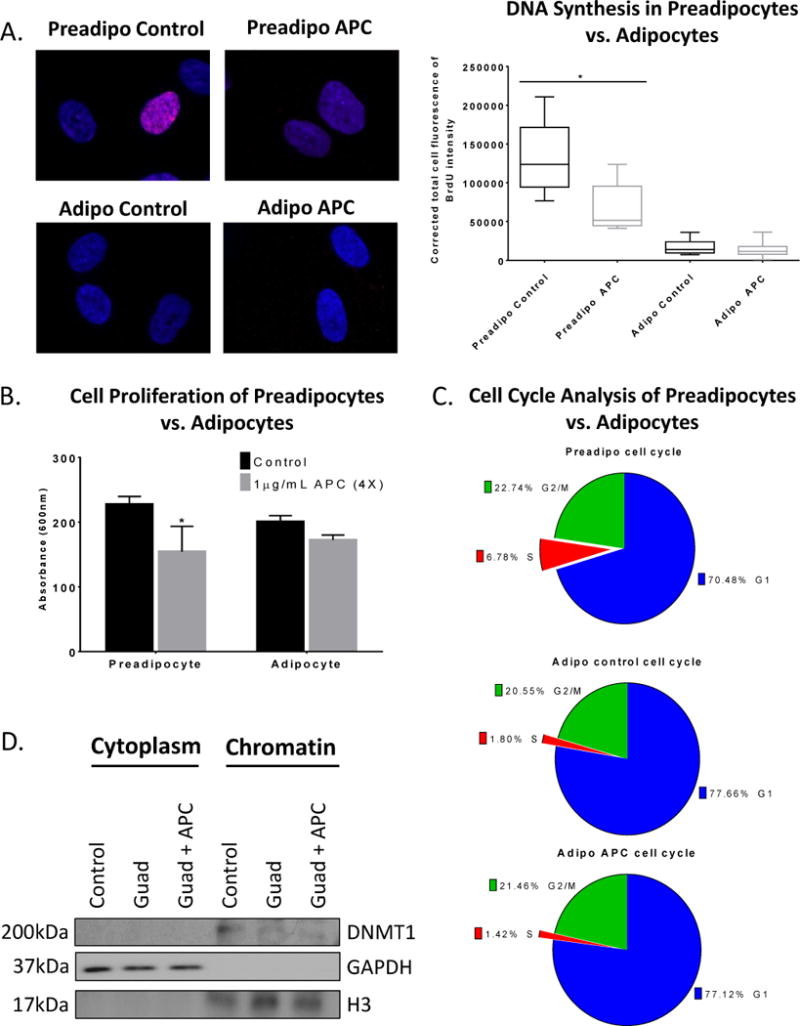
(A). BrdU immunofluorescence labeling (2h) was performed in preadipocytes and adipocytes treated with the DNA synthesis inhibitor aphidicolin (APC) (1μg/mL, daily 4X). (B) MTT cell proliferation assay was performed in preadipocytes and adipocytes treated with aphidicolin (APC) (1μg/mL, daily 4X). (C). Propidium iodide cell cycle flow cytometry analysis was performed on preadipocytes and adipocytes treated with APC (1μg/mL, daily 4X). (D). Subcellular fractionation was performed on adipocytes treated with either guadecitabine (100nM, daily 3X) alone or APC (1μg/mL, daily 4X) starting on day 1 and guadecitabine together with APC therein after for 3 days. Western blot was performed on cytoplasmic and chromatin fractions and probed for DNMT1, histone H3, and GAPDH. All experiments were performed in triplicate. (*P < 0.05).
To test whether guadecitabine depleted soluble DNMT1 and/or chromatin bound DNMT1 (23), subcellular fractionation of adipocytes was performed. DNMT1 was not detectable in cytoplasm; however, chromatin bound DNMT1 (Fig. 2D) and whole cell DNMT1 (Supplemental Fig. S3F) were decreased after guadecitabine treatment, despite the presence of DNA synthesis inhibitor. GAPDH and histone H3 serve as cytoplasmic and nuclear controls, respectively, for the cellular fractionation. Furthermore, DNMT1 mRNA expression in adipocytes was unchanged after guadecitabine treatment (Supplemental Fig. S3G), suggesting that the molecular mechanism of guadecitabine in adipocytes is replication-independent because DNMT1 mRNA levels positively correlated with replication. Taken together, these results demonstrated guadecitabine-induced decreased DNMT1 levels in adipocytes in the absence of cell division or DNA synthesis.
Adipocytes increase HGSOC cell proliferation
Previous studies indicated a role of cancer associated adipocytes in proliferation and carboplatin resistance (24) and that hypomethylating agents can reverse platinum resistance in EOC cells (9,25). Therefore, we investigated if adipocytes increased OC cell proliferation and whether DNMT inhibition of adipocytes could reverse proliferation of EOC cells. Unexpectedly, ACM alone had no effect on HGSOC cell proliferation (Supplemental Fig. S4A-D); however, indirect coculture of HGSOC cells with adipocytes increased (P < 0.05) OC cell proliferation and pretreatment with guadecitabine resulted in no decrease (Fig. 3A-C) except in Kuramochi cells (Fig. 3D). To test the effects of direct coculture, adipocytes were treated with guadecitabine, the DNMT inhibitor was removed, OVCAR8-RFP cells were then seeded directly onto adipocytes, and both cells were treated with increasing doses of carboplatin. The presence of adipocytes increased (P < 0.05) OVCAR8-RFP proliferation in a carboplatin dose-dependent manner (Fig. 3F) compared to control (Fig. 3E) and guadecitabine treatment of adipocytes resulted in no change in OVCAR8-RFP proliferation (Fig. 3G), compared to carboplatin alone. OVCAR8-RFP proliferation with adipocytes were quantified using flow cytometry (Fig. 3H). These results demonstrated adipocytes increased OVCAR8-RFP proliferation when treated with carboplatin in direct coculture with adipocytes.
Figure 3. Adipocytes increase HGSOC proliferation.
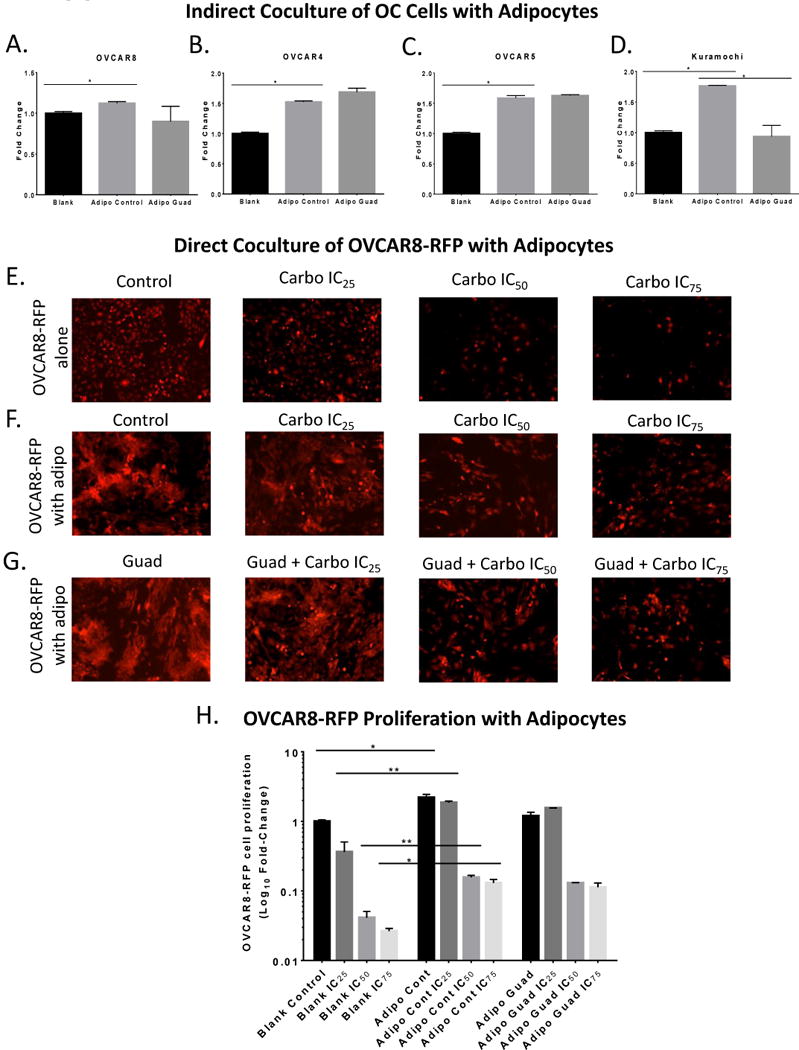
(A). MTT proliferation assay of OVCAR8, (B) OVCAR4, (C) OVCAR5, (D) Kuramochi cells in the top of 0.45 micron Boyden chamber in indirect coculture with adipocytes treated with guadecitabine (100nM, daily 3X). (E). Images of OVCAR8-RFP cells plated directly in a 6-well plate and treated with carboplatin at IC25, IC50, and IC75 in serum-free media for 6d. (F). Images of OVCAR8-RFP cells directly cocultured with SGBS adipocytes (1:3 ratio) in serum-free media and treated with carboplatin IC25=10.67 μM, IC50=32 μM, and IC75=96μM for 6d. (G). Images of OVCAR8-RFP cells directly cocultured with SGBS adipocytes initially treated with guadecitabine (100nM, daily 3X) and removed, then OVCAR8-RFP cells and adipocytes were treated with carboplatin IC25, IC50, and IC75 for 6d. (H). Flow cytometry was performed to quantify number of OVCAR8-RFP when cocultured with SGBS adipocytes in comparison to control, guadecitabine treatment, and carboplatin treatment. All experiments were performed in triplicate. (*P < 0.05, **P < 0.01).
Guadecitabine induces DNA demethylation and gene expression in adipocytes
To assay global methylation changes, Methyl-Capture-seq (MC-seq) was performed on adipocytes after low-dose (100nM, daily 3X) guadecitabine treatment. The methyl-capture DNA library was validated prior to sequencing by qRT-PCR of TSH2B (hypermethylated gene control) and GAPDH (hypomethylated gene control) (Supplemental Fig. S5A). MethylAction (16) analysis resulted in 3246 hypomethylated and 309 hypermethylated genes compared to control (FC > 10; FDR < 0.05; Fig. 4A, Supplemental Table S2). Goldmine was used to reveal the genomic context of differentially methylated regions (DMRs) of guadecitabine-treated adipocytes. The distribution of DMRs after guadecitabine treatment showed that hypomethylation in promoter (> 0.03), exon (> 0.02), intron (> 0.15), and 3′ end (> 0.02) regions and hypermethylation in intergenic region (> 0.20) was increased relative to control adipocytes (Fig. 4B). Ingenuity Pathway Analysis (IPA) of the demethylated genes generated 52 pathways enriched (FDR < 0.05) in cell signaling, metabolic, and immunogenic pathways (Fig. 4C-E; Supplemental Table S3 for full list of pathways).
Figure 4. Guadecitabine-induced demethylation in adipocytes.
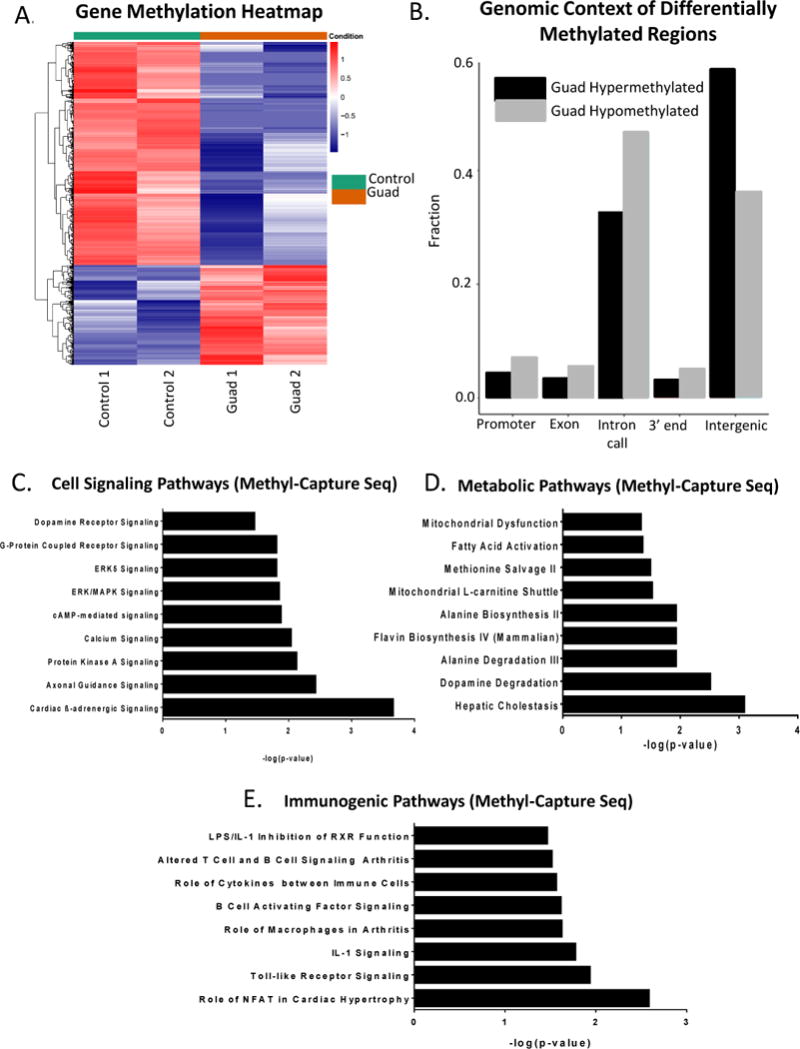
(A). Adipocytes (n=2) were treated with guadecitabine (100nM, daily 3X) and Methyl-Capture sequencing (MC-seq) was performed. Heatmap of promoter methylation (FDR < 0.05) comparing control to guadecitabine-treated adipocytes. (B). Genomic context of differentially methylated regions (DMRs) as determined by MethylAction of the same adipocytes as in (A). (C). Cell signaling, (D) Metabolic, and (E) Immunogenic pathways generated by IPA analysis of MC-seq data (FDR < 0.05).
To investigate whether the effects of demethylation in adipocytes led to reexpression of genes after guadecitabine treatment, poly(A) tail RNA-seq was performed on the same adipocytes used for MC-seq. Although over 3000 genes were demethylated, only 753 genes were upregulated after guadecitabine treatment (fold change > 1.2, P < 0.05) and 712 genes were downregulated, as seen in the volcano plot (Fig. 5A) and heatmap (Fig. 5B; Supplemental Table S4 for full list of differentially expressed genes). IPA generated 57 pathways enriched (FDR < 0.05) in cell signaling, metabolic and immunogenic pathways (Fig. 5C-E; Supplemental Table S3 for full list of pathways generated by 286 differentially expressed genes), similar to the pathways enriched by the differentially methylated genes. Six out of seven genes in IL-8 signaling pathway (PGF, RAC2, GNG2, BCL2L1, EGFR, RHOJ, and VEGFA) were validated using qRT-PCR (Supplemental Fig. S6B) compared to RNA-seq data (Supplemental Figure S6A).
Figure 5. Guadecitabine-altered gene expression in adipocytes.
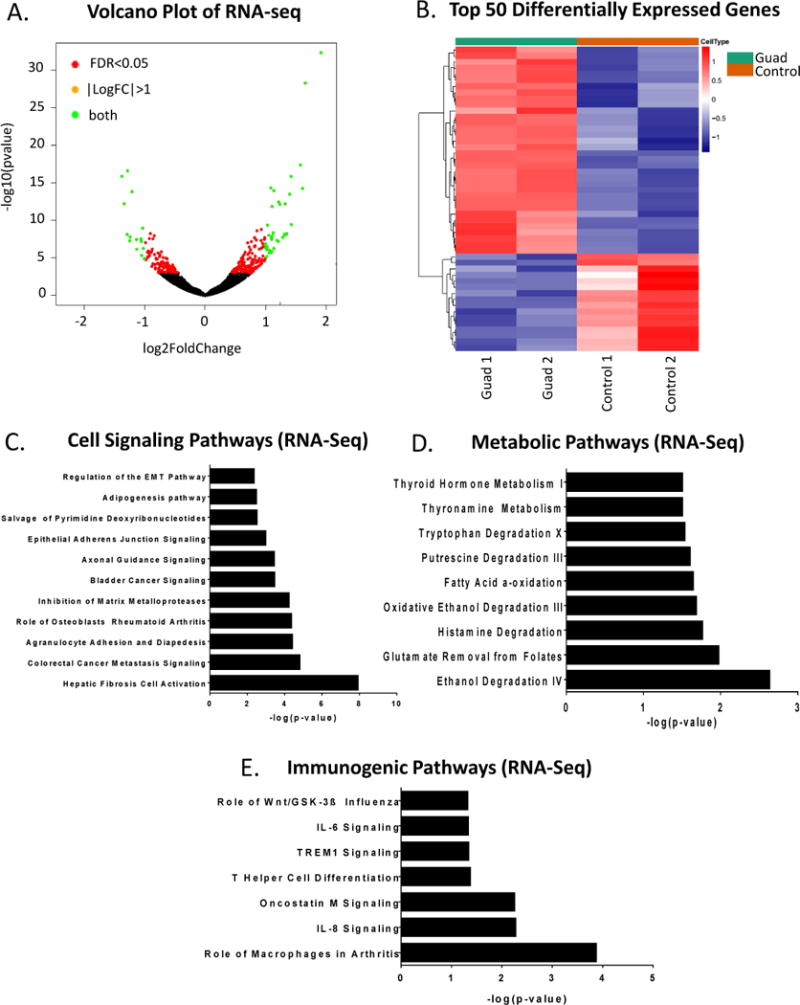
(A). Poly(A) tail RNA sequencing was performed on RNA harvested from the same adipocytes treated with guadecitabine (100nM, daily 3X) (n=2) as MC-seq. Volcano plot of upregulated and downregulated genes after guadecitabine treatment. (B). Heatmap of top 50 significantly upregulated and downregulated genes from RNA-seq comparing control vs. guadecitabine (P < 0.05). (C). Cell signaling, (D) Metabolic, and (E) Immunogenic pathways generated by IPA analysis of RNA-seq data (FDR < 0.05).
Integrated analysis of MC- and RNA-seq data generated 85 genes that remained hypermethylated and downregulated and 279 genes that were hypomethylated and upregulated (Supplemental Table S5) by guadecitabine. IPA analysis of the hypomethylated and upregulated genes generated 74 pathways again enriched (FDR < 0.05) for cell signaling, metabolic and immunogenic pathways (Supplemental Fig. S5B-D; Supplemental Table S3 for full list of integrated analysis pathways).
To identify potential changes in methylation and gene expression due to the 2-way communication between adipocytes and OC cells, we indirectly cocultured OVCAR5-RFP cells using a 0.45 micron Boyden chamber with adipocytes for 4 days, collected the RNA from adipocytes, and performed RNA-seq. The top 5 altered pathways in adipocytes revealed that coculture with OC cells suppressed LXR/RXR activation pathway and activated IL-6 signaling, leukocyte extravasation signaling, dendritic cell maturation, and IL-8 signaling compared to pathway alterations in adipocytes treated with guadecitabine (FC>1.2, FDR<0.05) (Supplemental Fig S6D; Full list in Supplemental Table S6). These results demonstrate that communication between OC cells and adipocytes may lead to changes in pathways in adipocytes.
SUSD2 upregulation and secretion decreases migration and invasion
It was of interest to examine the above results for genes associated with cytokines or other secretory factors known to inhibit OC cell progression. Demethylated and reexpressed genes of interest (FDR < 0.05) included SUSD2, TFP12, GREM1, NBL1, TMBIM1, LY6K, ISG15, PLA2G4A, TRIM29, PSG4, PRDX2, ACOT7, GPAT2, PLA2G5, and SLC25A1, and these were validated by qRT-PCR in the same RNA samples used for sequencing (Fig. 6A). Separate adipocyte samples treated with guadecitabine were tested and only SUSD2, TFPI2, GREM1, PLA2G4A, TRIM29 corresponded with increased (P < 0.05) expression (Fig. 6B). Of these genes, significant epigenetic reexpression (fold change = 3.15; Supplemental Table S4) of SUSD2 (sushi domain containing 2) and demethylation of SUSD2 in the promoter region with reexpression in the gene body was observed (Fig. 6C; Integrated Genome Viewer).
Figure 6. Demethylation and reexpression of SUSD2 in adipocytes.
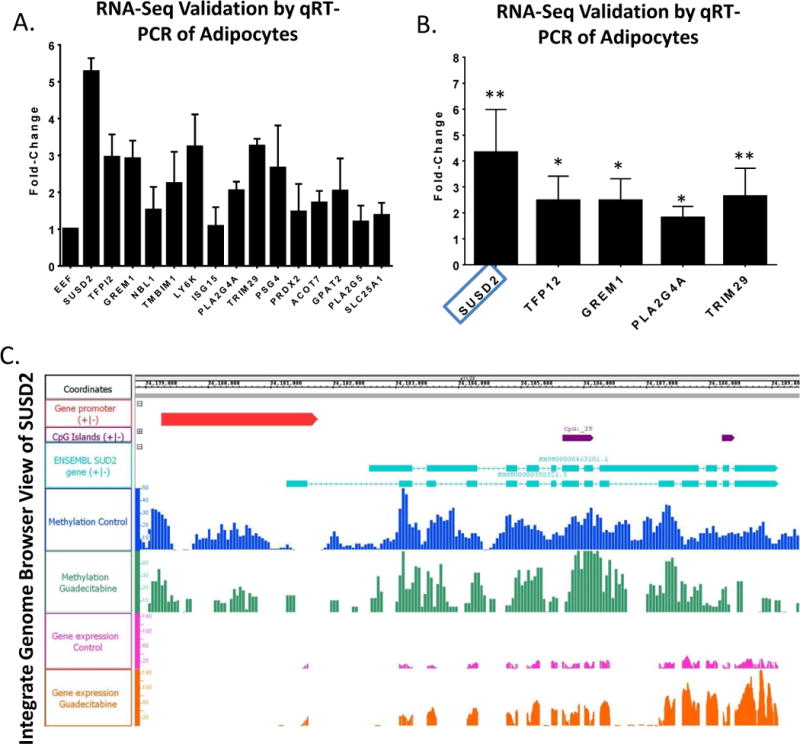
(A). qRT-PCR validation of genes significantly hypomethylated and upregulated in Methyl-Capture- and RNA-seq data from RNA derived from same adipocytes as Fig. 5 (performed in duplicate). (B) qRT-PCR validation of the same genes from RNA derived by 3 different adipocyte samples (performed in triplicate) (*P < 0.05, **P < 0.01). (C). Integrated Genome Browser view of SUSD2 gene promoter region, CpG islands, methylation, and RNA-seq data (performed in duplicate).
Previously described as a secreted tumor suppressor in HGSOC (26), it was of interest to test whether guadecitabine treatment altered secretion of SUSD2 in the adipocyte culture media. SUSD2 ELISA was performed on adipocyte-conditioned media (control v. guadecitabine) and results demonstrated that guadecitabine treatment increased (P < 0.01) SUSD2 secretion (1.48 fold) from 46.3 ± 3.37ng/mL to 67.6 ± 3.91ng/mL (Fig. 7A). Also, flow cytometry analysis of surface level SUSD2 on adipocytes demonstrated an increase (P < 0.05) after guadecitabine treatment (Fig. 7B). Furthermore, treatment with recombinant SUSD2 (100ng/mL, 500ng/mL placed in the bottom of the Boyden chamber) decreased (P < 0.05) OVCAR8 (fold change > 81%) and OVCAR4 (fold change > 30%) cell migration and OVCAR8 (fold change > 42%) and OVCAR4 (fold change > 41%) cell invasion (Fig. 7C). However, recombinant SUSD2 had no effect on OVCAR4 (Fig. 7D) and OVCAR8 proliferation (Fig. 7E) compared to carboplatin alone. The use of 100ng/mL SUSD2 used in the migration, invasion, and proliferation assays is higher than levels determined by ELISA (46 – 68ng/mL) but not unreasonable. Furthermore, higher dose SUSD2 (500ng/mL) had no additional effect in migration, invasion and proliferation, suggesting a level of saturation.
Figure 7. Guadecitabine treatment increases SUSD2 secretion and recombinant SUSD2 decreases migration and invasion.
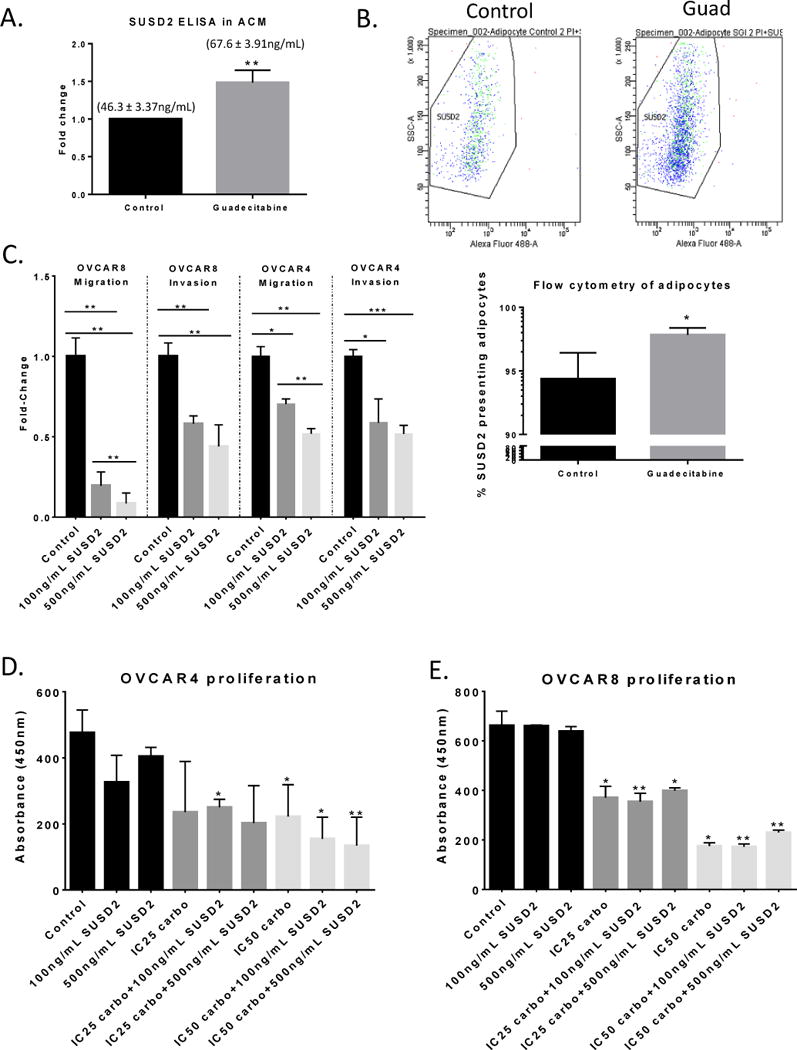
(A) SUSD2 ELISA of clarified ACM from adipocytes treated with guadecitabine. Numbers above the bars represent mean ± SEM of SUSD2. (B) Flow cytometry analysis of SUSD2 surface presentation on adipocytes after guadecitabine treatment. (C). Boyden chamber migration (8h) and invasion (16h) of OVCAR4/8 (200,000) towards 100, 500ng/mL recombinant SUSD2 in 10% FBS DMEM media. (D) OVCAR4 and (E) OVCAR8 proliferation after coculture with 100ng/mL or 500ng/mL human, recombinant SUSD2 in 10% FBS DMEM media with carboplatin (7 days). Statistical analysis was performed compared to control. All experiments were performed in triplicate. (*P < 0.05, **P < 0.01).
To note, SUSD2 mRNA levels of the cell lines were calculated using the slope generated by linear regression analysis of a SUSD2 primer efficiency curve generated by qRT-PCR (Supplemental Fig. S6C). SUSD2 concentrations for OVCAR4, OVCAR5, OVCAR8, Kuramochi, and SKOV3 cells were 39.77, 103.51 10.67, 3.11, and 0.95 ng/μl, respectively. Collectively, these results demonstrated that DNMT inhibition of adipocytes increased SUSD2 secretion resulting in decreased HGSOC cell migration and invasion towards adipocytes.
Discussion
The majority of OC patients present at late stage with extensive metastases to the omentum. Adipocytes have been associated with metastasis of ovarian and other cancers (1). Adipose tissue represents a hypoxic area with elevated levels of proinflammatory factors and increased macrophage invasion (27). Mice fed a “Western” diet revealed increased adhesion to mesothelial explants and ovarian tumor burden compared to control (5), demonstrating that the adipocyte-rich metastatic niche plays a key role in OC progression. Despite the prominent role adipocytes play in OC, the molecular mechanism involved in increased metastasis remains incompletely understood. In this study, we demonstrate adipocytes increase migration and invasion of OC cells, and that epigenetic drug treatment of adipocytes reverses this trend by upregulating SUSD2 and other tumor suppressor genes.
The omentum is a complex organ with endocrine, metabolic, and immune regulatory roles. Recent findings have shown cancer-associated adipocytes secrete adipokines that stimulate adhesion, migration and invasion of cancer cells (1). Here we demonstrate that adipocytes increase migration and invasion of OC cells. Once associated with adipocytes, OC cells are able to engage in exchange of metabolites that promote tumorigenesis, including direct transfer of lipids through FABP4 (3) and adipocyte activated SIK2 regulation of fatty acid oxidation in OC cells (6). Adipocytes have been demonstrated to protect cancer cells from therapies by enhancing EMT process, upregulating pro-survival genes, increasing oxidative stress response, activating autophagy, increasing adipocyte-secreted glutamine, and dysregulating of genes involved in gemcitabine transport and metabolism (28). Our findings demonstrate that direct coculture of carboplatin-treated OVCAR8-RFP cells and adipocytes increase OVCAR8-RFP cell proliferation. However, there was no change in cell proliferation after guadecitabine treatment compared to carboplatin alone, suggesting that treatment of adipocytes with guadecitabine primarily affects migration and invasion. These results further indicate the importance of adipocytes in OC progression and suggests targeting adipocytes as a potential therapeutic strategy in OC.
DNA methylation changes after DNMT1 inhibition in adipose-derived stem cells (29), differentiating human adipocytes (30), and 3T3-L1 preadipocyte differentiation (31) have been reported, and epigenetic alterations in cancer cells in the context of metabolic remodeling caused by obesity have been examined (32). Although altered DNA methylation of important metabolic regulators in adipocytes of obese subjects has been described, including hypermethylation of adiponectin (7) and hypomethylation of leptin (33), epigenetic alterations of adipocytes associated with cancer have not been examined. In this study, we demonstrate that by altering DNA methylation and upregulating adipokines involved in negative regulation of OC cell homing, guadecitabine treatment of adipocytes decreases migration and invasion of OC cells. In agreement with observations of others demonstrating that adipocytes induce EMT of OC cells (3), our data show that guadecitabine treatment of adipocytes alters adipokine secretion and subsequently altered EMT markers in OC cells, including CDH1, SLUG, FN1, and CDH2, further suggesting that epigenetic therapy of adipocytes can influence proximal cancer cells.
The known molecular mechanism of cytidine analogue DNMT inhibitors is replication-dependent (34); however, mature adipocytes do not divide. We took several approaches (BrdU immunohistochemical staining, MTT proliferation assay, and propidium iodide cell cycle analysis) to confirm that the adipocytes used in this study were neither dividing nor synthesizing new DNA. In support of our results, 5-azacitidine induces TNFα demethylation in mature 3T3-L1 cells (35) and treatment of 3T3-L1 cells with 5-aza-dC at the late stage of differentiation markedly enhances expression of adipocyte lipogenic markers, such as Fas and Srebp1c (31). Furthermore, we show that guadecitabine decreases DNMT1 levels in both soluble and chromatin subcellular fractions of mature adipocytes despite the presence of DNA synthesis inhibitor, and previous studies report DNMT1 degradation following 5-aza-deoxycytidine in non-dividing cancer cells (23,36). Interestingly, covalent bond formation between DNMT1 and 5-aza-deoxycytidine-incorporated DNA is not essential for DNMT1 enzyme degradation (36) and 5-aza-deoxycytidine-mediated DNMT1 degradation is not absolutely associated with cell cycle progression in HCT116 colon cancer cells but is associated with their p53 genotype (23). These studies suggest an alternative mechanism of cytosine analogue-induced DNMT1 degradation that is not strictly dependent on cell division. Our data suggest that DNMT inhibition can occur in non-dividing adipocytes and elicit anti-metastatic effects on OC cells.
The majority of studies regarding adipose tissue genome-wide DNA methylation were performed in the context of body-mass index, exercise, or adipogenesis (37–39). However, genome-wide DNA methylation alterations after DNMT inhibition of mature adipocytes remains relatively unexplored. We show that guadecitabine treatment of adipocytes in vitro may alter cell signaling pathways including ERK/MAPK and cAMP-mediated signaling, fatty acid activation metabolic signaling, and toll-like receptor signaling, all of which have been implicated in regulating metastasis and cancer metabolism (40,41). Our future studies will include validation of IL-8 pathway related genes beyond mRNA expression. In addition, we observed upregulation of SUSD2 (adhesion molecule), TFPI2 (serine protease inhibitor), and GREM1 (BMP antagonist) in adipocytes treated with guadecitabine and pathway analysis demonstrates inhibition of matrix metalloprotease and EMT pathways and suggests that hypomethylating agents have an indirect effect on OC cells through altered adipokine secretion.
DNMT inhibitor treatment has previously been demonstrated to induce interferon response by derepressing hypermethylated endogenous retrovirus genes and subsequently sensitizing OC cells to immune checkpoint therapy (42). Our observation that guadecitabine upregulate PLA2G4A and TRIM29, both of which are involved in inflammatory response (43) and interferon γ signaling (44), respectively. RNA-seq of adipocytes cocultured with OC cells demonstrates that 2-way communication between OC cells and adipocytes also affects adipocyte gene expression and pathways. IL-6 and IL-8 pathways in adipocytes are upregulated after co-culture with OC cells, demonstrating an increase in inflammatory cytokines that are known to increase EMT. Also, LXR/RXR activation pathway, which plays a major role in lipid homeostasis, is downregulated (FC>1.2, FDR<0.05), suggesting an alteration in lipid transport in adipocytes when cultured in proximity with OC cells. Based on these collective results, we suggest that epigenetic therapy can indirectly inhibit OC metastasis by modifying signaling pathways in adipocytes and possibly alter the immune response by inducing inflammatory response genes and lipid transport in adipocytes in the tumor microenvironment.
SUSD2 has been shown to be a tumor suppressor in non-small cell lung (45), colon cancer (46), renal cell (47), hepatocellular (48), and ovarian cancer (26), and high SUSD2 levels associate with improved survival in OC (26). SUSD2 reexpression in renal cell carcinoma and lung cancer inhibited clonogenicity and proliferation (47), and SUSD2 knockdown in OVCAR3, OVSAHO, and Kuramochi cell lines increases migration and mesothelial clearance ability (26). Our data show guadecitabine-treated adipocytes upregulate SUSD2 secretion into the media and recombinant SUSD2 decreases HGSOC cell migration and invasion. SUSD2 is localized on the plasma membrane where the N-terminus is cleaved with only the transmembrane C-terminus domain remaining (49). Our study demonstrates that soluble SUSD2 interacts with OC cells to decrease metastatic behavior. Only two reports detail SUSD2 binding partners, galectin-1 (Gal-1; binds β-galactoside residues) in breast cancer (50) and colon-derived SUSD2 binding factor (CSBF) in colon cancer (46). From seven different publicly available protein-protein interaction datasets, several SUSD2 binding partners were predicted (Supplemental Table S1). DLG4 is the only membrane associated protein that could be a SUSD2 receptor. However, DLG4-SUSD2 interaction has yet to be demonstrated. Further studies are needed to define the exact binding partner of SUSD2 in the context of OC and adipocytes. In addition, we show that recombinant SUSD2 interacts with OC cells to decrease migration and invasion, warranting further investigation into the intracellular mechanism.
Our study is the first to examine the effects of a DNMT inhibitor on adipocytes in the context of the tumor microenvironment. Guadecitabine treatment of adipocytes decreases HGSOC migration and invasion at least partly through SUSD2 upregulation. These findings suggest that in addition to direct effects on cancer cells, epigenetic therapy may impact the tumor microenvironment through altered cytokine secretion to prevent OC metastasis.
Supplementary Material
Implications.
Epigenetic targeting of tumor microenvironment can affect metastatic behavior of ovarian cancer cells.
Acknowledgments
We thank Dr. F. Fang and Vaishnavi Murali for technical assistance and Dr. Mohammad Azab and Dr. Pietro Taverna (Astex Pharmaceuticals, Inc.) for providing guadecitabine. We thank Dr. Martin Wabitsch (University Medical Center Ulm, Germany) for SGBS cells. We thank Dr. Anirban Mitra for helpful discussions.
Financial support: This work was funded by the National Cancer Institute Award CA182832-01, the Ovarian Cancer Research Fund Alliance (PPDIU01.2011), National Institute of Environmental Health Sciences (R01ES023183; to H.M. O’Hagan), the V-Foundation, Indiana Clinical and Translational Sciences Institute, and the Medical Sciences Doane and Eunice Wright Memorial Fellowship.
Footnotes
Disclosure of Potential Conflicts of interest: None
This study was presented in part at the 2017 meeting of the American Association for Cancer Research.
References
- 1.Park J, Morley TS, Kim M, Clegg DJ, Scherer PE. Obesity and cancer mechanisms underlying tumour progression and recurrence. Nature Reviews Endocrinology. 2014;10:455–65. doi: 10.1038/nrendo.2014.94. [DOI] [PMC free article] [PubMed] [Google Scholar]
- 2.Siegel RL, Miller KD, Jemal A. Cancer statistics, 2017. CA: A Cancer Journal for Clinicians. 2017;67:7–30. doi: 10.3322/caac.21387. [DOI] [PubMed] [Google Scholar]
- 3.Nieman KM, Kenny HA, Penicka CV, Ladanyi A, Buell-Gutbrod R, Zillhardt MR, et al. Adipocytes promote ovarian cancer metastasis and provide energy for rapid tumor growth. Nature Medicine. 2011;17:1498–503. doi: 10.1038/nm.2492. [DOI] [PMC free article] [PubMed] [Google Scholar]
- 4.Cancer CGoESoO. Ovarian cancer and body size: individual participant meta-analysis including 25,157 women with ovarian cancer from 47 epidemiological studies. PLOS Med. 2012;9:e1001200. doi: 10.1371/journal.pmed.1001200. [DOI] [PMC free article] [PubMed] [Google Scholar]
- 5.Liu Y, Metzinger MN, Lewellen KA, Cripps SN, Carey KD, Harper EI, et al. Obesity contributes to ovarian cancer metastatic success through increased lipogenesis, enhanced vascularity, and decreased infiltration of M1 macrophages. Cancer Research. 2015;75:5046–57. doi: 10.1158/0008-5472.CAN-15-0706. [DOI] [PMC free article] [PubMed] [Google Scholar]
- 6.Miranda F, Mannion D, Liu S, Zheng Y, Mangala LS, Redondo C, et al. Salt-inducible kinase 2 couples ovarian cancer cell metabolism with survival at the adipocyte-rich metastatic niche. Cancer Cell. 2016;30:273–89. doi: 10.1016/j.ccell.2016.06.020. [DOI] [PubMed] [Google Scholar]
- 7.Kim AY, Park YJ, Pan X, Shin KC, Kwak S-H, Bassas AF, et al. Obesity-induced DNA hypermethylation of the adiponectin gene mediates insulin resistance. Nature Communications. 2015;6 doi: 10.1038/ncomms8585. [DOI] [PMC free article] [PubMed] [Google Scholar]
- 8.Benton MC, Johnstone A, Eccles D, Harmon B, Hayes MT, Lea RA, et al. An analysis of DNA methylation in human adipose tissue reveals differential modification of obesity genes before and after gastric bypass and weight loss. Genome Biol. 2015;16:8. doi: 10.1186/s13059-014-0569-x. [DOI] [PMC free article] [PubMed] [Google Scholar]
- 9.Fang F, Munck J, Tang J, Taverna P, Wang Y, Miller DF, et al. The novel, small-molecule DNA methylation inhibitor SGI-110 as an ovarian cancer chemosensitizer. Clinical Cancer Research. 2014;20:6504–16. doi: 10.1158/1078-0432.CCR-14-1553. [DOI] [PMC free article] [PubMed] [Google Scholar]
- 10.Matei D, Ghamande S, Roman LD, Secord AA, Nemunaitis J, Markham MJ, et al. A phase 1 clinical trial of guadecitabine and carboplatin in platinum-resistant, recurrent ovarian cancer: clinical, pharmacokinetic and pharmacodynamic analyses. Clinical Cancer Research. 2018 doi: 10.1158/1078-0432.CCR-17-3055. clincanres-3055. [DOI] [PMC free article] [PubMed] [Google Scholar]
- 11.Lewellen KA, Metzinger MN, Liu Y, Stack MS. Quantitation of intra-peritoneal ovarian cancer metastasis. JoVE (Journal of Visualized Experiments) 2016:e53316-e. doi: 10.3791/53316. [DOI] [PubMed] [Google Scholar]
- 12.Wabitsch M, Brenner R, Melzner I, Braun M, Möller P, Heinze E, et al. Characterization of a human preadipocyte cell strain with high capacity for adipose differentiation. International Journal of Obesity. 2001;25:8. doi: 10.1038/sj.ijo.0801520. [DOI] [PubMed] [Google Scholar]
- 13.Fink T, Zachar V. In: Adipogenic differentiation of human mesenchymal stem cells Mesenchymal Stem Cell Assays and Applications. Vemuri Mohan C, Chase Lucas G, Rao Mahendra S., editors. Springer; New York City, New York: 2011. pp. 243–51. [DOI] [PubMed] [Google Scholar]
- 14.Kim KH, Sederstrom JM. Assaying cell cycle status using flow cytometry. Current Protocols in Molecular Biology. 2015;28:6.1–6.11. doi: 10.1002/0471142727.mb2806s111. [DOI] [PMC free article] [PubMed] [Google Scholar]
- 15.O’Hagan HM, Wang W, Sen S, Shields CD, Lee SS, Zhang YW, et al. Oxidative damage targets complexes containing DNA methyltransferases, SIRT1, and polycomb members to promoter CpG Islands. Cancer Cell. 2011;20:606–19. doi: 10.1016/j.ccr.2011.09.012. [DOI] [PMC free article] [PubMed] [Google Scholar]
- 16.Bhasin JM, Hu B, Ting AH. MethylAction: detecting differentially methylated regions that distinguish biological subtypes. Nucleic acids research. 2015;44:106–16. doi: 10.1093/nar/gkv1461. [DOI] [PMC free article] [PubMed] [Google Scholar]
- 17.Love MI, Huber W, Anders S. Moderated estimation of fold change and dispersion for RNA-seq data with DESeq2. Genome Biology. 2014;15:550. doi: 10.1186/s13059-014-0550-8. [DOI] [PMC free article] [PubMed] [Google Scholar]
- 18.Nieman KM, Romero IL, Van Houten B, Lengyel E. Adipose tissue and adipocytes support tumorigenesis and metastasis. Biochimica et Biophysica Acta (BBA)-Molecular and Cell Biology of Lipids. 2013;1831:1533–41. doi: 10.1016/j.bbalip.2013.02.010. [DOI] [PMC free article] [PubMed] [Google Scholar]
- 19.Chuang JC, Warner SL, Vollmer D, Vankayalapati H, Redkar S, Bearss DJ, et al. S110, a 5-aza-2′-deoxycytidine–containing dinucleotide, is an effective DNA methylation inhibitor and can reduce tumor growth. Molecular Cancer Therapeutics. 2010;9:1443–50. doi: 10.1158/1535-7163.MCT-09-1048. [DOI] [PMC free article] [PubMed] [Google Scholar]
- 20.Sato T, Issa J-PJ, Kropf P. DNA hypomethylating drugs in cancer therapy. Cold Spring Harbor Perspectives in Medicine. 2017;7:a026948. doi: 10.1101/cshperspect.a026948. [DOI] [PMC free article] [PubMed] [Google Scholar]
- 21.Cristancho AG, Lazar MA. Forming functional fat: a growing understanding of adipocyte differentiation. Nature Reviews Molecular Cell Biology. 2011;12:722–34. doi: 10.1038/nrm3198. [DOI] [PMC free article] [PubMed] [Google Scholar]
- 22.Wang Y, Kim K-A, Kim J-H, Sul HS. Pref-1, a preadipocyte secreted factor that inhibits adipogenesis. The Journal of Nutrition. 2006;136:2953–6. doi: 10.1093/jn/136.12.2953. [DOI] [PubMed] [Google Scholar]
- 23.Al-Salihi M, Yu M, Burnett DM, Alexander A, Samlowski WE, Fitzpatrick FA. The depletion of DNA methyltransferase-1 and the epigenetic effects of 5-aza-2′deoxycytidine (decitabine) are differentially regulated by cell cycle progression. Epigenetics. 2011;6:1021–8. doi: 10.4161/epi.6.8.16064. [DOI] [PMC free article] [PubMed] [Google Scholar]
- 24.von Strandmann EP, Reinartz S, Wager U, Müller R. Tumor–host cell interactions in ovarian cancer: pathways to therapy failure. Trends in Cancer. 2017;3:137–48. doi: 10.1016/j.trecan.2016.12.005. [DOI] [PubMed] [Google Scholar]
- 25.Balch C, Yan P, Craft T, Young S, Skalnik DG, Huang TH, et al. Antimitogenic and chemosensitizing effects of the methylation inhibitor zebularine in ovarian cancer. Molecular Cancer Therapeutics. 2005;4 doi: 10.1158/1535-7163.MCT-05-0216. [DOI] [PubMed] [Google Scholar]
- 26.Sheets J, Iwanicki M, Liu J, Howitt B, Hirsch M, Gubbels J, et al. SUSD2 expression in high-grade serous ovarian cancer correlates with increased patient survival and defective mesothelial clearance. Oncogenesis. 2016;5:e264. doi: 10.1038/oncsis.2016.64. [DOI] [PMC free article] [PubMed] [Google Scholar]
- 27.Divella R, De Luca R, Abbate I, Naglieri E, Daniele A. Obesity and cancer: the role of adipose tissue and adipo-cytokines-induced chronic inflammation. Journal of Cancer. 2016;7:2346. doi: 10.7150/jca.16884. [DOI] [PMC free article] [PubMed] [Google Scholar]
- 28.Duong M, Geneste A, Fallone F, Li X, Dumontet C, Muller C. The fat and the bad: Mature adipocytes, key actors in tumor progression and resistance. Oncotarget. 2017;8:57622. doi: 10.18632/oncotarget.18038. [DOI] [PMC free article] [PubMed] [Google Scholar]
- 29.Kornicka K, Marycz K, Marędziak M, Tomaszewski KA, Nicpoń J. The effects of the DNA methyltranfserases inhibitor 5-Azacitidine on ageing, oxidative stress and DNA methylation of adipose derived stem cells. Journal of Cellular and Molecular Medicine. 2017;21:387–401. doi: 10.1111/jcmm.12972. [DOI] [PMC free article] [PubMed] [Google Scholar]
- 30.van den Dungen MW, Murk AJ, Kok DE, Steegenga WT. Comprehensive DNA methylation and gene expression profiling in differentiating human adipocytes. Journal of Cellular Biochemistry. 2016;117:2707–18. doi: 10.1002/jcb.25568. [DOI] [PubMed] [Google Scholar]
- 31.Yang X, Wu R, Shan W, Yu L, Xue B, Shi H. DNA methylation biphasically regulates 3T3-L1 preadipocyte differentiation. Molecular Endocrinology. 2016;30:677–87. doi: 10.1210/me.2015-1135. [DOI] [PMC free article] [PubMed] [Google Scholar]
- 32.Kinnaird A, Zhao S, Wellen KE, Michelakis ED. Metabolic control of epigenetics in cancer. Nature Reviews Cancer. 2016;16:694–707. doi: 10.1038/nrc.2016.82. [DOI] [PubMed] [Google Scholar]
- 33.Shen W, Wang C, Xia L, Fan C, Dong H, Deckelbaum RJ, et al. Epigenetic modification of the leptin promoter in diet-induced obese mice and the effects of N-3 polyunsaturated fatty acids. Scientific Reports. 2014;4:5282. doi: 10.1038/srep05282. [DOI] [PMC free article] [PubMed] [Google Scholar]
- 34.Jones PA, Taylor SM. Cellular differentiation, cytidine analogs and DNA methylation. Cell. 1980;20:85–93. doi: 10.1016/0092-8674(80)90237-8. [DOI] [PubMed] [Google Scholar]
- 35.García-Escobar E, Monastero R, García-Serrano S, Gómez-Zumaquero JM, Lago-Sampedro A, Rubio-Martín E, et al. Dietary fatty acids modulate adipocyte TNFa production via regulation of its DNA promoter methylation levels. The Journal of Nutritional Biochemistry. 2017;47:106–12. doi: 10.1016/j.jnutbio.2017.05.006. [DOI] [PubMed] [Google Scholar]
- 36.Ghoshal K, Datta J, Majumder S, Bai S, Kutay H, Motiwala T, et al. 5-Aza-deoxycytidine induces selective degradation of DNA methyltransferase 1 by a proteasomal pathway that requires the KEN box, bromo-adjacent homology domain, and nuclear localization signal. Molecular and Cellular Biology. 2005;25:4727–41. doi: 10.1128/MCB.25.11.4727-4741.2005. [DOI] [PMC free article] [PubMed] [Google Scholar] [Retracted]
- 37.Dick KJ, Nelson CP, Tsaprouni L, Sandling JK, Aïssi D, Wahl S, et al. DNA methylation and body-mass index: a genome-wide analysis. The Lancet. 2014;383:1990–8. doi: 10.1016/S0140-6736(13)62674-4. [DOI] [PubMed] [Google Scholar]
- 38.Rönn T, Volkov P, Davegårdh C, Dayeh T, Hall E, Olsson AH, et al. A six months exercise intervention influences the genome-wide DNA methylation pattern in human adipose tissue. PLOS Genetics. 2013;9:e1003572. doi: 10.1371/journal.pgen.1003572. [DOI] [PMC free article] [PubMed] [Google Scholar]
- 39.Broholm C, Olsson AH, Perfilyev A, Gillberg L, Hansen NS, Ali A, et al. Human adipogenesis is associated with genome-wide DNA methylation and gene-expression changes. Epigenomics. 2016;8:1601–17. doi: 10.2217/epi-2016-0077. [DOI] [PubMed] [Google Scholar]
- 40.Currie E, Schulze A, Zechner R, Walther TC, Farese RV. Cellular fatty acid metabolism and cancer. Cell Metabolism. 2013;18:153–61. doi: 10.1016/j.cmet.2013.05.017. [DOI] [PMC free article] [PubMed] [Google Scholar]
- 41.Ridnour LA, Cheng RY, Switzer CH, Heinecke JL, Ambs S, Glynn S, et al. Molecular pathways: toll-like receptors in the tumor microenvironment—poor prognosis or new therapeutic opportunity. Clinical Cancer Research. 2013;19:1340–6. doi: 10.1158/1078-0432.CCR-12-0408. [DOI] [PMC free article] [PubMed] [Google Scholar]
- 42.Chiappinelli KB, Strissel PL, Desrichard A, Li H, Henke C, Akman B, et al. Inhibiting DNA methylation causes an interferon response in cancer via dsRNA including endogenous retroviruses. Cell. 2015;162:974–86. doi: 10.1016/j.cell.2015.07.011. [DOI] [PMC free article] [PubMed] [Google Scholar]
- 43.Enyedi B, Jelcic M, Niethammer P. The cell nucleus serves as a mechanotransducer of tissue damage-induced inflammation. Cell. 2016;165:1160–70. doi: 10.1016/j.cell.2016.04.016. [DOI] [PMC free article] [PubMed] [Google Scholar]
- 44.Xing J, Weng L, Yuan B, Wang Z, Jia L, Jin R, et al. Identification of a role for TRIM29 in the control of innate immunity in the respiratory tract. Nature Immunology. 2016;17:1373–80. doi: 10.1038/ni.3580. [DOI] [PMC free article] [PubMed] [Google Scholar]
- 45.Cai C, Shi R, Gao Y, Zeng J, Wei M, Wang H, et al. Reduced expression of sushi domain containing 2 is associated with progression of non-small cell lung cancer. Oncology Letters. 2015;10:3619–24. doi: 10.3892/ol.2015.3737. [DOI] [PMC free article] [PubMed] [Google Scholar]
- 46.Pan W, Cheng Y, Zhang H, Liu B, Mo X, Li T, et al. CSBF/C10orf99, a novel potential cytokine, inhibits colon cancer cell growth through inducing G1 arrest. Scientific Reports. 2014;4:6812. doi: 10.1038/srep06812. [DOI] [PMC free article] [PubMed] [Google Scholar]
- 47.Cheng Y, Wang X, Wang P, Li T, Hu F, Liu Q, et al. SUSD2 is frequently downregulated and functions as a tumor suppressor in RCC and lung cancer. Tumor Biology. 2016;37:9919–30. doi: 10.1007/s13277-015-4734-y. [DOI] [PubMed] [Google Scholar]
- 48.Liu X-r, Cai C-x, Luo L-m, Zheng W-L, Shi R, Zeng J, et al. Decreased expression of Sushi Domain Containing 2 correlates to progressive features in patients with hepatocellular carcinoma. Cancer Cell International. 2016;16:15. doi: 10.1186/s12935-016-0286-5. [DOI] [PMC free article] [PubMed] [Google Scholar]
- 49.Sugahara T, Yamashita Y, Shinomi M, Yamanoha B, Iseki H, Takeda A, et al. Isolation of a novel mouse gene, mSVS-1/SUSD2, reversing tumorigenic phenotypes of cancer cells in vitro. Cancer Science. 2007;98:900–8. doi: 10.1111/j.1349-7006.2007.00466.x. [DOI] [PMC free article] [PubMed] [Google Scholar]
- 50.Watson AP, Evans RL, Egland KA. Multiple functions of sushi domain containing 2 (SUSD2) in breast tumorigenesis. Molecular Cancer Research. 2013;11:74–85. doi: 10.1158/1541-7786.MCR-12-0501-T. [DOI] [PMC free article] [PubMed] [Google Scholar]
Associated Data
This section collects any data citations, data availability statements, or supplementary materials included in this article.