

Abstract
Glioblastoma (GBM) is the most common primary brain malignancy and carries an extremely poor prognosis. Recent molecular studies revealed the CDK4/6-Rb-E2F axis and receptor tyrosine kinase (RTK) signaling to be deregulated in most GBM, creating an opportunity to develop more effective therapies by targeting both pathways. Using a phospho-RTK protein array, we found that both c-Met and TrkA-B pathways were significantly activated upon CDK4/6 inhibition in GBM cells. We therefore investigated the efficacy of combined CDK4/6 and c-Met/TrkA-B inhibition against GBM. We show that both c-Met and TrkA-B pathways transactivate each other, and targeting both pathways simultaneously results in more efficient pathway suppression. Mechanistically, inhibition of CDK4/6 drove NF-κB-mediated upregulation of hepatocyte growth factor (HGF), brain-derived neurotrophic factor (BDNF), and nerve growth factor (NGF) that in turn activated both c-Met and TrkA-B pathways. Combining the CDK4/6 inhibitor abemaciclib with the c-Met/Trk inhibitor altiratinib or the corresponding siRNAs induced apoptosis, leading to significant synergy against GBM. Collectively, these findings demonstrate that the activation of c-Met/TrkA-B pathways is a novel mechanism involved in therapeutic resistance of GBM to CDK4/6 inhibition and that dual inhibition of c-Met/Trk with CDK4/6 should be considered in future clinical trials.
Keywords: CDK4/6, c-Met, TrkA, TrkB, Glioblastoma, altiratinib, abemaciclib
INTRODUCTION
Glioblastoma (GBM) is the most common primary brain malignancy and one of the deadliest human cancers (1). Despite diagnostic and therapeutic advances, the prognosis remains extremely poor, with median survival of 15-18 months from the initial diagnosis (2). Therefore, alternative therapeutic options are urgently needed. Intratumoral molecular heterogeneity and adaptability are key hallmarks of GBM, and these may play a crucial role in the development of resistance to targeted therapies. GBM harbors a small subset of glioma-initiating cells (GICs) that may promote heterogeneity and adaptability and contribute to therapeutic failure (3). Notably, a recent study revealed that GICs drive adaptive changes in protein signaling within 2.5 days from the initiation of monotherapy (4). Thus, the identification of pathways activated in response to single-agent treatment (e.g. through bioinformatic, genetic or pharmacological screening approaches) may represent a novel strategy for the development of rational combination therapies to overcome these early adaptive changes.
Like other cancer cells, mechanisms regulating cell cycle progression are deregulated in GBM, leading to enhanced cell cycle re-entry and proliferation. Analysis of The Cancer Genome Atlas (TCGA) database revealed that the CDK4/6-Rb-E2F axis is deregulated in about 80% of GBMs, with lesions including loss of p16INK4a, providing an opportunity for the development of effective therapies through targeting the cell cycle in GBM (5,6). CDK4/6 inhibitors are the sole group of cell cycle inhibitors now in the clinic, with FDA approval for hormone receptor-positive breast cancers and tumors with loss of p16INK4a or increased cyclin D1 (7,8). While a few reports from preclinical GBM models have suggested that CDK4/6 inhibitors have single-agent activity against GBM (9-11), it is now evident that CDK4/6 inhibitors drive rapid genetic and non-genetic changes leading to therapeutic failure (12,13). Therefore, combination therapies will be necessary to overcome resistance to CDK4/6 inhibitors.
In addition to the CDK4/6-Rb-E2F axis, TCGA data have suggested that receptor tyrosine kinase (RTK) signaling pathways are hyperactivated in 80-90% of GBMs through genetic and non-genetic modifications—thus identifying another crucial target for GBM (14,15). In addition to mutations/amplifications in epidermal growth factor receptor (EGFR), one of the most common genetic abnormalities in GBM, other RTKs such as vascular endothelial growth factor receptor 2 (VEGFR2), platelet-derived growth factor receptor alpha (PDGFRA), and c-Met have been shown to be altered to promote growth, treatment resistance, and recurrence (6,16). Therefore, we aimed to establish an effective combination regimen against GBM via targeting the two commonly altered signaling pathways—the CDK4/6-Rb-E2F axis and RTKs.
To identify RTKs driving resistance upon CDK4/6 inhibition, we used a phospho-RTK protein array to screen for reactive changes in the activation status of various RTKs. Surprisingly, we found that strong increases in RTK signaling were observed in only two RTKs, c-Met and TrkA-B, with a few other RTKs activated to a lesser extent. Based on these findings, we hypothesized that combined activation of the c-Met/TrkA-B signaling pathways is a rapid mechanism for cancer resistance to CDK4/6 inhibition, and that the dual inhibition of c-Met/TrkA-B may overcome this resistance. Our results demonstrate that the CDK4/6 inhibitor abemaciclib and c-Met/TrkA-B inhibitor altiratinib synergistically suppress GBM, with potential relevance for other cancers as well.
MATERIALS AND METHODS
Cell culture, cell viability detection, reagents, and self-renewal assays
Primary GIC lines were received from Jakub Godlewski (Brigham and Women’s Hospital) and Jeongwu Lee (Cleveland Clinic) in 2014 and have been published previously (17,18). We verified the human identity of these cell lines with short tandem repeat profiling prior to experimentation. Established stem cell markers such as SOX2, CD133, OLIG2, and CD44 were used for validating the GICs. All cell lines tested negative for mycoplasma contamination by PCR and repeat testing was done every five weeks. Low passage number (<10) for each line was ensured throughout the study by restarting with an early-passage sample every four weeks. GIC lines were cultured as floating neurospheres using neurobasal media supplemented with glutamine, N2 (ThermoFisher), B27 (ThermoFisher), EGF (20 ng/ml, R&D), and FGF (20 ng/ml, R&D). For in vitro experiments, neurospheres were dissolved into individual cells using ethylenediaminetetraacetic acid (EDTA) 0.02% (Lonza) and were seeded onto laminin- (Corning) coated plates. For self-renewal assays, ultra-low attachment plates (Corning) were used. Neurospheres were counted following drug treatments and data were interpreted as described previously (19). Cell viability was measured with both alamarBlue (ThermoFisher Scientific) and Trypan Blue exclusion/cell counting using Cellometer Auto T4 (Nexcelom) at 72 hours from the beginning of the treatment. Abemaciclib (S7158), palbociclib (S1116) and SGX-523 (S1112) were purchased from Selleckchem. Altiratinib (B5832) was from Apexbio and PF-06273340 (6115) from Tocris. Recombinant human HGF (R&D Systems), BDNF (Peprotech), and NGF (Peprotech) were used for pathway stimulation.
Animal studies
Mouse studies were approved by the Institutional Animal Care and Use Committee (IACUC) at the University of Virginia. Either G88 (5,000 or 500) or G528 (400,000) GICs were stereotactically injected into the right striatum of six-to-eight-week-old female BALB/c SCID NCr mice. Following surgery, mice were randomized into 4 groups: control, altiratinib only, abemaciclib only, and the combined treatment. We followed two types of treatment regimens; with the continuous treatment, both altiratinib and abemaciclib were given daily and with the alternating treatment, each drug was given to the designated groups alternating three days on and three days off. Both drugs were given once-daily via oral gavage. For the continuous treatment arm, daily doses for abemaciclib (given for six days a week) and altiratinib (given every day) were 50 mg/kg and 40 mg/kg, respectively. For the alternating treatment arm, daily abemaciclib dose was 75 mg/kg and altiratinib was given at 60 mg/kg. When mice reached the terminal stage or showed neurological symptoms, they were euthanized. Mouse survival was followed and compared between groups. No animals were excluded from the survival analysis. Each group’s sample size was determined according to our experience and the predicted calculation (median survival for control group would be 35 days, treatment group would be 130 days, maximum follow-up would be 250 days with power of 85%).
Protein Analysis
Immunoblotting was performed as previously described (20). The following antibodies were used for immunoblotting: Cyclin A (sc-751), phospho-Trk (sc-8058), and Trk (sc-7268) antibodies were purchased from Santa Cruz, Actin (A5441) and GAPDH (G9545) were from Sigma-Aldrich, NGF (ab52918), BDNF (ab108319), and HGF (ab83760) were from Abcam and the remaining antibodies including phospho-Trk (4168), phospho-c-Met (3077), c-Met (8198), Cyclin D1 (2978), PARP (9542), and phospho-Rb (9308) were from Cell Signaling. The phospho-RTK antibody array (7949, Cell Signaling) was performed upon 48 hours of abemaciclib treatment according to the manufacturer’s instructions and the slide was scanned with a fluorescent reader. ELISA kits for NGF (RayBiotech, #ELH-BNGF), BDNF (RayBiotech, ELH-BDNF-1), and HGF (Life Technologies, #KAC2211) were used to measure protein concentrations in conditioned cell culture media according to manufacturer’s instructions.
Luciferase reporter assay, Caspase-3/7 assay, and siRNA transfection
Fugene HD (Promega) was used to transfect GICs with NF-κB luciferase reporter and control empty vectors according to the manufacturer’s instructions. 24 hours after transfection, abemaciclib was added and luciferase activity was measured 24 hours later with the Dual-Luciferase Reporter assay system kit (Promega) and Promega GloMax 20/20 luminometer. Caspase 3/7 levels were detected using the Caspase-Glo 3/7 Assay kit (G8090, Promega) according to the manufacturer’s instructions following 2 days of drug treatment. Control and siRNAs targeting c-Met, TrkA, and TrkB were from Dharmacon SMARTpool ON-TARGETplus. siRNA transfection of GICs was performed using Lipofectamine® RNAiMAX (ThermoFisher Scientific) according to the manufacturer’s instructions with final siRNA concentration of 10 nmol/L.
HGF, BDNF, and NGF stimulation studies of c-Met and Trk pathways
To show that HGF-induced c-Met signaling transactivates the Trk pathway, GICs were plated as a monolayer and treated with 40 ng/ml HGF for 15 minutes. Cells were then lysed for immunoblot. To demonstrate that altiratinib inhibits the activity of HGF-stimulated c-Met signaling, GICs were initially treated with altiratinib for 6 hours. At the end of the treatment, cells were incubated with 40 ng/ml HGF for 15 minutes and c-Met activity was detected with immunoblot. For BDNF and NGF induced transactivation of c-Met signaling, GICs were treated with 100 ng/ml BDNF or 100 ng/ml NGF for 25 minutes and both Trk and c-Met activities were detected with immunoblot.
Flow cytometry
Propidium iodide staining was used for flow cytometry to measure the cell cycle distribution of GICs upon drug treatments. Asynchronous GICs were treated with abemaciclib, altiratinib, or the combined treatment for 24 hours. All experiments were performed in triplicate. Cells were trypsinized, washed, fixed in 1mL of 75% ethanol, and subsequently incubated with PI staining solution (containing 50ug/mL propidium iodide, 10ug/mL RNAse and 0.05% NP40). Samples were acquired using a BD FACSCalibur and cell cycle distribution was analyzed using FlowJo and Modfit softwares.
Statistics and synergy calculations
For statistical analyses, GraphPad Prism 6 (GraphPad Software) was used. Student’s t-test and one-way ANOVA with post-hoc Tukey analysis were utilized for 2-group comparisons and multiple group comparisons, respectively. P-values less than 0.05 were considered significant using an error rate α=0.05. Kaplan-Meier analysis was used to generate mouse survival curves.
Two different synergy calculation methods were utilized: the Bliss difference and the Chou-Talalay (ComboSyn). Combination indices (CI) were generated for the Chou-Talalay method. While CI less than 1 was considered to be synergistic, CI less than 0.2 was considered strong synergy (21). The Bliss difference was calculated as described previously (22). Briefly, the Bliss value was calculated by subtracting the predicted cytotoxicity from the observed cytotoxicity of a combination therapy. When the Bliss value is zero, two individual treatments are considered additive, whereas greater than zero indicates synergy and less than zero indicates antagonism. This method is informative even if either component of a combined treatment fails to provide a notable response.
RESULTS
Simultaneous c-Met/Trk and CDK4/6 inhibition has synergistic activity against GICs
Using a phospho-RTK array, we found significant increases in the activities of both the c-Met and TrkA-B pathways relative to other RTKs following 48h abemaciclib treatment (Fig. 1A). We confirmed the hyperactivity of c-Met and TrkA-B with immunoblotting upon treatment with abemaciclib and CDK4/6 specific siRNAs (Fig. 1B and Supplementary Fig. 1A). To show potential physiological consequences of activation of c-Met and Trk signaling, we demonstrated increased activity of downstream mediators (Supplementary Fig. 1B). Two recent studies evaluated the efficacy of a c-Met/Trk inhibitor, altiratinib, in GBM singly and in combination with bevacizumab (23,24). It was shown that altiratinib had high brain penetration and suppressed both c-Met and Trk activities in vivo even at low doses. Since the baseline phosphorylation levels of both c-Met and Trk were very low in our cell lines, we initially showed that altiratinib decreased the phosphorylation of c-Met in HGF-treated GICs (Supplementary Fig. 2). We then demonstrated that when combined with abemaciclib, altiratinib significantly reduced the activities of both c-Met and TrkA-B, which were upregulated following abemaciclib treatment (Fig. 1B).
Figure 1. The combination of CDK4/6 and c-Met/Trk inhibition is synergistic against GBM.
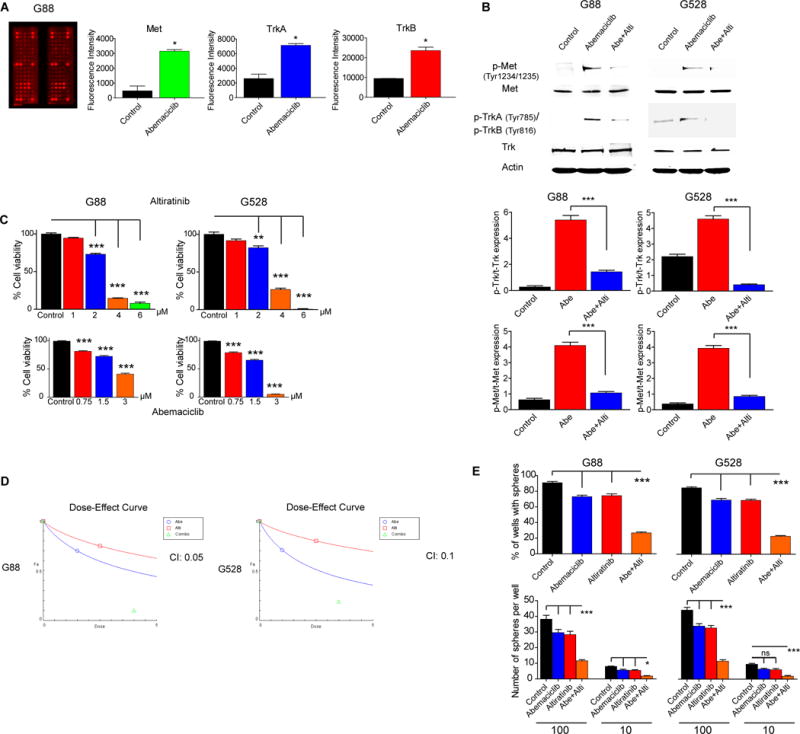
(A–B) Abemaciclib treatment increases the phosphorylation of c-Met, TrkA, and TrkB which is reversed by altiratinib. Shown is an antibody array (ELISA) (*P < 0.05; two-tailed t-test) and an immunoblot using antibodies specific for Met and Trk. Protein expressions were quantitated and plotted (***P < 0.0001). (C) GIC lines show sensitivity to both abemaciclib and altiratinib in a dose-dependent manner (**P < 0.01; ***P < 0.0001; one-way analysis of variance (ANOVA) with post-hoc Tukey analysis). (D) Dose-effect curve generated with the Chou-Talalay method using the CompuSyn program. Combination index (CI) less than 0.2 indicates strong synergy. CI values for G88 and G528 are 0.05 and 0.1, respectively. (E) Self-renewal assay. 10 and 100 GICs were plated in 24-well plates and cultured as floating cells over two weeks to compare sphere formation upon treatment with vehicle, abemaciclib (1 μM), altiratinib (2.5 μM), and the combination of abemaciclib and altiratinib (*P < 0.05; ***P < 0.0001; ANOVA with post-hoc Tukey analysis).
(Abe: Abemaciclib, Alti: Altiratinib. NS: Not significant. All values are mean ± SEM and from three biologically independent samples. Cell viabilities were determined via cell counts following three days of treatment. Each experiment was performed three times using separate samples).
These results suggested that combined c-Met/Trk inhibition might help overcome the resistance to CDK4/6 inhibition in GBM. We therefore assessed the efficacy of abemaciclib and altiratinib singly and in combination on established patient-derived GIC lines in vitro. To determine the optimal dose range for the combined treatment, we initially determined the optimal dose of individual treatment of abemaciclib or altiratinib to suppress GIC viability (Fig. 1C). A range of doses of altiratinib (0–2.5 μM) and abemaciclib (0–3 μM) were tested against two GIC lines (G88 and G528) singly and in combination. The combination therapy exhibited significant synergy, calculated using two different statistical methods, the Bliss difference and the Chou-Talalay. We found that the combination of 1.5 μM abemaciclib and 2.5 μM altiratinib provided the strongest synergy (Bliss difference >30%, Combination index 0.1) and significant cytotoxicity (80-90%) (Table 1 and Fig. 1D). We further confirmed substantial synergy using another CDK4/6 inhibitor, palbociclib (Supplementary Fig. 3A–B). With the limited dilution (self-renewal) assay, we showed that the combined treatment at low doses of each drug significantly suppressed sphere formation and reduced the number of spheres per well (Fig. 1E). Since c-Met plays a crucial role in the oncogenesis of other tissues, we interrogated whether the combined treatment could be effective against other cancer types as well. We therefore tested the combined treatment on melanoma and breast cancer lines and demonstrated synergistic in vitro effects against these lines as well (Supplementary Fig. 4).
Table 1.
The combination of abemaciclib and altiratinib
| Cytotoxicity/Bliss Difference Bliss Difference | Bliss Difference | ||||||||
| Altiratinib (μM) | 25% | 31%/2% | 39%/5% | 51%/14% | 68%/27% | 80%/33% | 100%/30% | >30% | |
| 4% | 23%/5% | 31%/7% | 38%/10% | 46%/14% | 66%/26% | 92%/26% | 20-30% | ||
| 10% | 17%/3% | 27%/6% | 33%/9% | 40%/11% | 54%/17% | 88%/24% | G88 | 10-20% | |
| 7% | 13%/1% | 23%/5% | 29%/7% | 36%/10% | 42%/7% | 81%/18% | 0-10% | ||
| 0% | 5% | 12% | 16% | 21% | 30% | 60% | |||
| Abemaciclib (μM) | |||||||||
| Altiratinib (μM) | 20% | 41%/17% | 50%/20% | 60%/26% | 81%/38% | 90%/40% | 100% | |
| 11% | 32%/16% | 41%/19% | 49%/22% | 63%/26% | 75%/30% | 100% | ||
| 8% | 24%/11% | 33%/14% | 41%/16% | 51%/16% | 65%/22% | 100% | G528 | |
| 5% | 16%/5.3% | 24%/8% | 35%/13% | 44%/11% | 56%/15% | 100% | ||
| 0% | 6% | 12% | 18% | 29% | 38% | 100% | ||
| Abemaciclib (μM) | ||||||||
Cytotoxicity and synergy scores of the combination of abemaciclib and altiratinib in two GIC lines calculated with the Bliss method. Increasing doses of each agent provided higher cytotoxicity and better Bliss difference (first number shown is observed cell death; second number is observed cell death minus expected death=Bliss difference).
Combined inhibition of c-Met/Trk and CDK4/6 significantly suppresses the cell cycle and induces cytotoxicity through enhanced apoptosis
In order to elucidate the mechanisms for significantly reduced cell viability observed with the combined treatment, we initially looked for alterations in the cell cycle, the main target of CDK4/6 inhibition. We demonstrated that the combined treatment resulted in a more efficient suppression of cell cycle progression, as indicated by significantly reduced Rb phosphorylation and a shift of GICs from the G2/S phase into the G1 phase (Fig. 2A–B and Supplementary Fig. 5).
Figure 2. The combined treatment reduces cell viability through multiple mechanisms.
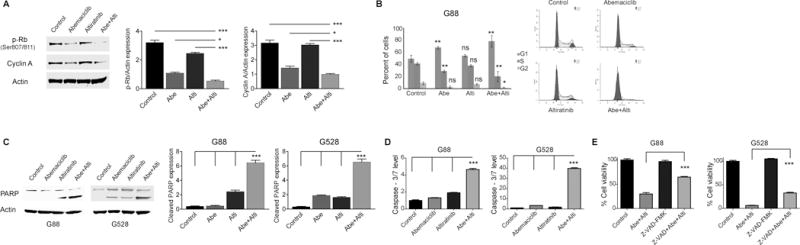
(A–B) The combination of CDK4/6 and c-Met/Trk inhibition suppresses the cell cycle. Protein expressions were detected by immunoblot using specific antibodies for p-Rb and Cyclin A, quantitated and plotted (*P < 0.05; ***P < 0.0001; one-way ANOVA with post-hoc Tukey analysis). Shown also is cell cycle analysis of G88 cells following 24 hours of treatment with abemaciclib, altiratinib, and the combination of both (*P < 0.05; **P < 0.01 (control vs. treatment groups); two-tailed t-test). (C–D) The combined treatment induces significant apoptosis. Shown is an immunoblot using antibody specific for PARP. Protein expressions were quantitated and plotted (***P < 0.0001; one-way ANOVA with post-hoc Tukey analysis). In addition, caspase-3/7 activity is significantly increased with two days of combined treatment. (***P < 0.0001; one-way ANOVA with post-hoc Tukey analysis). (E) The pan-caspase inhibitor, Z-VAD-FMK (25 μM), partially reversed cytotoxicity from the combined treatment. Cell viability was assessed at 72 hours of treatment (***P < 0.0001, one-way ANOVA with post-hoc Tukey analysis). NS: Non-significant. All values are mean ± SEM and from three biologically independent samples. The concentrations of abemaciclib and altiratinib used in the experiments were 1.5 μM and 2.5 μM, respectively.
While the suppression of the cell cycle may partly explain the reduced cell viability, other mechanisms would be necessary to explain the level of cytotoxicity observed. CDK4/6 inhibitors are mainly cytostatic agents with inhibitory effects on cell growth and proliferation, typically inducing minimal apoptosis compared to cytotoxic agents (25). We tested whether the addition of altiratinib triggered cytotoxicity through the induction of apoptosis. We showed with cleaved PARP immunoblot (a marker of apoptotic cell death) and a caspase-3/7 activity assay that the combination of altiratinib and abemaciclib significantly induced apoptosis, while apoptosis was minimal upon treatment with the individual inhibitors (Fig. 2C–D). We further confirmed the role of apoptosis in reduced cell viability using a pan-caspase inhibitor that partially rescued from the combination treatment-induced cell death (Fig. 2E).
c-Met and Trk pathways transactivate each other
To confirm the specificity of the synergy we observed with the small-molecule inhibitors and to elaborate the contribution of each pathway, we replaced altiratinib with either a specific inhibitor or siRNA for c-Met and/or Trk. Combining either a c-Met inhibitor (SGX-523) or a pan-Trk inhibitor (PF-06273340) with abemaciclib provided additive to mild synergistic effect (Fig. 3A). Likewise, when we replaced altiratinib with a c-Met, TrkA, or TrkB specific siRNA, the efficacy of the combination was significantly lower (Fig. 3B and Supplementary Fig. 6A–B). However, when we combined both SGX-523 and PF-06273340 with abemaciclib, we observed significant synergy, comparable to the altiratinib-based combination treatment (Fig. 3C). These findings indicate that dual inhibition of the c-Met and Trk pathways more efficiently overcomes the resistance to abemaciclib than targeting either pathway alone. Transactivation of RTKs is a well-known adaptive response in cancer cells, leading to more potent stimulation of shared downstream oncogenic mediators (26). We therefore interrogated whether there was crosstalk between the c-Met and Trk pathways that could explain the heightened response to altiratinib. We performed stimulation studies using HGF, BDNF, and NGF. Upon brief treatment of GICs with HGF, in addition to increased activation of the c-Met pathway we found an increase in the activity of the Trk pathway (Fig. 3D). Similarly, when we treated GICs with either NGF, the ligand for TrkA, or BDNF, the ligand for TrkB, we observed increased activity of the c-Met pathway (Fig. 3E–F), indicating that both pathways transactivate each other.
Figure 3. The c-Met and Trk pathways transactivate each other.
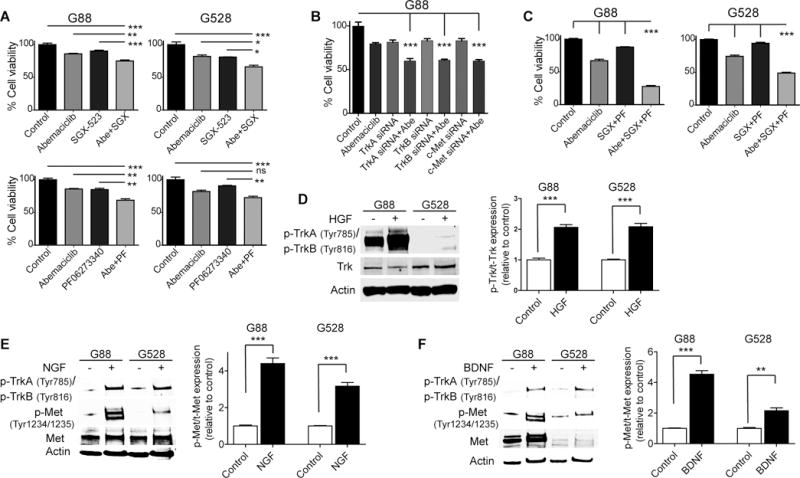
(A) The combination of abemaciclib (1.25 μM) and a specific c-Met inhibitor, SGX-523 (10 μM), or a pan-Trk inhibitor, PF-06273340 (10 μM), exhibits mild synergy against GICs (*P < 0.05; **P < 0.01; ***P < 0.001; ANOVA with post-hoc Tukey analysis). (B) The combination of abemaciclib (1.25 μM) and a specific siRNA for c-Met, TrkA, or TrkB exhibits mild synergy against G88 (***P < 0.001; ANOVA with post-hoc Tukey analysis). (C) Combining abemaciclib (1.25 μM) with both SGX-523 (5 μM) and PF-06273340 (5 μM) exhibits significant synergy, comparable to altiratinib (***P < 0.001; ANOVA with post-hoc Tukey analysis). (D) Exogenous HGF stimulates the Trk pathway, detected with an immunoblot using specific antibodies for Trk. (E–F) Both NGF and BDNF stimulate the c-Met pathway. Shown are immunoblots using specific antibodies for Trk and Met. (PF: PF-06273340, SGX: SGX-523). Protein expressions were quantitated and plotted (D–F) (**P < 0.01; ***P < 0.0001; two-tailed t-test). All values are mean ± SEM and from three biologically independent samples.
CDK4/6 inhibition upregulates HGF, NGF, and BDNF through activation of NF-κB
To elucidate the mechanism for the hyper-activation of the c-Met, TrkA, and TrkB pathways upon CDK4/6 inhibition, we studied the levels of the ligands specific to these pathways. Immunoblotting and mRNA analysis by qRT-PCR demonstrate that abemaciclib treatment significantly increased the levels of these ligands (Fig. 4A–B and Supplementary Fig. 7A). Furthermore, we demonstrated increased secretion of these ligands into conditioned cell culture media following abemaciclib treatment (Supplementary Fig. 7B). To identify the driver for abemaciclib-induced upregulation of HGF, NGF, and BDNF, we searched for a common regulator of these ligands. NF-κB is a conserved transcription factor that regulates crucial processes including the development and growth of cancer as well as treatment response (27). Several studies have shown that NF-κB is a central mediator of treatment resistance in various cancers, including GBM (27,28). HGF expression was shown to be correlated with the activity of NF-κB, indicating that HGF is one of the mediators of NF-κB-driven tumor growth and treatment resistance (29). Based on these, we hypothesized that abemaciclib treatment drives NF-κB-mediated upregulation of HGF, BDNF, and NGF, which in turn activate the c-Met, TrkA, and TrkB pathways, respectively. We showed with a luciferase reporter assay that abemaciclib treatment significantly induced the activity of NF-κB (Fig. 4C). We and others have shown previously that TNF-α treatment significantly activates NF-κB in GBM cells (18,30). To demonstrate the link between NF-κB and the ligands specific to the c-Met, TrkA, and TrkB pathways, we treated GICs with TNF-α and looked for the expression changes both at protein and mRNA levels. We showed that TNF-α treatment significantly upregulated HGF, NGF, and BDNF (Fig. 4D–E and Supplementary Fig. 8). To further validate that NF-κB is the mediator of abemaciclib-induced upregulation of these ligands, we knocked down NF-κB with a RELA-specific siRNA and examined the expression levels of the ligands. Figures 4F–G demonstrate that suppression of NF-κB significantly diminished the expression levels of the ligands upon abemaciclib treatment. Overall, our findings indicate that the expression levels of HGF, NGF, and BDNF are correlated with NF-κB activity and that NF-κB is the driver for abemaciclib-induced upregulation of these ligands. While we did not observe RelA binding sites in the vicinity of the HGF, NGF, and BDNF genes in the ENCODE dataset, they may have been missed or located further away. Alternatively, there may be indirect regulation of these sites by NF-κB; it is a strong driver of the transcription factor STAT3, and there are a number of STAT3-binding sites identified in ENCODE in the promoters of the HGF, NGF, and BDNF genes and/or nearby.
Figure 4. CDK4/6 inhibition drives NF-κB-mediated upregulation of NGF, BDNF, and HGF.
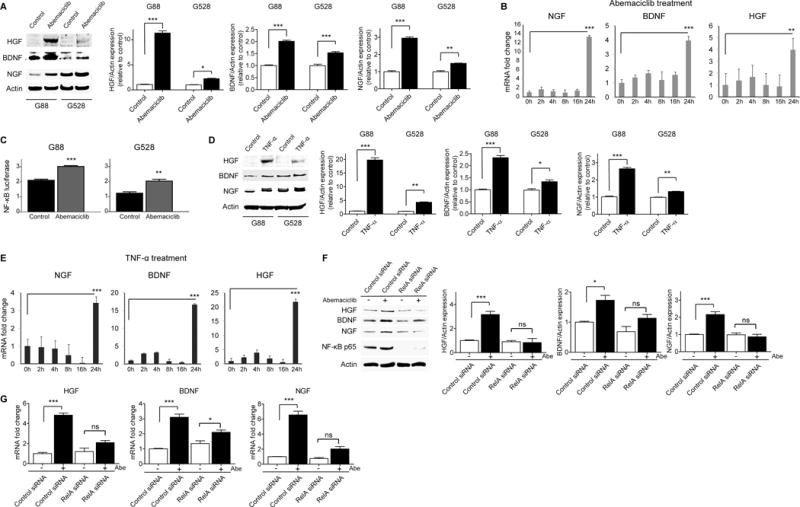
(A–B) Abemaciclib (1.5 μM) treatment upregulates NGF, BDNF, and HGF expression. Shown is an immunoblot using antibodies specific for NGF, BDNF, and HGF. Protein expressions were quantitated and plotted (*P < 0.05; **P < 0.01; ***P < 0.0001; two-tailed t-test). mRNA levels of NGF, BDNF, and HGF in G88 were detected with qRT-PCR following abemaciclib treatment at different time points (**P < 0.01; ***P < 0.001; two-tailed t-test). (C) Abemaciclib (1.5 μM) increases NF-κB activity detected with a luciferase reporter assay at 24 hours of treatment (**P < 0.01; ***P < 0.001; two-tailed t-test). (D–E) TNF-α (10 ng/ml) treatment upregulates NGF, BDNF, and HGF. Shown is an immunoblot using antibodies specific for NGF, BDNF, and HGF. Protein expressions were quantitated and plotted (*P < 0.05; **P < 0.01; ***P < 0.0001; two-tailed t-test). mRNA levels of NGF, BDNF, and HGF in G88 were detected with qRT-PCR following TNF-α treatment at different time points (***P < 0.001; two-tailed t-test). (F–G) Silencing NF-κB with a specific siRNA reverses the upregulation of NGF, BDNF, and HGF following abemaciclib (1.5 μM) treatment. Shown is an immunoblot using antibodies specific for NGF, BDNF, HGF, and NF-κB p65. Protein expressions were quantitated and plotted (*P < 0.05; ***P < 0.0001; two-tailed t-test). mRNA levels of NGF, BDNF, and HGF were detected with qRT-PCR following 24 hours of abemaciclib (1.5 μM) treatment in the presence of control and RELA siRNA (*P < 0.05; ***P < 0.0001; two-tailed t-test). All values are mean ± SEM and from three biologically independent samples.
The combination of CDK4/6 and c-Met/Trk inhibition is effective against an aggressive orthotopic GIC model in vivo
Next, we evaluated the efficacy of the abemaciclib and altiratinib combination in an orthotopic xenograft GBM model using two types of treatment regimens. GICs (G88 or G528) were stereotactically injected into the right striatum of six-to-eight-week-old female BALB/c SCID NCr mice. Following surgery, mice were randomized into 4 groups: control, altiratinib only, abemaciclib only, and the combined treatment. We tested alternating as well as simultaneous dosing of the two drugs, given the possibility that alternating dosing might have less toxicity and could have differential efficacy. With continuous treatment, mice were treated with vehicle, once-daily oral abemaciclib (50 mg/kg/day, six days a week), once-daily oral altiratinib (40 mg/kg/day, every day), or the combination of abemaciclib and altiratinib. With the alternating treatment, abemaciclib (75 mg/kg) and altiratinib (60 mg/kg) were given to the designated groups in a three days on and three days off alternating fashion. The combined treatment prolonged median and overall survival significantly in both treatment regimens tested (Fig. 5A–B). Surprisingly, despite the lower cumulative doses, combined treatment with the alternating regimen yielded comparable results to the continuous regimen. As a measure of toxicity, we followed mouse weights in each treatment group. As seen in Figure 5C, mouse weights were comparable across control and treatment regimens and no overt toxicity was observed from the individual or combined drug treatments. In addition, using mouse brain samples from these treatment experiments we recapitulated some of our in vitro findings on signaling effects of the individual drugs and combination (Fig. 5D–E). We also performed further biologic studies to preliminarily assess potential resistance mechanisms to this combination in vivo, conducting immunoblots for a number of oncogenic kinases with tumor samples from these experiments. Interestingly, phospho-PDGFRA was elevated upon treatment with the combination, though this did not occur with the single-drug treatments or vehicle (Supplementary Fig. 9). This suggests that PDGFRA activation may represent a potential escape mechanism to the abemaciclib/altiratinib combination, but one that is druggable. Overall, we have shown both in vitro and in vivo that dual inhibition of c-Met/Trk is able to overcome resistance to CDK4/6 inhibition, and that the combined treatment exhibits significant synergy against GICs.
Figure 5. In vivo efficacy of combined CDK4/6 and c-Met/Trk inhibition.
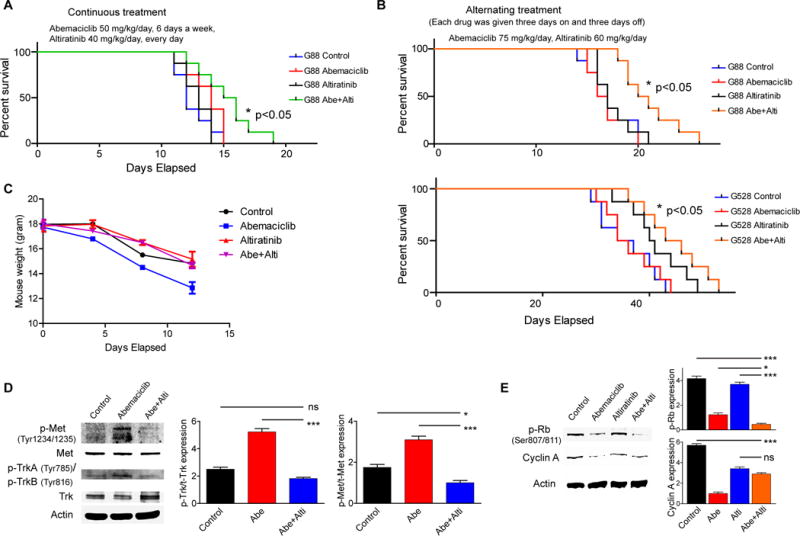
(A–B) Kaplan-Meier survival curves of mouse xenografts with two different treatment regimens. G88 or G528 GICs were stereotactically injected into the brains of mice. Mice were randomized into 4 groups: control, altiratinib only, abemaciclib only, and the combined treatment. The efficacy of the combined treatment in each regimen is comparable to each other and significantly higher than the individual treatments (*P < 0.05; n = 8 mice per cohort). (C) Comparison of mouse body weight in each treatment group. (D–E) In vivo modification of the targets of both abemaciclib and altiratinib. Shown are immunoblots using antibodies specific for c-Met, Trk, p-Rb, and Cyclin A. Protein expressions were quantitated and plotted (*P < 0.05; ***P < 0.001; one-way ANOVA with post-hoc Tukey analysis).
DISCUSSION
CDK4/6 inhibitors have been developed to block cell cycle progression and re-entry in rapidly dividing tumor cells. Considering the frequency of genetic and non-genetic abnormalities in the regulation of the cell cycle in GBM, CDK 4/6 inhibitors were thought to be highly promising against this aggressive tumor. However, ongoing trials are indicating that single-agent CDK4/6 inhibitors have inadequate efficacy against GBM (12). Potential limiting factors are their cytostatic nature and tumor adaptation, in particular the emergence of RB1-mutated resistant clones. This has elicited a search for strategies to overcome the resistance to CDK4/6 inhibitors in the form of combinatorial approaches. The combination of CDK4/6 inhibitors and anti-estrogenic therapies yielded significant tumor response in hormone-positive breast cancers (8). Early promising results from phase I/II trials in Ras-mutated melanoma and pancreatic cancer using the combination of CDK4/6 and MEK inhibitors (31,32) prompted further clinical trials (NCT02022982, NCT02065063). With respect to GBM, combination therapies using CDK4/6 inhibitors are showing improved preclinical efficacy, supporting further efforts to find stronger synergistic combinations (17).
RTKs are frequently hyperactivated in GBM and play crucial roles in the growth and maintenance of the malignant phenotype of GBM. Additionally, various RTKs are activated as an adaptive response to monotherapies, leading to the development of treatment-insensitive clones and tumor recurrence (33,34). We noted in CDK4/6 inhibitor-treated GBM cells that the c-Met and Trk pathways were significantly hyper-activated versus pre-treatment levels relative to other RTKs. c-Met is activated and amplified in GBM, and high c-Met activity has been implicated in tumor growth, treatment resistance, and recurrence in GBM and other cancers (6,35-38). The Trk pathway is particularly important for neuronal plasticity, survival and growth. It has also been implicated in the tumorigenesis of various cancers, including GBM (39,40). The Trk receptors are expressed in GBM, promote the maintenance of GICs, and boost treatment resistance in cooperation with other RTKs (40,41). We showed for the first time that the c-Met and Trk pathways transactivate each other in GBM to potentiate downstream signaling and promote CDK4/6 inhibitor resistance. The crosstalk among RTKs is a complex and dynamic process, enabling cancer cells to adapt to environmental insults such as chemotherapy. This adaptation process drives the activation of various RTKs when a specific RTK such as EGFR is targeted, leading to treatment resistance (42,43). Our findings demonstrate that RTK profiling is useful for the development of novel strategies to overcome these issues. We suggest employing an RTK profiling pre- and post-treatment that may serve as a crucial tool to identify novel adaptation mechanisms and help develop favorable combination therapies accordingly. Additionally, using a broad spectrum RTK inhibitor targeting multiple hyper-activated RTKs may help overcome resistance and increase efficacy.
One of the limitations of combination therapies is drug-induced toxicity, often requiring dose adjustments. Being a relatively new drug, altiratinib has no reported toxicity in preclinical models. Similarly, in this study we did not observe any major toxicity related to altiratinib even at high doses. On the other hand, CDK4/6 inhibitors may cause severe adverse effects such as thrombocytopenia, neutropenia, anemia, and fatigue (44,45). When used in combination therapies, these adverse effects may potentially be more pronounced. Anticipating a possible need for dose or schedule modification due to toxicity, we employed two different treatment regimens in orthotopic GBM models; the efficacy of the combined treatment in each model was comparable despite the lower cumulative dose used with the alternating regimen. Thus, an alternating treatment schedule can be tested in other cancer types and may help patients maintain quality-of-life without compromising efficacy against the tumor. Another important obstacle for GBM treatment is the blood-brain barrier (BBB). Many RTK inhibitors such as erlotinib and gefitinib are subject to efflux by active transporters within the BBB, leading to limited brain penetrance and low brain concentrations (46,47). In contrast, altiratinib was shown to have high brain penetration, making it an ideal choice to target both c-Met and Trk in primary and metastatic brain tumors (24). Similarly, abemaciclib has been shown to cross the BBB effectively (10-fold more than palbociclib), with cerebrospinal fluid concentrations being comparable to plasma concentrations (11), providing a further rationale for testing this combination in vivo against GBM.
We now know from clinical trials that monotherapies are typically insufficient to provide durable responses, necessitating the use of combination therapies. Our results suggest important points regarding more efficient treatment of GBM. Firstly, this work suggests testing the combination of abemaciclib and altiratinib in the clinic against GBM and potentially other cancers as well. Secondly, a phospho-RTK array can be used to identify the key drivers of resistance to design drug combinations accordingly. Lastly, due to the transactivation process and the inefficiency of the inhibition of a single pathway, broad-spectrum RTK inhibitors targeting multiple drivers of resistance should be favored over specific inhibitors of single RTKs when possible. Further studies will be necessary to validate the success of these strategies.
Supplementary Material
Statement of Significance.
CDK4/6 inhibition in glioblastoma activates the c-Met and TrkA-B pathways mediated by NF-κB and can be reversed by a dual c-Met/Trk inhibitor.
Acknowledgments
National Institutes of Health (NIH) grants 5R01CA180699, 1R01CA189524 (B. Purow), R01 NS045209 (R. Abounader), and R00 CA140774 (T. Abbas). M. Benamar is a recipient of the Farrow Fellowship.
Footnotes
Disclosure of Potential Conflicts of Interest: Authors declare no competing financial interests.
References
- 1.Hess KR, Broglio KR, Bondy ML. Adult glioma incidence trends in the United States, 1977-2000. Cancer. 2004;101(10):2293–9. doi: 10.1002/cncr.20621. [DOI] [PubMed] [Google Scholar]
- 2.Stupp R, Mason WP, van den Bent MJ, Weller M, Fisher B, Taphoorn MJ, et al. Radiotherapy plus concomitant and adjuvant temozolomide for glioblastoma. N Engl J Med. 2005;352(10):987–96. doi: 10.1056/NEJMoa043330. [DOI] [PubMed] [Google Scholar]
- 3.Singh SK, Hawkins C, Clarke ID, Squire JA, Bayani J, Hide T, et al. Identification of human brain tumour initiating cells. Nature. 2004;432(7015):396–401. doi: 10.1038/nature03128. [DOI] [PubMed] [Google Scholar]
- 4.Wei W, Shin YS, Xue M, Matsutani T, Masui K, Yang H, et al. Single-Cell Phosphoproteomics Resolves Adaptive Signaling Dynamics and Informs Targeted Combination Therapy in Glioblastoma. Cancer Cell. 2016;29(4):563–73. doi: 10.1016/j.ccell.2016.03.012. [DOI] [PMC free article] [PubMed] [Google Scholar]
- 5.Parsons DW, Jones S, Zhang X, Lin JC, Leary RJ, Angenendt P, et al. An integrated genomic analysis of human glioblastoma multiforme. Science. 2008;321(5897):1807–12. doi: 10.1126/science.1164382. [DOI] [PMC free article] [PubMed] [Google Scholar]
- 6.Cancer Genome Atlas Research N. Comprehensive genomic characterization defines human glioblastoma genes and core pathways. Nature. 2008;455(7216):1061–8. doi: 10.1038/nature07385. [DOI] [PMC free article] [PubMed] [Google Scholar]
- 7.Asghar U, Witkiewicz AK, Turner NC, Knudsen ES. The history and future of targeting cyclin-dependent kinases in cancer therapy. Nat Rev Drug Discov. 2015;14(2):130–46. doi: 10.1038/nrd4504. [DOI] [PMC free article] [PubMed] [Google Scholar]
- 8.Walker AJ, Wedam S, Amiri-Kordestani L, Bloomquist E, Tang S, Sridhara R, et al. FDA Approval of Palbociclib in Combination with Fulvestrant for the Treatment of Hormone Receptor-Positive, HER2-Negative Metastatic Breast Cancer. Clin Cancer Res. 2016;22(20):4968–72. doi: 10.1158/1078-0432.CCR-16-0493. [DOI] [PubMed] [Google Scholar]
- 9.Michaud K, Solomon DA, Oermann E, Kim JS, Zhong WZ, Prados MD, et al. Pharmacologic inhibition of cyclin-dependent kinases 4 and 6 arrests the growth of glioblastoma multiforme intracranial xenografts. Cancer Res. 2010;70(8):3228–38. doi: 10.1158/0008-5472.CAN-09-4559. [DOI] [PMC free article] [PubMed] [Google Scholar]
- 10.Barton KL, Misuraca K, Cordero F, Dobrikova E, Min HD, Gromeier M, et al. PD-0332991, a CDK4/6 inhibitor, significantly prolongs survival in a genetically engineered mouse model of brainstem glioma. PLoS One. 2013;8(10):e77639. doi: 10.1371/journal.pone.0077639. [DOI] [PMC free article] [PubMed] [Google Scholar]
- 11.Raub TJ, Wishart GN, Kulanthaivel P, Staton BA, Ajamie RT, Sawada GA, et al. Brain Exposure of Two Selective Dual CDK4 and CDK6 Inhibitors and the Antitumor Activity of CDK4 and CDK6 Inhibition in Combination with Temozolomide in an Intracranial Glioblastoma Xenograft. Drug Metab Dispos. 2015;43(9):1360–71. doi: 10.1124/dmd.114.062745. [DOI] [PubMed] [Google Scholar]
- 12.Wiedemeyer WR, Dunn IF, Quayle SN, Zhang J, Chheda MG, Dunn GP, et al. Pattern of retinoblastoma pathway inactivation dictates response to CDK4/6 inhibition in GBM. Proc Natl Acad Sci U S A. 2010;107(25):11501–6. doi: 10.1073/pnas.1001613107. [DOI] [PMC free article] [PubMed] [Google Scholar]
- 13.Dean JL, Thangavel C, McClendon AK, Reed CA, Knudsen ES. Therapeutic CDK4/6 inhibition in breast cancer: key mechanisms of response and failure. Oncogene. 2010;29(28):4018–32. doi: 10.1038/onc.2010.154. [DOI] [PubMed] [Google Scholar]
- 14.Brennan CW, Verhaak RG, McKenna A, Campos B, Noushmehr H, Salama SR, et al. The somatic genomic landscape of glioblastoma. Cell. 2013;155(2):462–77. doi: 10.1016/j.cell.2013.09.034. [DOI] [PMC free article] [PubMed] [Google Scholar]
- 15.Wen PY, Omuro A, Ahluwalia MS, Fathallah-Shaykh HM, Mohile N, Lager JJ, et al. Phase I dose-escalation study of the PI3K/mTOR inhibitor voxtalisib (SAR245409, XL765) plus temozolomide with or without radiotherapy in patients with high-grade glioma. Neuro Oncol. 2015;17(9):1275–83. doi: 10.1093/neuonc/nov083. [DOI] [PMC free article] [PubMed] [Google Scholar]
- 16.Little SE, Popov S, Jury A, Bax DA, Doey L, Al-Sarraj S, et al. Receptor tyrosine kinase genes amplified in glioblastoma exhibit a mutual exclusivity in variable proportions reflective of individual tumor heterogeneity. Cancer Res. 2012;72(7):1614–20. doi: 10.1158/0008-5472.CAN-11-4069. [DOI] [PubMed] [Google Scholar]
- 17.Olmez I, Brenneman B, Xiao A, Serbulea V, Benamar M, Zhang Y, et al. Combined CDK4/6 and mTOR inhibition is synergistic against glioblastoma via multiple mechanisms. Clin Cancer Res. 2017 doi: 10.1158/1078-0432.CCR-17-0803. [DOI] [PMC free article] [PubMed] [Google Scholar]
- 18.Olmez I, Love S, Xiao A, Manigat L, Randolph P, McKenna B, et al. Targeting the mesenchymal subtype in glioblastoma and other cancers via inhibition of diacylglycerol kinase alpha. Neuro-Oncology. 2017 doi: 10.1093/neuonc/nox119. [DOI] [PMC free article] [PubMed] [Google Scholar]
- 19.Li Z, Bao S, Wu Q, Wang H, Eyler C, Sathornsumetee S, et al. Hypoxia-inducible factors regulate tumorigenic capacity of glioma stem cells. Cancer Cell. 2009;15(6):501–13. doi: 10.1016/j.ccr.2009.03.018. [DOI] [PMC free article] [PubMed] [Google Scholar]
- 20.Olmez I, Shen W, McDonald H, Ozpolat B. Dedifferentiation of patient-derived glioblastoma multiforme cell lines results in a cancer stem cell-like state with mitogen-independent growth. J Cell Mol Med. 2015;19(6):1262–72. doi: 10.1111/jcmm.12479. [DOI] [PMC free article] [PubMed] [Google Scholar]
- 21.Chou TC. Drug combination studies and their synergy quantification using the Chou-Talalay method. Cancer Res. 2010;70(2):440–6. doi: 10.1158/0008-5472.CAN-09-1947. [DOI] [PubMed] [Google Scholar]
- 22.Fitzgerald JB, Schoeberl B, Nielsen UB, Sorger PK. Systems biology and combination therapy in the quest for clinical efficacy. Nat Chem Biol. 2006;2(9):458–66. doi: 10.1038/nchembio817. [DOI] [PubMed] [Google Scholar]
- 23.Piao Y, Park SY, Henry V, Smith BD, Tiao N, Flynn DL, et al. Novel MET/TIE2/VEGFR2 inhibitor altiratinib inhibits tumor growth and invasiveness in bevacizumab-resistant glioblastoma mouse models. Neuro Oncol. 2016;18(9):1230–41. doi: 10.1093/neuonc/now030. [DOI] [PMC free article] [PubMed] [Google Scholar]
- 24.Smith BD, Kaufman MD, Leary CB, Turner BA, Wise SC, Ahn YM, et al. Altiratinib Inhibits Tumor Growth, Invasion, Angiogenesis, and Microenvironment-Mediated Drug Resistance via Balanced Inhibition of MET, TIE2, and VEGFR2. Mol Cancer Ther. 2015;14(9):2023–34. doi: 10.1158/1535-7163.MCT-14-1105. [DOI] [PubMed] [Google Scholar]
- 25.Hu W, Sung T, Jessen BA, Thibault S, Finkelstein MB, Khan NK, et al. Mechanistic Investigation of Bone Marrow Suppression Associated with Palbociclib and its Differentiation from Cytotoxic Chemotherapies. Clin Cancer Res. 2016;22(8):2000–8. doi: 10.1158/1078-0432.CCR-15-1421. [DOI] [PubMed] [Google Scholar]
- 26.Wetzker R, Bohmer FD. Transactivation joins multiple tracks to the ERK/MAPK cascade. Nat Rev Mol Cell Biol. 2003;4(8):651–7. doi: 10.1038/nrm1173. [DOI] [PubMed] [Google Scholar]
- 27.Cahill KE, Morshed RA, Yamini B. Nuclear factor-kappaB in glioblastoma: insights into regulators and targeted therapy. Neuro Oncol. 2016;18(3):329–39. doi: 10.1093/neuonc/nov265. [DOI] [PMC free article] [PubMed] [Google Scholar]
- 28.Godwin P, Baird AM, Heavey S, Barr MP, O’Byrne KJ, Gately K. Targeting nuclear factor-kappa B to overcome resistance to chemotherapy. Front Oncol. 2013;3:120. doi: 10.3389/fonc.2013.00120. [DOI] [PMC free article] [PubMed] [Google Scholar]
- 29.Bigatto V, De Bacco F, Casanova E, Reato G, Lanzetti L, Isella C, et al. TNF-alpha promotes invasive growth through the MET signaling pathway. Mol Oncol. 2015;9(2):377–88. doi: 10.1016/j.molonc.2014.09.002. [DOI] [PMC free article] [PubMed] [Google Scholar]
- 30.Bhat KPL, Balasubramaniyan V, Vaillant B, Ezhilarasan R, Hummelink K, Hollingsworth F, et al. Mesenchymal differentiation mediated by NF-kappaB promotes radiation resistance in glioblastoma. Cancer Cell. 2013;24(3):331–46. doi: 10.1016/j.ccr.2013.08.001. [DOI] [PMC free article] [PubMed] [Google Scholar]
- 31.Franco J, Witkiewicz AK, Knudsen ES. CDK4/6 inhibitors have potent activity in combination with pathway selective therapeutic agents in models of pancreatic cancer. Oncotarget. 2014;5(15):6512–25. doi: 10.18632/oncotarget.2270. [DOI] [PMC free article] [PubMed] [Google Scholar]
- 32.Johnson DB, Puzanov I. Treatment of NRAS-mutant melanoma. Curr Treat Options Oncol. 2015;16(4):15. doi: 10.1007/s11864-015-0330-z. [DOI] [PMC free article] [PubMed] [Google Scholar]
- 33.Clark PA, Iida M, Treisman DM, Kalluri H, Ezhilan S, Zorniak M, et al. Activation of multiple ERBB family receptors mediates glioblastoma cancer stem-like cell resistance to EGFR-targeted inhibition. Neoplasia. 2012;14(5):420–8. doi: 10.1596/neo.12432. [DOI] [PMC free article] [PubMed] [Google Scholar]
- 34.Lal B, Xia S, Abounader R, Laterra J. Targeting the c-Met pathway potentiates glioblastoma responses to gamma-radiation. Clin Cancer Res. 2005;11(12):4479–86. doi: 10.1158/1078-0432.CCR-05-0166. [DOI] [PubMed] [Google Scholar]
- 35.Galimi F, Torti D, Sassi F, Isella C, Cora D, Gastaldi S, et al. Genetic and expression analysis of MET, MACC1, and HGF in metastatic colorectal cancer: response to met inhibition in patient xenografts and pathologic correlations. Clin Cancer Res. 2011;17(10):3146–56. doi: 10.1158/1078-0432.CCR-10-3377. [DOI] [PubMed] [Google Scholar]
- 36.Koochekpour S, Jeffers M, Rulong S, Taylor G, Klineberg E, Hudson EA, et al. Met and hepatocyte growth factor/scatter factor expression in human gliomas. Cancer Res. 1997;57(23):5391–8. [PubMed] [Google Scholar]
- 37.Joo KM, Jin J, Kim E, Ho Kim K, Kim Y, Gu Kang B, et al. MET signaling regulates glioblastoma stem cells. Cancer Res. 2012;72(15):3828–38. doi: 10.1158/0008-5472.CAN-11-3760. [DOI] [PubMed] [Google Scholar]
- 38.Boccaccio C, Comoglio PM. Invasive growth: a MET-driven genetic programme for cancer and stem cells. Nat Rev Cancer. 2006;6(8):637–45. doi: 10.1038/nrc1912. [DOI] [PubMed] [Google Scholar]
- 39.Akil H, Perraud A, Melin C, Jauberteau MO, Mathonnet M. Fine-tuning roles of endogenous brain-derived neurotrophic factor, TrkB and sortilin in colorectal cancer cell survival. PLoS One. 2011;6(9):e25097. doi: 10.1371/journal.pone.0025097. [DOI] [PMC free article] [PubMed] [Google Scholar]
- 40.Jawhari S, Bessette B, Hombourger S, Durand K, Lacroix A, Labrousse F, et al. Autophagy and TrkC/NT-3 signaling joined forces boost the hypoxic glioblastoma cell survival. Carcinogenesis. 2017;38(6):592–603. doi: 10.1093/carcin/bgx029. [DOI] [PubMed] [Google Scholar]
- 41.Lawn S, Krishna N, Pisklakova A, Qu X, Fenstermacher DA, Fournier M, et al. Neurotrophin signaling via TrkB and TrkC receptors promotes the growth of brain tumor-initiating cells. J Biol Chem. 2015;290(6):3814–24. doi: 10.1074/jbc.M114.599373. [DOI] [PMC free article] [PubMed] [Google Scholar]
- 42.Niederst MJ, Engelman JA. Bypass mechanisms of resistance to receptor tyrosine kinase inhibition in lung cancer. Sci Signal. 2013;6(294):re6. doi: 10.1126/scisignal.2004652. [DOI] [PMC free article] [PubMed] [Google Scholar]
- 43.McNeill RS, Canoutas DA, Stuhlmiller TJ, Dhruv HD, Irvin DM, Bash RE, et al. Combination therapy with potent PI3K and MAPK inhibitors overcomes adaptive kinome resistance to single agents in preclinical models of glioblastoma. Neuro Oncol. 2017 doi: 10.1093/neuonc/nox044. [DOI] [PMC free article] [PubMed] [Google Scholar]
- 44.Schwartz GK, LoRusso PM, Dickson MA, Randolph SS, Shaik MN, Wilner KD, et al. Phase I study of PD 0332991, a cyclin-dependent kinase inhibitor, administered in 3-week cycles (Schedule 2/1) Br J Cancer. 2011;104(12):1862–8. doi: 10.1038/bjc.2011.177. [DOI] [PMC free article] [PubMed] [Google Scholar]
- 45.Flaherty KT, Lorusso PM, Demichele A, Abramson VG, Courtney R, Randolph SS, et al. Phase I, dose-escalation trial of the oral cyclin-dependent kinase 4/6 inhibitor PD 0332991, administered using a 21-day schedule in patients with advanced cancer. Clin Cancer Res. 2012;18(2):568–76. doi: 10.1158/1078-0432.CCR-11-0509. [DOI] [PubMed] [Google Scholar]
- 46.McNeill RS, Vitucci M, Wu J, Miller CR. Contemporary murine models in preclinical astrocytoma drug development. Neuro Oncol. 2015;17(1):12–28. doi: 10.1093/neuonc/nou288. [DOI] [PMC free article] [PubMed] [Google Scholar]
- 47.Prados MD, Byron SA, Tran NL, Phillips JJ, Molinaro AM, Ligon KL, et al. Toward precision medicine in glioblastoma: the promise and the challenges. Neuro Oncol. 2015;17(8):1051–63. doi: 10.1093/neuonc/nov031. [DOI] [PMC free article] [PubMed] [Google Scholar]
Associated Data
This section collects any data citations, data availability statements, or supplementary materials included in this article.