Abstract
Ploidy abnormalities are a hallmark of human cancers, but their impact on the evolution and outcomes of cancers is unknown. Here, we identified whole-genome doubling (WGD) in the tumors of nearly 30% of 9,692 prospectively sequenced advanced cancer patients. WGD varied by tumor lineage and molecular subtype and arose early in the pathogenesis of affected cancers after an antecedent transforming driver mutation. While associated with TP53 mutations, 46% of all WGD arose in TP53-wildtype tumors and, in such cases, was associated with an E2F-mediated G1 arrest defect, though neither aberration was obligate in WGD tumors. The variability of WGD across cancer types can be explained in part by cancer cell proliferation rates. WGD predicted for increased risk of death in tumors pan-cancer, a negative impact independent of established clinical prognostic factors in multiple cancer types including KRAS-mutant colorectal cancers and estrogen receptor-positive breast cancers. WGD is one of the most common genomic events in cancer and is a macro-evolutionary event associated with poor prognosis across cancer types.
Introduction
Ploidy changes in tumor genomes are a hallmark of human cancer. Tetraploidization, the doubling of a complete set of diploid chromosomes, is one class of ploidy abnormality that results from a whole-genome doubling (WGD). WGD has been studied in both prokaryotic and eukaryotic species, where it has been viewed through an evolutionary lens whereby organisms that have undergone WGD have an advantage that allows them to outcompete their diploid progenitors1`. In normal human development, tetraploidization of the genome is rare in anything but germ cells during meiosis2.
In previous studies of cancer in model systems, WGD has been identified and thought to arise from underlying errors in cell division2, propagate due to a defective G1 checkpoint3, and contribute to a multitude of malignant phenotypes4. In human tumors, WGD has been identified incidentally as part of prior large-scale studies of DNA copy number alterations (CNAs)5,6 or as part of analyses defining the phylogenetics of disease evolution7. One challenge in studying WGD in solid tumors has been distinguishing a singular WGD event from what may be multiple successive and independent CNAs. This is compounded by the fact that WGD may be permissive of subsequent chromosomal aberrations and genomic instability8. Another challenge has been delineating the mutational correlates of WGD in a cohort of diverse cancer types of sufficient population size to draw robust inferences. Finally, due to the limited clinical outcomes data available for most large-scale genomic cohorts, little is known about the broader clinical significance of WGD beyond targeted cancer type-specific studies5,8,9. WGD is therefore a common but still cryptic event in human cancers, the evolution and clinical impact of which has not yet been broadly defined in both common and rare cancers.
We inferred WGD status from targeted clinical sequencing of several hundred cancer-associated genes in matched tumor and normal blood specimens acquired as part of a large prospective genomic profiling initiative, the primary goal of which was to inform the care of active cancer patients. Utilizing a computational framework, we developed a simulation-based metric to identify tumors of high ploidy due to a likely singular WGD event as distinct from those with a similar burden of genomic alterations acquired from independent and successive CNAs, all estimated from purity-corrected genome-wide integer copy number. Upon determining the likely presence or absence of WGD in the cancer genomes of 9,692 prospectively sequenced patients10, we sought to systematically assess its evolutionary impact, genomic associations, and prognostic significance in both common and rare cancers and evaluate whether the availability of such information could ultimately impact clinical management.
Results
Genome doubling is among the most common events in cancer
We identified the presence of genome doubling in the tumors of prospectively characterized advanced cancer patients using an analysis of allele-specific DNA copy number, which counts maternal and parental alleles based on the sequencing coverage and genotypes of germline single-nucleotide polymorphisms (Extended Data Fig. 1). In heterozygous regions of a diploid cancer genome there is one copy of each maternal and paternal allele. In a genome doubled tumor, however, the number of copies of the more frequent allele (major copy number, MCN) should be elevated across a substantial fraction of the cancer genome. We thus quantified the fraction of the autosomal tumor genome with a MCN of two or greater for all patients in the cohort and found that the distribution of this metric was bimodal, indicating two distinct groups of cancers exist irrespective of cancer type (Fig. 1A). A considerable number of tumors had 50% or more of their autosomal tumor genome with a somatic MCN of two or more, and were therefore classified as having undergone WGD. While we could not exclude the possibility that individual tumors had acquired this copy number genotype via successive and independently arising genomic gains of equal copy number, we modeled this scenario by simulating thousands of cancer genomes by randomly selecting 22 autosomes from WGD-negative and positive tumors alike and were unable to reconstruct a tumor genome with an equal or greater copy number genotype in WGD-negative cases as determined by this threshold (Extended Data Fig. 2). To confirm WGD inferred from hybrid-capture targeted clinical sequencing was representative of what can be achieved with broader-scale sequencing, we generated matched whole-exome sequencing data on the tumor/normal specimens of 149 patients in this cohort. WGD was concordant in 147 cases (99%), confirming the robustness of our analytical inference of WGD in targeting sequencing data. Finally, because WGD is called from allele-specific copy number inference independent of the somatic mutational data11, we used mutant allele fractions to assess the accuracy of our calls in WGD-positive genomes where alternative WGD-negative solutions existed. We examined how well these two opposing solutions explained the observed mutant allele fractions of somatic mutations in balanced tetraploid regions of the affected genomes, and confirmed the WGD-positive solutions were consistent with mutant allele fractions corresponding to 1 and 2 copies of 4 total (after and before WGD respectively; Extended Data Fig. 3).
Figure 1. The prevalence of genome doubling in advanced cancers.
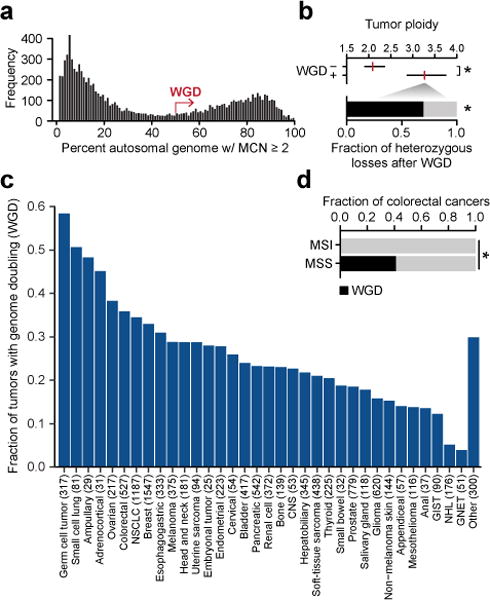
a) The bimodal distribution of the fraction of autosomal genome with a major copy number of two or greater in the prospectively characterized cohort (not shown, specimens of largely copy-neutral genomes with <2% MCN of two or greater). b) At top is the median (red) and IQR of ploidy among cases with and without WGD (n=2833 and 7511, respectively; p-value<10−16, two-sided Mann-Whitney U test). At bottom is the fraction of large-scale heterozygous losses that molecular timing analysis indicates arose after WGD (p-value=2.7×10−68, two-sided Chi-squared test after adjusting for doubled genome content). c) The prevalence of WGD by cancer type (NSCLC, non-small cell lung cancer; CNS, central nervous system; GIST, gastrointestinal stromal tumor; GNET, gastrointestinal neuroendocrine tumor; NHL, non-hodgkin lymphoma). d) The prevalence of WGD in colorectal cancers as a function of their microsatellite status (MSS, microsatellite stable; MSI, microsatellite instability; n=430 and 72, respectively; p-value = 1.8×10⁻¹¹, two-sided Chi-squared test).
In total, 28.2% of cancer patients had tumors that underwent WGD (Extended Data Tables 1–2). Notably, this rate of WGD was similar to that of a second orthogonal cohort of whole-exome sequencing data from 6,184 primary untreated tumors generated by The Cancer Genome Atlas (http://cancergenome.nih.gov/; 31%, see Methods). In our cohort, WGD was one of the most common molecular abnormalities in human cancers, second only to TP53 mutations (39% of patients affected) in its prevalence. WGD was more than twice as common as oncogenic KRAS mutations and TERT promoter mutations (~13% each), the next most common molecular aberrations. The median ploidy of tumors having undergone WGD was 3.3 (interquartile range [IQR], 2.9-3.8) compared to 2.1 in tumors lacking WGD (IQR, 1.9-2.4; p-value<10−16, Mann-Whitney U test) (Fig. 1B). As most WGD-positive tumors had sub-tetraploid genomes, we sought to time the emergence of broad single-copy losses relative to WGD in the pathogenesis of these tumors. Of 73,545 total arm- and chromosome-length heterozygous losses in WGD-positive tumors, ~70% arose after the WGD event (p-value=2.7×10−68, Chi-squared test after adjusting for doubled genome content), reflecting how such tumor cells tolerate a multitude of large-scale losses after WGD to evolve more stable sub-tetraploid tumor genomes8 (Fig. 1B).
The rate of WGD varied markedly by cancer type, affecting 58% of germ cell tumors versus only 5% or fewer non-hodgkin lymphomas and gastrointestinal neuroendocrine tumors (Fig. 1C). WGD was also associated with histologically distinct subtypes of disease. For instance, papillary thyroid tumors had little evidence of WGD, consistent with their oncogene-driven but otherwise quiet genomes12. Conversely, 46% of all Hurthle cell thyroid cancers underwent WGD (Extended Data Fig. 4). WGD rates also varied in molecularly distinct subtypes of disease. For example, while 36% of all colorectal cancers underwent WGD, WGD arose exclusively in microsatellite stable (MSS) tumors (p-value=1.8×10⁻¹¹, Chi-squared; Fig. 1D). This pattern was also evident in other cancer types with frequent microsatellite instability (MSI) including endometrial cancers and stomach adenocarcinomas. In total, zero of 110 tumors with microsatellite instability (MSI) confirmed by conventional immunohistochemistry and orthogonally verified from sequencing data (Extended Data Fig. 5) underwent WGD (p-value=4.2×10⁻¹³, Chi-squared). Given the remodeling of cancer genomes after WGD via large-scale heterozygous losses (Fig. 1B), the absence of WGD in MSI tumors may be due to negative selection in tumors cells against acquiring the likely deleterious presence of both events.
Genomic correlates of genome doubling
Given the rate and variability of WGD across cancer types, we sought to determine whether an association existed between specific genetic lesions and WGD. We first assessed whether tetraploidization was associated with an increased accrual of somatic mutations, either through having more DNA content to mutate, or because high ploidy buffers tumors against the possible deleterious effect of higher mutational burden13,14. Whereas the ploidy-corrected mutational rate of WGD-positive and negative tumors within individual cancer types was approximately constant, the total mutational load of WGD-positive tumors was significantly higher than WGD-negative tumors (Extended Data Fig. 6). We next explored the association between WGD and TP53, as intact p53 is thought to prevent genome-doubled cells from re-entering the cell cycle and proliferating15. Consistent with these data, we found that WGD was nearly twice as common in TP53-mutant tumors (1.8 fold; p-value=7.2×10−77, Chi-squared test), an association that varied by lineage (Fig. 2A). Nevertheless, 21% of all TP53-wildtype tumors still underwent WGD, which represents nearly half (46%) of all the WGD observed here.
Figure 2. Genome correlates of genome doubling.
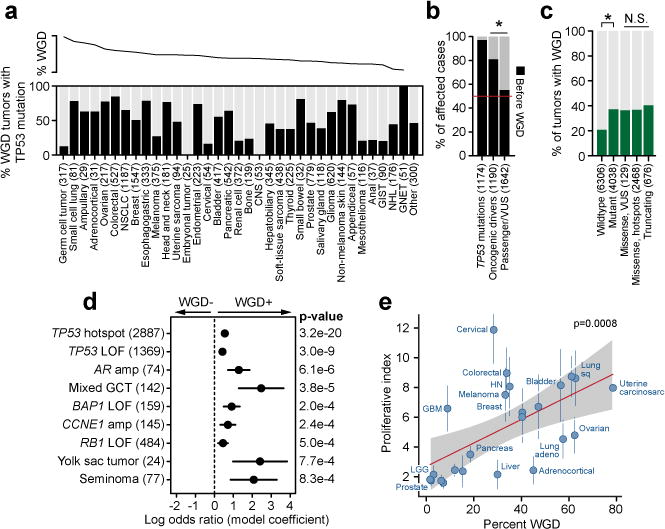
a) At top is the percent of cases with WGD by cancer type, as sorted in panel 1a. At bottom is the percent of WGD-positive tumors in each cancer type that also possess a TP53 mutation. b) The percent of WGD-positive cases in which TP53 mutations, other oncogenic driver mutations, or presumed passenger mutations or variants of unknown significance preceded the WGD event (number of samples per class indicated in parentheses; asterisk p-value=4×10−39, two-sided Chi-squared test). c) The rate of WGD in cases with different TP53 genotypes, from wildtype to mutant and among different classes of mutations (number of samples per class indicated in parentheses). Asterisk reflects statistical significance (p-value=7.2×10−77, two-sided Chi-squared test). N.S. denotes not significant (p-values ranging from 0.10 to 0.98). d) The statistically significant associations (nominal p-value < 0.001) with WGD across the cohort as assessed by a multivariable regression model. Error bars on the model coefficients (log odds ratio) are plus/minus two times the standard error, number of samples per variable indicated in parentheses. e) The correlation between the rate of WGD and the median proliferative index inferred from DNA and RNA sequencing of the same specimens in 24 cancer types from TCGA. Vertical lines represent the MAD of the proliferative index, red line is Spearman correlation (p-value as indicated), and shaded area is the 95% prediction interval. For clarity, cancer types shown but not labeled include endometrial, esophageal, renal cell, renal papillary, sarcoma, stomach, and thyroid.
To understand the temporal relationship between TP53 mutations and WGD, we timed the emergence of these events in the molecular pathogenesis of affected tumors using sequencing data (see Methods and Extended Data Fig. 7). Chronologically, WGD arose after functional TP53 mutations in 97.3% of the patients in which these two events could be unambiguously timed (1142 of 1174 in total, Fig. 2B), a result consistent with prior estimates16. To test this association in tumors where the TP53 mutation was unequivocally the first molecular event, we examined the tumor genomes of Li-Fraumeni syndrome patients harboring pathogenic germline mutations in TP53 among 3,136 patients in this cohort who consented for germline analysis of cancer predisposition genes as part of their somatic mutational profiling. Notably, all such patients had tumors with large-scale ploidy defects, with 75% (6 of 8) having undergone WGD. In patients with WGD-positive tumors, other known oncogenic driver mutations17 similarly preceded WGD in 81.1% of such cases, but this was only true 57.8% of the time for non-hotspot mutations of unknown significance (p-value=4×10−39, Chi-squared test; Fig. 2B). Moreover, while WGD was associated with and followed TP53 mutations, the incidence of WGD did not vary as a function of the type of TP53 dysfunction. WGD arose at a similar frequency in tumors with TP53 mutations that were missense variants of unknown significance, missense likely dominant-negative, or truncating loss-of-function (Fig. 2C). These findings indicate that while WGD likely arises early in the pathogenesis of many cancers, it typically follows earlier arising transforming mutational events in TP53 and other cancer genes, though TP53 dysfunction is not an obligate event for WGD.
To explore additional potential genotypic associations with WGD, particularly in tumors that lack a TP53 alteration, we constructed a multivariable logistic regression model adjusted for cancer type and the presence of other mutations and CNAs. WGD was significantly associated with multiple histologies of germ cell tumors (mixed histology, yolk sac tumors, seminomas, and embryonal carcinomas, p-values of 10−5 to 0.002, Wald test; Fig. 2D), a result consistent with germ cells doubling their genomes prior to meiotic divisions. As expected, this model predicts that TP53 hotspot mutations increase the odds of a tumor undergoing WGD by a factor of 1.75 (Fig. 2D and Extended Data Table 3). Curiously, focal amplifications of MDM2, which inhibits wildtype p53, were detected in 3.5% of tumors and were mutually exclusive with TP53 mutations (p-value=1.4×10−38, Fisher’s exact test), but were not associated with WGD in the multivariable model (p-value=0.65, Wald test). Moreover, after adjusting for TP53 status and cancer type, we found no association between WGD and somatic mutations in APC, LATS1, and AURKA, genes previously speculated to be associated with tetraploidization within and across cancer types2. Whereas telomere dysfunction-dependent tetraploidization has been studied extensively2,18, there was also no association between WGD and TERT promoter mutations in this prospective cohort or with telomere length in retrospectively characterized tumors of the TCGA19 (see Methods and Extended Data Fig. 8).
Several other recurrent alterations were independently associated with WGD (nominal p-value<0.001, Wald test) after adjusting for cancer type and other alterations. Among these were amplifications of CCNE1, and loss-of-function mutations in RB1 and BAP1. CCNE1 amplifications have been previously associated with WGD6, and were associated with WGD here independent of cancer type and TP53 status. RB1 loss was also strongly associated with WGD after adjusting for TP53 status and cancer type (Fig. 2D). While previously associated with chromosomal aberrations, a role for RB1 loss in genome doubling has only been speculated2. As these findings imply that multiple aberrations converge on a defect in G1 arrest of the cell cycle, it was notable that focal CCND1 amplifications were also modestly associated with WGD (Extended Data Table 3), a result consistent with experimental data showing that Cyclin D1 over-expression in TP53-wildtype cancer cells renders them permissive for WGD20. Interestingly, CDK4 amplifications (2.4% of all cases) that likewise inhibit RB1 and therefore E2F-mediated G1 were not associated with WGD (p-value=0.66, Wald test). A limited number of functionally non-redundant genomic aberrations, therefore, are associated with WGD and converge on the E2F-mediated G1 arrest in both TP53-mutant and TP53-wildtype tumors. This conclusion is further supported by the association between WGD and BAP1 mutations (p-value=0.0002, Wald test), the loss of which has been linked to mitotic progression and chromosome instability21 as well as G1 arrest via E2F target gene regulation22. Overall, 31.8% of TP53-wildtype WGD-positive tumors harbored a defect in an effector of E2F-mediated G1 arrest (Extended Data Fig. 9). To verify that cancer type was not a major driver of these associations, we repeated the model after having left out individual cancer types in which key lesions are common. In this subsequent analysis, there was no change in their association or lack thereof with WGD, indicating that our results reflect fundamental genotypic associations with WGD independent of cancer type.
Taken together, these results indicate that WGD does not result from a clear antecedent aberrant genetic alteration, but instead results from errors in cell division and that WGD-positive tumor cells with a defect in G1 arrest more readily propagate. This model predicts that cancer types with greater rates of cell turnover would have greater rates of WGD. To test this hypothesis, we used RNA sequencing to calculate a proliferative index23 for each tumor of 24 cancer types (TCGA) for which we had already inferred the presence of absence of WGD (see Methods). We found that while the rate of WGD in these cancer types was not correlated with the total number of divisions of normal stem cells in these tissues24 (rho=0, p-value=1, Spearman), WGD was strongly correlated with the median proliferative index (rho=0.65, p-value=0.0008, Spearman; Fig. 2E). In fact, the variable rate of proliferation in different tumor lineages can explain 42% of the variability we observed in WGD rates across cancer types (Fig. 1C).
Genome doubling predicts worse overall survival pan-cancer
This cohort is comprised of cancer patients for whom prospective clinical sequencing was performed to guide treatment decisions for the management of advanced and metastatic disease. Detailed characteristics of this cohort have been previously described25. The characteristics of this cohort afforded the opportunity to assess the clinical implications of WGD in the setting of advanced disease. We first explored the effect of WGD on prognosis across the entire cohort and found that it predicted for worse overall survival pan-cancer (hazard ratio, 1.3; 95% CI, 1.2 to 1.4; p-value=3.9×10⁻⁷, LRT; Fig. 3A). After adjusting for cancer type, age, and TP53 mutational status, WGD remained significantly associated with decreased overall survival pan-cancer (hazard ratio, 1.18; 95% CI, 1.08 to 1.32; p-value=0.0005, Wald test).
Figure 3. Genome doubling and outcome.
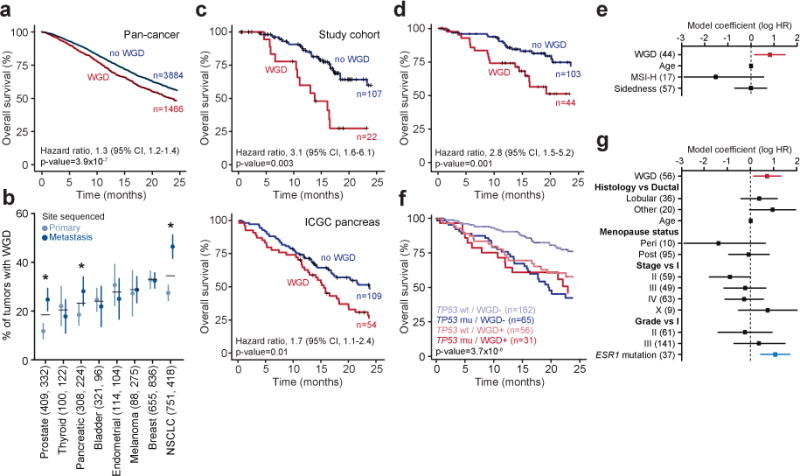
a) The presence of WGD in the genomes of advanced cancers was associated with worse overall survival (statistics as indicated). b) The prevalence of WGD in primary and metastatic tumors of multiple cancer types (number of primary and metastatic samples indicated in parentheses, error bars are the binomial confidence intervals, asterisks indicate statistical significance as determined by a two-sided Fisher’s exact test, p-value=1.3×10⁻⁴, 0.042, and 8.1×10⁻⁶ for prostate, pancreas, and NSCLC, respectively). c) While significantly more common in metastatic pancreas cancers (panel b), WGD in primary pancreas cancers was associated with worse prognosis in our study cohort even after adjusting for age and both resection and TP53 mutational status (top; statistics as indicated, LRT p-value) as well as in an independent cohort of surgically resected primary pancreas cancers from the International Cancer Genome Consortium (bottom; statistics as indicated, LRT p-value). d-e) The presence of WGD in the tumor genomes of patients with KRAS-mutant colorectal cancers was associated with worse overall survival (statistics as indicated, LRT p-value), including in a multi-variable model (panel e) with known prognostic variables including age at diagnosis, microsatellite status, and right versus left-sided disease (number of samples per variable indicated in parentheses). f-g) Tumor-specific WGD in patients with HR-positive/HER2-negative TP53-wildtype breast cancers was associated with worse overall survival (shown is the LRT p-value for the four classes included in panel (f) including in a multi-variable model (panel g) of prognostic variables at breast cancer diagnosis as well as ESR1 mutations (number of samples per variable indicated in parentheses).
Another unique characteristic of this cohort was the inclusion of not only primary tumors from patients with advanced disease, but also metastatic samples in a subset of cases. In total, 42% of samples analyzed here were obtained from metastatic tumors. To control for potential confounding of overall survival based on whether the sample sequenced was a primary tumor versus metastasis, we sought to establish whether WGD was observed more commonly in metastatic compared to primary tumor samples. Adjusting for TP53 mutation status, WGD was no more common in metastatic than in primary tumors in the majority of cancer types, demonstrating that the negative prognostic effect of WGD could not be explained solely by its enrichment in metastatic samples (Extended Data Fig. 10). WGD was, however, significantly more common in non-small cell lung, pancreatic, and prostate cancer metastases (Fig. 3B). In prostate cancers, we validated that WGD was far more prevalent in prostate cancer metastases than in primary tumors in an independent cohort of ~1,000 prostate cancers for which both whole-exome sequencing and detailed clinical data were available (46 and 6%, respectively; p-value=3×10−47, Chi-squared test)26. When present in the primary prostate cancers of our prospectively sequenced cohort (14% of 797 patients), WGD was associated with high-risk rather than low or intermediate-risk Gleason grade (p-value=7.3×10⁻⁷, Chi-squared test; Extended Data Fig. 11). As WGD is associated with the subsequent acquisition of large-scale CNAs (Fig. 1B), this result may explain, in part, the association between increasing burden of CNAs with biochemical recurrence and metastasis in patients with prostate cancer27,28. Similarly, in pancreatic cancers where WGD is significantly more common in metastatic tumors, WGD in primary adenocarcinomas was associated with worse prognosis (hazard ratio, 3.1; 95% CI, 1.6 to 6.1; p-value=0.003, LRT) (Fig. 3C), an association with higher-risk disease that we replicated in an independent cohort of surgically resected primary pancreatic adenocarcinomas of the International Cancer Genome Consortium (Fig. 3C).
As WGD was prognostic for overall survival even in patients with incurable cancer, we hypothesized that WGD would have clinical significance independent of established prognostic factors in cancer types in which patients have heterogeneous clinical outcomes even in the setting of established metastatic disease. We therefore curated detailed clinical data for two of the most prevalent cancer types with such clinical heterogeneity: KRAS-mutant colorectal cancers29 and estrogen receptor (ER)-positive HER2-negative breast cancers30,31. We found that KRAS-mutant colorectal cancers that underwent WGD had a significantly worse prognosis than did KRAS-mutant cancers that lacked this event (hazard ratio, 2.8; 95% CI, 1.5 to 5.2; p-value=0.001, LRT), even after adjusting for other variables prognostic at metastasis including age at diagnosis, microsatellite status, and right versus left-sided disease (hazard ratio, 2.3; 95% CI, 1.2 to 4.4; p-value=0.015, Wald test; Fig. 3D-E). Another common cancer type with substantial clinical heterogeneity in advanced-stage patients is the 70% of breast cancers that are estrogen receptor (ER)-positive and HER2-negative. While WGD was not associated with outcome in TP53-mutant ER-positive, HER2-negative breast cancers, WGD was significantly associated with worse prognosis in TP53-wildtype patients (hazard ratio, 2.0; 95% CI, 1.2 to 3.3; p-value=0.01, LRT; Fig. 3F), even after adjusting for clinical features prognostic at breast cancer diagnosis (hazard ratio, 2.1; 95% CI, 1.1 to 3.7; p-value=0.016, Wald test). Notably, WGD had an effect size similar to ESR1 mutations, which emerge in patients previously treated with anti-hormonal therapy32,33 (Fig. 3G). In both the ER-positive, HER2-negative breast and the KRAS-mutant colorectal cancers, a quantitative measure of the overall burden of genomic alteration in these tumors (the fraction of the autosomal tumor genome bearing CNAs of any kind) was not significantly associated with survival. This finding suggests that WGD, rather than the chromosomal aberrations that follow, is the basis for these prognostic differences.
Discussion
Here, we establish WGD as among the most prevalent singular genomic aberrations in human cancer. WGD does not appear to have an obligate antecedent genetic basis. Our analysis instead supports an evolutionary model whereby WGD emerges early in the pathogenesis of affected cancers, but after a preceding oncogenic driver mutation. Such lesions include those that lead to either TP53 dysfunction, or in TP53-wildtype tumors, an E2F-mediated G1 arrest defect. These lesions increase the likelihood of, but are not required for, a tumor to undergo WGD. Nevertheless, a model in which WGD arises early after a preceding oncogenic event that initially transforms the cell is consistent with data indicating that spontaneous tetraploidization of non-transformed human cells is rare. Overall, the data is consistent with an earlier transforming lesion establishing a permissive environment for the proliferation of cancer cells that subsequently undergo a genome doubling after stochastic errors in cell division.
Our findings have important implications for understanding the molecular pathogenesis and therapeutic management of human cancers. WGD is a macro-evolutionary step in affected cancers and tumors having undergone WGD evolve sub-tetraploid genomes via an increased burden of subsequent large-scale single-copy losses. These CNAs arise later in the molecular pathogenesis of affected cases, implying that WGD may serve as a precursor of the subclonal diversification of CNAs that has recently been shown to be associated with poor outcomes in lung adenocarcinoma patients7. Indeed, the increased prevalence of WGD we observed in metastatic specimens of some cancer types, rather than arising late in the evolution of these tumors and contributing to the transition to metastatic disease, may reflect an early event that when present indicates a more aggressive subset of primary disease with worse prognosis (as in prostate and pancreas cancers).
Clinically, WGD is associated with adverse survival pan-cancer in patients with advanced disease and in cancers with heterogeneous clinical outcomes even following the development of metastasis. The ability of WGD to identify poor prognosis primary tumors, as in the case of the pancreas cancers profiled here (Fig. 3C), could inform the design of new adjuvant trials in specific populations of high-risk patients. Key questions about how 1) prior therapy impacts the prognostic impact of WGD, 2) WGD contributes to better or worse9 response to targeted, systemic, or immuno-therapies, and 3) WGD may lead to unique therapeutic vulnerabilities and whether this is due to the WGD event itself or the subsequent evolution of genomic aberrations will require further clinical and functional investigation. At present, even within the context of the prospective sequencing of cancer patients from which our cohort was drawn, the presence of WGD is not being reported to clinicians.
Overall, prognostics in advanced disease is an under-studied area, despite considerable clinical variability among late-stage patients of multiple cancer types. In some instances, prognostic biomarkers may mature into valuable predictive biomarkers. However, for these to inform clinical management at the point of care, they must be captured from current clinical molecular testing methodologies. In the case of WGD, concurrent sequencing of matched normal specimens from cancer patients is essential for its robust detection. This underscores the need for simultaneous sequencing of tumor and matched normal specimens from patients to not only facilitate integrated reporting of germline and somatic findings that simplifies the clinical workflow and hastens the speed of molecular testing, but also inform clinical care beyond the presence of sensitizing therapeutic biomarkers. Indeed, our analysis of WGD was performed in prospectively characterized cancer patients using clinical sequencing data, the results of which could be practice changing if evidence-based guidelines can be established for the use of this information to inform clinical decision making.
Online Methods
Study cohort and prospective sequencing
The study cohort was comprised of 9,692 advanced cancer patients diagnosed with one of 55 principle tumor types who were enrolled onto an institutional IRB-approved research protocol (NCT01775072) at Memorial Sloan Kettering Cancer Center (MSKCC) between January 2014 and November 2016 (Extended Data Table 1–2). In compliance with ethical regulations, all patients provided written informed consent, and this study was conducted with the approval of the MSKCC Institutional Review Board. Details regarding patient consent, sample acquisition, sequencing, mutational analysis, and clinical reporting were previously described10. Briefly, prospective sequencing of matched tumor and blood specimens was performed using MSK-IMPACT, a custom hybridization capture-based next-generation sequencing assay approved for clinical use in New York state10,34. This study cohort included patients whose tumors were sequenced with one of three incrementally larger versions of the MSK-IMPACT assay (containing 341, 410, and 468 genes respectively).
Allele-specific DNA copy number analysis
Estimates of tumor purity and ploidy as well as genome-wide total, allele-specific, and integer DNA copy number were inferred from sequencing data using the FACETS algorithm (version 0.3.9)11. We utilized a two-pass implementation whereby a low-sensitivity run (cval=100) first determined the purity and tumor-normal log-ratio corresponding to the diploid state. Gene-level segmentation and integer copy number calls were inferred from a subsequent run with higher sensitivity for focal events (cval=50). These calls were used to time mutations and CNAs relative to WGD, while homozygous deletion and focal amplification calls obtained using the MSK-IMPACT analytical protocol10 were used to model the probability of WGD arising in a given sample. Tumors were considered to have undergone WGD if greater than 50% of their autosomal genome had a major copy number (the more frequent allele in a given segment, MCN) greater than or equal to two. To evaluate the robustness of this metric, we simulated 1000 pseudo-cancer genomes constructed from randomly sampling 22 autosomes from subsets of WGD-negative and WGD-positive samples (see Extended Data Fig. 2). Tumor specimens with less than 2% of their autosomal genome having an MCN greater than or equal to 2 were excluded as copy-neutral from this simulation, as were tumor samples with tumor-normal log-ratio values (FACETS dipLogR) falling in the outermost deciles of the WGD-negative and WGD-positive subsets.
We performed FACETS and WGD analysis of an independent cohort of 6,184 primary untreated tumors from 26 tumor types in The Cancer Genome Atlas (Extended Data Table 1) using the procedure described above to ensure cross-comparability. The overall rate of WGD in this cohort was 31%, which was similar to the rate measured in our prospective cohort. This estimate is slightly lower than previous analyses of TCGA data5,6, due primarily to the different composition of cancer types in our cohort, followed by the more conservative threshold we implement here to call WGD. Considering only the same distribution of cancer types of prior large-scale copy number analyses6, then our estimate of the rate of WGD in our prospective cohort rises to 31%. Similarly, if we relax our threshold for WGD to 40% of the genome having an MCN greater than or equal to two, our estimate of WGD pan-cancer rises to 33% in the prospective cohort. Telomere length was utilized as previously determined19. The Cancer Genome Atlas research network data was retrieved through dbGaP authorization accession number phs000178.v9.p8.
Mutation timing analysis
Somatic mutations were timed relative to WGD using a methodology adapted from prior work16. Specifically, we inferred a cancer cell fraction (CCF) for all somatic mutations in all tumor samples from variant allele fractions (VAF) using a binomial distribution and maximum likelihood (ML) estimation, normalized to produce posterior probabilities. Mutations were classified as clonal if the upper bound of the 95% CI for the CCF was greater than or equal to 0.95 or if Pr(CCF > 0.95) was greater than 0.95. All other mutations were classified as arising subclonally. The expected number of copies for a given mutation is a function of VAF, local copy number (TCN), and tumor purity (Φ) and is given by:
The relative timing of mutations was determined using the most parsimonious explanation of an observed copy number state. Rather than utilizing discretized allelic copy number, we instead tested whether the point estimate of mutant copies was greater than 1. For example, a mutation in a region with TCN of 4 and MCN of 2 was regarded as a single mutation arising before WGD as opposed to multiple independent but identical mutations affecting different alleles at the same locus arising after WGD. Therefore, clonal mutations in which TCN and MCN were both 2 were classified as arising before WGD. In regions with TCN ≥ 3, clonal mutations with an expected copy number of greater than 1 were classified as arising before WGD. Clonal mutations in regions with TCN equal to 3 and an expected copy number of less than or equal to 1 were classified as ambiguous and excluded from timing analyses because we could not differentiate between 1) a mutation arising before WGD followed by a single-copy loss of the mutant copy after WGD and 2) a single-copy loss after WGD followed by a mutation. Finally, all other clonal mutations were classified as having arisen before WGD, and all subclonal mutations were classified as having arisen after WGD. Our analysis of single-copy losses relative to WGD compared regions with a TCN and MCN of 3 and 2 respectively (i.e., a loss after WGD) versus those regions with a TCN and MCN of 2 and 2 respectively (i.e., a loss before WGD). Regions affected by multiple copy number losses after WGD were not considered in our analysis. Known and likely driver mutations were those mutational hotspots identified by previous methods17 or those alleles whose functional and clinical significance has been curated by the OncoKB Knowledgebase (http://www.oncokb.org/). All non-hotspot missense mutations were classified as putative passenger mutations or variants of unknown significance. In comparing rates of WGD between classes of TP53 mutations (i.e., hotspot vs. truncating), we excluded the subset of samples which harbored variants from both classes. The timing analysis of TP53 mutations considered only hotspots and loss-of-function mutations (nonsense mutations, splice site mutations, and frameshift insertions and deletions). Overall, 64.4% of all hotspot mutations in oncogenes and 71.2% of all hotspot or loss-of-function mutations in tumor suppressor genes qualified as unambiguously timed and were utilized for the timing analysis.
Multivariable regression model associations with WGD
To explore the genomic correlates of WGD, we modeled the probability of WGD using multivariable logistic regression. Somatic mutations and focal CNAs observed 20 or more times in the prospective cohort in one of the 341 genes sequenced in all patients were included in our final model and were coded as binary predictor variables. Overall, we considered hotspot mutations; major copy number amplifications; and loss-of-function (LOF) events combining nonsense and splice site mutations, frameshift insertions and deletions, and homozygous deletions. Cancer subtypes were also included in the final model. Variance inflation factors were used to detect multicollinearity arising from correlated predictor variables. To avoid testing mutually dependent observations, amplifications targeting FGF19, FGF4, HIST1H3B, and IKBKE were removed due to their proximities to other commonly co-amplified genes in affected cases.
Microsatellite instability
Microsatellite instability (MSI) was determined in colorectal, endometrial, and stomach adenocarcinomas using MSIsensor, an orthogonal bioinformatic approach to identify MSI based on the percentage of microsatellite loci that are unstable in a tumor genome compared to its matched normal specimen. Tumors with an MSIsensor score greater than or equal to 10 were classified as MSI-positive. This MSIsensor score threshold had a validation rate of 99.4% when compared to conventional IHC testing in a cohort of 180 tumors for which both measures were available (only a single discordant case called MSI by MSIsensor was equivocal by IHC; A. Zehir, personal communication).
Correlation of WGD with proliferative index
Gene expression was quantified from RNA sequencing of 10,535 tumor specimens from TCGA using Kallisto v0.42.435 and canonical isoforms per gene based on Uniprot annotations (https://github.com/mskcc/vcf2maf/blob/v1.6.13/data/isoform_overrides_uniprot). After filtering to the subset of these specimens for which we had performed WGD inference from exome sequencing data, we derived the proliferative index scores for all samples from the median expression of the top 1% of genes correlated with the PCNA proliferation marker in a cohort of normal tissues as previously described23,36.
Statistical analysis
Associations between WGD and both clinico-pathological and genomic features were assessed using Pearson’s chi-squared, Fisher’s exact, and Wilcoxon tests as well as multivariable logistic regression. In comparing rates of WGD between primary and metastatic samples, we restricted our analysis to include only the first metastatic sample per patient. To ensure sufficient statistical power for detecting true associations in the context of our multivariable logistic regression model, our analysis satisfied the established minimum number of events per variable (EPV) criteria37. Only those covariates with a minimum of N=10*k/p affected samples were included in the analysis, where k is the number of covariates and p is the proportion of cases in the population being analyzed (~0.3 in this study). This corresponds to a minimum of 30 mutational events present to be included as a covariate in our model for a total of 268 covariates and a suggested N of approximately 9,000 cases, which is less than the 9,692 cases analysis here. Key negative associations were all present in a number of tumors far greater than the EPV in this study cohort and were present in sufficient numbers to have from 80% to >99% power to detect small effect sizes among individual associations (Cohen’s h=0.2 to 0.35).
Univariate and multivariate survival analyses were performed using Cox proportional hazards regression and displayed using Kaplan-Meier methods. Overall survival in days was the difference between the date of procedure from which prospective sequencing was performed to the date of last follow-up. Only patients whose date of sequencing was less than one year from the date of their procedure were included in outcome analyses (Extended Data Table 2). P-values for survival analyses were obtained using the likelihood ratio test (LRT) or Wald test for the multivariable analyses. All analysis was performed using the R environment for statistical computing, and all figures were generated using R ggplot2.
URLs
cBioPortal for Cancer Genomics, http://cbioportal.org/; The Cancer Genome Atlas (http://cancergenome.nih.gov/; OncoKB Knowledgebase (http://www.oncokb.org/) Uniprot annotations (https://github.com/mskcc/vcf2maf/blob/v1.6.13/data/isoform_overrides_uniprot)
Data Availability
All primary genomic results and associated specimen annotation for all patients in this study are accessible as described for the original cohort (ref. 10) and were deposited into the cBioPortal for Cancer Genomics for analysis and visualization at http://cbioportal.org/msk-impact.
Code Availability
The source code for all analyses in this study and the associated allelic data can be found at https://github.com/taylor-lab/GD.
Extended Data
Extended Data Figure 1. WGD inference from targeted capture and deep sequencing.
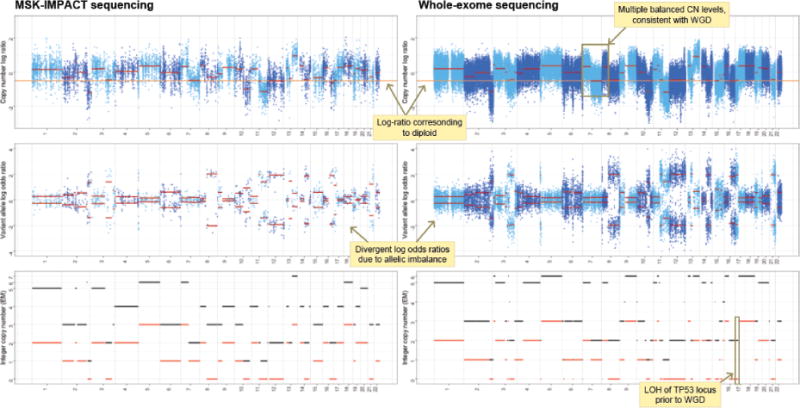
Total (top), allele-specific (middle), and integer (bottom) DNA copy number segmentation (red) in a single tumor and matched blood normal from a patient with a TP53-mutant uterine leiomyosarcoma profiled by MSK-IMPACT (left) as well as by whole-exome sequencing (right) indicating their concordance and how WGD was inferred cohort-wide.
Extended Data Figure 2. Modeling WGD in simulated cancer genomes.
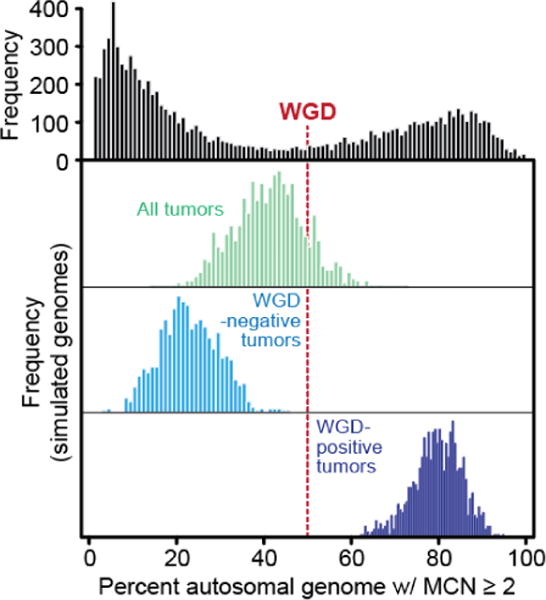
At top is the fraction of autosomal tumor genome with a major copy number (MCN) greater than or equal to two, as in panel A of figure 1 in the main text. In red is the threshold used to determine genome doubling. In green are 1000 simulated cancer genomes constructed from randomly sampling 22 autosomes from all samples in the cohort indicated the majority are weighted to WGD-negative samples. Light and dark blue are same simulations (as in green) repeated but only from randomly sampling either WGD-negative and WGD-positives cases respectively, indicating the inability to simulate a WGD-positive genome (having greater than or equal to 50% of the genome with MCN of two or greater) from chromosomal aberrations drawn from WGD-negative cases.
Extended Data Figure 3. Assessing WGD-positive FACETS solutions.
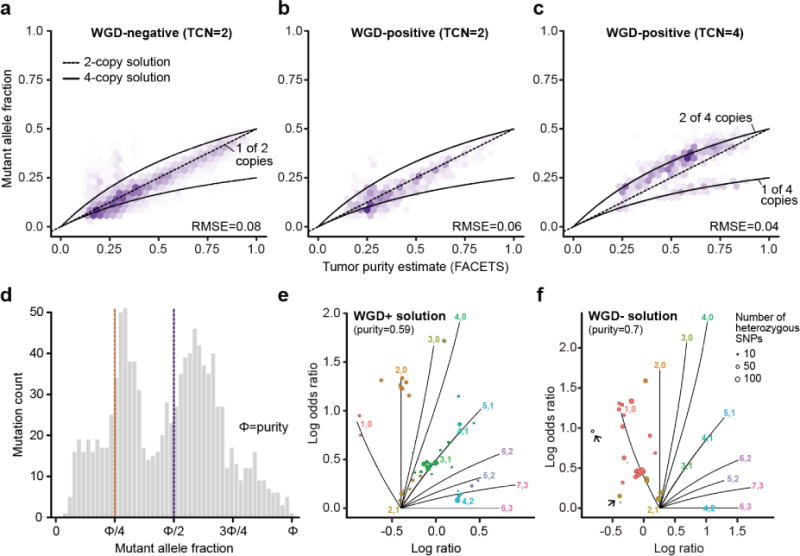
The top row shows the distribution of observed mutant allele fractions for somatic mutations in balanced regions of the genome with a) total copy number (TCN) of 2 in WGD-negative samples, b) TCN of 2 in WGD-positive tumors, and c) TCN of 4 in WGD-positive tumors. Predicted values for 2-copy and 4-copy solutions are indicated with dashed and solid lines respectively. d) The distribution of mutant allele fractions for somatic mutations in balanced regions of the subset of WGD-positive tumors with an alternative WGD-negative solution. The peak located at approximately 0.25*purity is consistent with 1 mutant allele out of 4 total copies under the WGD-positive solution. e) A representative FACETS segmentation profile for an individual tumor with a WGD-positive solution, and f) its alternative WGD-negative solution. Problematic segments (those with either no copy number assignment or those that imply multiple tumor-normal log-ratios associated with diploidy) are highlighted (arrows) indicating the alternative WGD-negative solution fits the segmentation data less well than does the WGD-positive fit.
Extended Data Figure 4. Thyroid cancer type-specific rates of WGD.
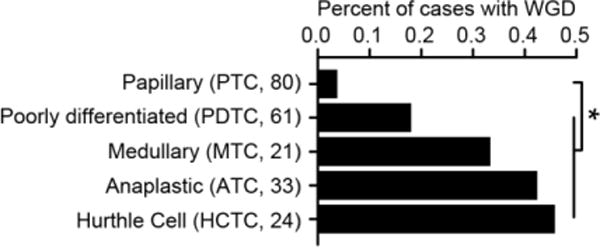
The percent of different thyroid cancer subtypes (sample sizes indicated in parentheses) that have undergone WGD. Asterisks reflect statistically significant differences (two-sided Fisher’s exact test; p-value=0.02, 0.002, 4.2×10⁻⁵, and 7,9×10⁻⁵ for PTC versus PDTC, MTC, ATC, and HCTC, respectively).
Extended Data Figure 5. WGD and microsatellite instability.
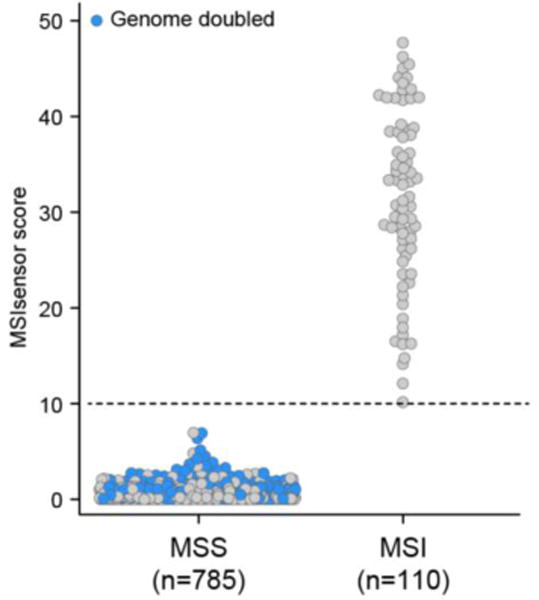
The microsatellite status of colorectal cancers, endometrial cancers, and stomach adenocarcinomas in this cohort according to their MSIsensor score38, as described in Supplementary Methods. Tumors that underwent WGD are annotated in blue; dotted line corresponds to the threshold for MSI positivity.
Extended Data Figure 6. WGD and mutational burden.
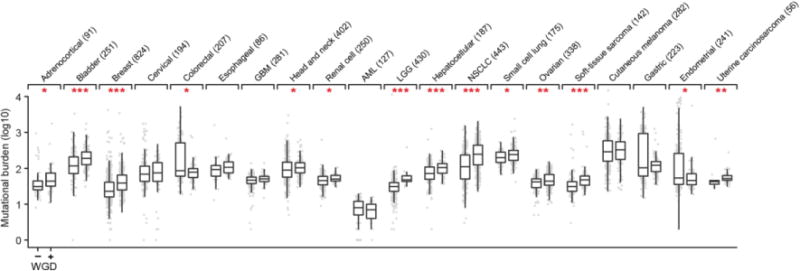
Somatic mutational burden (point mutations and small insertions and deletions) in tumors with and without WGD in each of 20 cancer types with 20 or more WGD-positive specimens (sample sizes indicated in parentheses). All box plots represent the minimum, first quartile, median, third quartile, and maximum values (outliers detected using the standard 1.5*IQR method) within a given cancer type. Asterisks reflect statistically significant differences within cancer types (nominal p-value < 0.05, two-sided Wilcoxon test; one, two and three asterisks correspond to p-values between 0.01 and 0.05, 0.001 and 0.01, and less than 0.001 respectively). Data utilized here is from whole-exome sequencing from specimens in The Cancer Genome Atlas (TCGA) that are of cancer types overlapping with those included in our prospective cohort. TCGA data was utilized for its increased power to determine mutational burden.
Extended Data Figure 7. Timing the chronology of mutations relative to WGD.
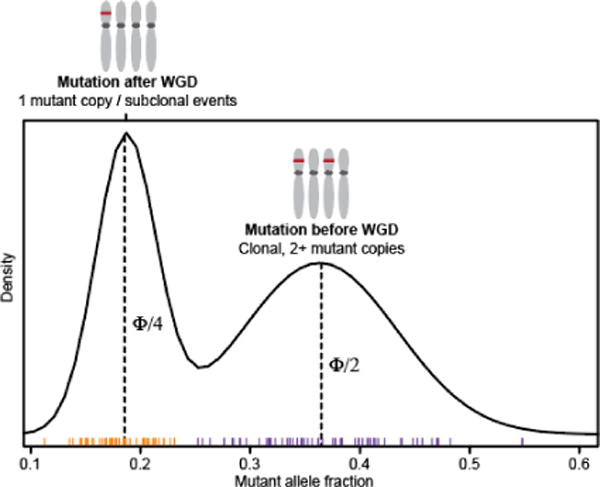
Schematic representation of the timing of mutations relative to WGD in affected cases.
Extended Data Figure 8. WGD and telomere length.
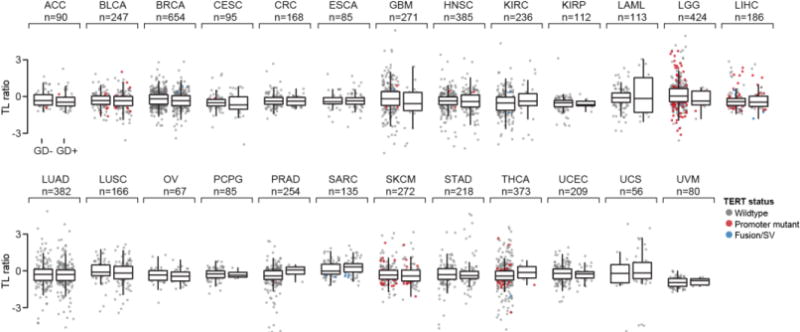
Telomere length (TL ratio is matching tumor over normal samples) as a function of WGD status in 25 cancer types. TL was inferred from either high or low-pass whole-genome sequencing or from whole-exome sequencing data from The Cancer Genome Atlas19. All box plots represent the minimum, first quartile, median, third quartile, and maximum values (outliers detected using the standard 1.5*IQR method) within a given cancer type. Individual samples are dots that are colored based on TERT status (when available; wildtype, those harboring a known TERT promoter mutation, or TERT rearrangements).
Extended Data Figure 9. Genomic alterations in TP53-wildtype WGD-positive tumors.
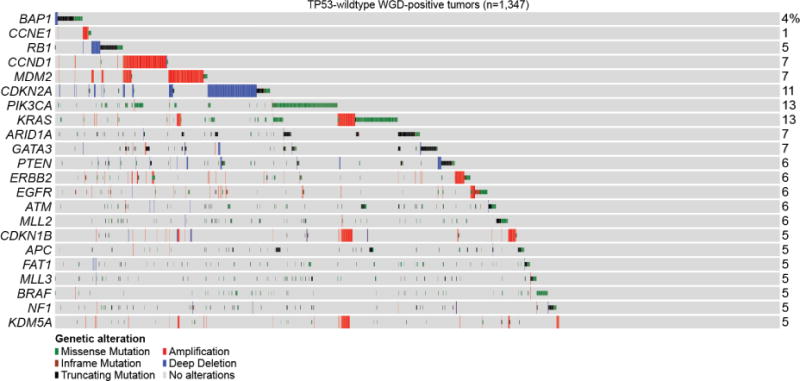
The most common genomic alterations in the 1,347 TP53-wildtype WGD-positive tumors are shown including key effectors of E2F-mediated G1 arrest, which account for 31.8% of such tumors (15% when including only those covariates identified as significant in our model, see Methods). Alteration types are indicated by the legend (bottom).
Extended Data Figure 10. WGD in primary and metastatic cancers.
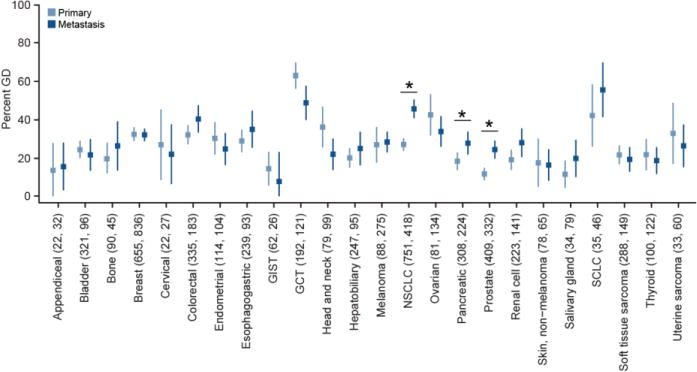
The rate of WGD in primary and metastatic samples in the indicated cancer types in the prospective cohort is shown (number of primary and metastatic samples indicated in parentheses; error bars are the binomial confidence intervals). Asterisks reflect statistically significant differences as in Fig. 3b.
Extended Data Figure 11. WGD and Gleason grade in primary prostate cancers.
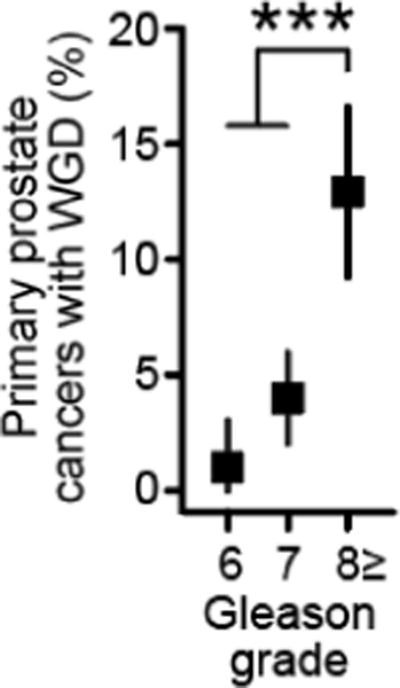
The rate of WGD in 797 primary prostate cancers as a function of Gleason grade (n=97, 375, and 325 for Gleason grades 6, 7, 8+, respectively). Error bars are the binomial confidence intervals. Asterisks reflect statistical significance (p-value=7.3×10⁻⁷, two-sided Chi-squared test).
Extended Data Table 1. Study cohort.
Prospectively sequenced samples in each of 55 cancer types studied here and the corresponding TCGA validation data when available.
| Cancer Type | Detailed Cancer Types | Patients (N) | Validation (N) |
|---|---|---|---|
| Adrenocortical Carcinoma | 2 | 31 | 91 |
| Ampullary Carcinoma | 2 | 29 | - |
| Anal Cancer | 2 | 37 | - |
| Appendiceal Cancer | 4 | 57 | - |
| Bladder Cancer | 11 | 417 | 251 |
| Bone Cancer | 13 | 139 | - |
| Breast Cancer | 12 | 1547 | 824 |
| Breast Sarcoma | 1 | 5 | - |
| CNS Cancer | 9 | 53 | - |
| Cancer of Unknown Primary | 8 | 178 | - |
| Cervical Cancer | 11 | 54 | 194 |
| Colorectal Cancer | 6 | 527 | 207 |
| Embryonal Tumor | 4 | 25 | - |
| Endometrial Cancer | 11 | 223 | 297 |
| Esophagogastric Cancer | 9 | 333 | 309 |
| Gastrointestinal Neuroendocrine Tumor | 6 | 51 | - |
| Gastrointestinal Stromal Tumor | 1 | 90 | - |
| Germ Cell Tumor | 10 | 317 | - |
| Gestational Trophoblastic Disease | 2 | 6 | - |
| Glioma | 17 | 620 | 711 |
| Head and Neck Cancer | 13 | 181 | 402 |
| Hepatobiliary Cancer | 9 | 345 | 187 |
| Histiocytosis | 3 | 18 | - |
| Hodgkin Lymphoma | 2 | 5 | - |
| Leukemia | 2 | 2 | 127 |
| Mastocytosis | 1 | 1 | - |
| Melanoma | 13 | 375 | 362 |
| Mesothelioma | 6 | 116 | - |
| Miscellaneous Brain Tumor | 3 | 8 | - |
| Miscellaneous Neuroepithelial Tumor | 4 | 6 | 85 |
| Multiple Myeloma | 1 | 1 | - |
| Nerve Sheath Tumor | 5 | 17 | - |
| Non-Hodgkin Lymphoma | 15 | 176 | - |
| Non-Small Cell Lung Cancer | 14 | 1187 | 618 |
| Ovarian Cancer | 13 | 217 | 338 |
| Pancreatic Cancer | 10 | 542 | 27 |
| Penile Cancer | 2 | 9 | - |
| Pheochromocytoma | 1 | 4 | - |
| Pineal Tumor | 1 | 3 | - |
| Prostate Cancer | 3 | 779 | 258 |
| Renal Cell Carcinoma | 13 | 372 | 362 |
| Retinoblastoma | 1 | 7 | - |
| Salivary Gland Cancer | 9 | 118 | - |
| Sellar Tumor | 4 | 6 | - |
| Sex Cord Stromal Tumor | 4 | 19 | - |
| Skin Cancer, Non-Melanoma | 10 | 144 | - |
| Small Bowel Cancer | 3 | 32 | - |
| Small Cell Lung Cancer | 2 | 81 | - |
| Soft Tissue Sarcoma | 35 | 438 | 142 |
| Thymic Tumor | 2 | 14 | - |
| Thyroid Cancer | 6 | 225 | 379 |
| Unannotated | 2 | 53 | 13 |
| Uterine Sarcoma | 11 | 94 | - |
| Vaginal Cancer | 1 | 3 | - |
| Wilms Tumor | 2 | 7 | - |
Extended Data Table 3. Results from multivariable model of association with WGD.
Full results from the multivariable regression model of WGD associations (nominal p-value<0.05).
| Variable (n) | Estimate | Std. Error | Z-score | OR | P-value |
|---|---|---|---|---|---|
| TP53_hotspot (2887) | 0.56 | 0.06 | 9.21 | 1.75 | 3.21E−20 |
| TP53_lof (1369) | 0.42 | 0.07 | 5.93 | 1.52 | 3.00E−09 |
| AR_amp (74) | 1.29 | 0.29 | 4.52 | 3.63 | 6.09E−06 |
| Germ Cell Tumor | Mixed Germ Cell Tumor (142) | 2.47 | 0.60 | 4.12 | 11.84 | 3.76E−05 |
| BAP1_lof (159) | 0.79 | 0.21 | 3.72 | 2.21 | 0.0002 |
| CCNE1_amp (145) | 0.72 | 0.20 | 3.67 | 2.06 | 0.0002 |
| RB1_lof (484) | 0.45 | 0.13 | 3.48 | 1.56 | 0.0005 |
| (Intercept) | −1.97 | 0.57 | −3.46 | 0.14 | 0.0005 |
| Germ Cell Tumor | Yolk Sac Tumor (24) | 2.43 | 0.72 | 3.36 | 11.33 | 0.0008 |
| Germ Cell Tumor | Seminoma (77) | 2.08 | 0.62 | 3.34 | 8.00 | 0.0008 |
| Germ Cell Tumor | Embryonal Carcinoma (21) | 2.27 | 0.73 | 3.11 | 9.73 | 0.0019 |
| FGFR3_hotspot (97) | −1.19 | 0.41 | −2.87 | 0.30 | 0.0041 |
| ABL1_lof (31) | −2.17 | 0.80 | −2.71 | 0.11 | 0.0067 |
| CCND1_amp (350) | 0.73 | 0.27 | 2.69 | 2.08 | 0.0071 |
| FOXA1_lof (57) | 0.77 | 0.31 | 2.49 | 2.16 | 0.0127 |
| Hurthle Cell Thyroid Cancer (24) | 1.67 | 0.72 | 2.32 | 5.29 | 0.0205 |
| BCL2L1_amp (54) | 1.06 | 0.46 | 2.32 | 2.89 | 0.0206 |
| MAP2K4_lof (90) | −0.63 | 0.28 | −2.28 | 0.53 | 0.0229 |
| CDKN1A_lof (52) | 0.75 | 0.35 | 2.15 | 2.12 | 0.0316 |
| RBM10_lof (137) | −0.50 | 0.23 | −2.13 | 0.61 | 0.0330 |
| PARK2_lof (40) | −1.11 | 0.52 | −2.13 | 0.33 | 0.0335 |
| PRDM1_lof (50) | 0.73 | 0.35 | 2.09 | 2.08 | 0.0366 |
| PAK7_lof (35) | 0.80 | 0.39 | 2.07 | 2.22 | 0.0382 |
| TGFBR2_lof (65) | −0.77 | 0.37 | −2.07 | 0.47 | 0.0383 |
| Germ Cell Tumor | Rare histologies (25) | 1.47 | 0.71 | 2.07 | 4.33 | 0.0385 |
| NOTCH2_lof (65) | 0.65 | 0.32 | 2.07 | 1.92 | 0.0388 |
| PDCD1_lof (44) | 0.78 | 0.39 | 2.01 | 2.17 | 0.0441 |
| FUBP1_lof (55) | −1.51 | 0.75 | −2.01 | 0.22 | 0.0443 |
| BRIP1_amp (64) | 0.78 | 0.39 | 1.98 | 2.17 | 0.0480 |
| Adrenocortical Carcinoma (30) | 1.35 | 0.68 | 1.97 | 3.85 | 0.0487 |
Supplementary Material
All patients analyzed here annotated for their cancer type, specimen type, WGD status, and available clinical outcome information.
Acknowledgments
We thank our patients and their families for participating in this study and members of the Taylor lab and Marie-Josée and Henry R. Kravis Center for Molecular Oncology for discussions and support. We also thank V. Balachandran and the Avner Pancreatic Cancer Foundation for assistance with ICGC pancreas sequencing and clinical data. This work was supported by National Institutes of Health awards P30 CA008748, U54 OD020355 (D.B.S, B.S.T), R01 CA207244 (D.M.H., B.S.T), R01 CA204749 (B.S.T); and the American Cancer Society, Cycle for Survival, Sontag Foundation, Prostate Cancer Foundation, and the Josie Robertson Foundation (B.S.T).
Footnotes
Author Contributions
C.M.B. and B.S.T. conceived the study. C.M.B., A.V.P., M.T.A.D., M.T.C., P.J., C.B., M.F.B. and B.S.T. designed and performed data analysis. A.Z., W.C., J.A., A.M.S, P.R., G.I., M.E.R., Z.K.S., N.S., J.B., D.B.S, and D.M.H. assisted with prospective genomic and clinical data collection and sample annotation. C.M.B. and B.S.T. wrote the manuscript with input from all authors.
Competing financial interests
The authors declare no competing financial interests.
References
- 1.Van de Peer Y, Mizrachi E, Marchal K. The evolutionary significance of polyploidy. Nat Rev Genet. 2017;18:411–424. doi: 10.1038/nrg.2017.26. [DOI] [PubMed] [Google Scholar]
- 2.Davoli T, de Lange T. The causes and consequences of polyploidy in normal development and cancer. Annu Rev Cell Dev Biol. 2011;27:585–610. doi: 10.1146/annurev-cellbio-092910-154234. [DOI] [PubMed] [Google Scholar]
- 3.Storchova Z, Pellman D. From polyploidy to aneuploidy, genome instability and cancer. Nat Rev Mol Cell Biol. 2004;5:45–54. doi: 10.1038/nrm1276. [DOI] [PubMed] [Google Scholar]
- 4.Fujiwara T, et al. Cytokinesis failure generating tetraploids promotes tumorigenesis in p53-null cells. Nature. 2005;437:1043–7. doi: 10.1038/nature04217. [DOI] [PubMed] [Google Scholar]
- 5.Carter SL, et al. Absolute quantification of somatic DNA alterations in human cancer. Nature biotechnology. 2012;30:413–21. doi: 10.1038/nbt.2203. [DOI] [PMC free article] [PubMed] [Google Scholar]
- 6.Zack TI, et al. Pan-cancer patterns of somatic copy number alteration. Nat Genet. 2013;45:1134–40. doi: 10.1038/ng.2760. [DOI] [PMC free article] [PubMed] [Google Scholar]
- 7.Jamal-Hanjani M, et al. Tracking the Evolution of Non-Small-Cell Lung Cancer. N Engl J Med. 2017 doi: 10.1056/NEJMoa1616288. [DOI] [PubMed] [Google Scholar]
- 8.Dewhurst SM, et al. Tolerance of whole-genome doubling propagates chromosomal instability and accelerates cancer genome evolution. Cancer Discov. 2014;4:175–85. doi: 10.1158/2159-8290.CD-13-0285. [DOI] [PMC free article] [PubMed] [Google Scholar]
- 9.Kuznetsova AY, et al. Chromosomal instability, tolerance of mitotic errors and multidrug resistance are promoted by tetraploidization in human cells. Cell Cycle. 2015;14:2810–20. doi: 10.1080/15384101.2015.1068482. [DOI] [PMC free article] [PubMed] [Google Scholar]
- 10.Zehir A, et al. Mutational landscape of metastatic cancer revealed from prospective clinical sequencing of 10,000 patients. Nat Med. 2017 doi: 10.1038/nm.4333. [DOI] [PMC free article] [PubMed] [Google Scholar]
- 11.Shen R, Seshan VE. FACETS: allele-specific copy number and clonal heterogeneity analysis tool for high-throughput DNA sequencing. Nucleic Acids Res. 2016;44:e131. doi: 10.1093/nar/gkw520. [DOI] [PMC free article] [PubMed] [Google Scholar]
- 12.Cancer Genome Atlas Research, N. Integrated genomic characterization of papillary thyroid carcinoma. Cell. 2014;159:676–90. doi: 10.1016/j.cell.2014.09.050. [DOI] [PMC free article] [PubMed] [Google Scholar]
- 13.Semon M, Wolfe KH. Consequences of genome duplication. Curr Opin Genet Dev. 2007;17:505–12. doi: 10.1016/j.gde.2007.09.007. [DOI] [PubMed] [Google Scholar]
- 14.Thompson DA, Desai MM, Murray AW. Ploidy controls the success of mutators and nature of mutations during budding yeast evolution. Curr Biol. 2006;16:1581–90. doi: 10.1016/j.cub.2006.06.070. [DOI] [PubMed] [Google Scholar]
- 15.Aylon Y, Oren M. p53: guardian of ploidy. Mol Oncol. 2011;5:315–23. doi: 10.1016/j.molonc.2011.07.007. [DOI] [PMC free article] [PubMed] [Google Scholar]
- 16.McGranahan N, et al. Clonal status of actionable driver events and the timing of mutational processes in cancer evolution. Sci Transl Med. 2015;7:283ra54. doi: 10.1126/scitranslmed.aaa1408. [DOI] [PMC free article] [PubMed] [Google Scholar]
- 17.Chang MT, et al. Identifying recurrent mutations in cancer reveals widespread lineage diversity and mutational specificity. Nat Biotechnol. 2016;34:155–63. doi: 10.1038/nbt.3391. [DOI] [PMC free article] [PubMed] [Google Scholar]
- 18.Davoli T, de Lange T. Telomere-driven tetraploidization occurs in human cells undergoing crisis and promotes transformation of mouse cells. Cancer Cell. 2012;21:765–76. doi: 10.1016/j.ccr.2012.03.044. [DOI] [PMC free article] [PubMed] [Google Scholar]
- 19.Barthel FP, et al. Systematic analysis of telomere length and somatic alterations in 31 cancer types. Nat Genet. 2017;49:349–357. doi: 10.1038/ng.3781. [DOI] [PMC free article] [PubMed] [Google Scholar]
- 20.Crockford A, et al. Cyclin D mediates tolerance of genome-doubling in cancers with functional p53. Ann Oncol. 2017;28:149–156. doi: 10.1093/annonc/mdw612. [DOI] [PMC free article] [PubMed] [Google Scholar]
- 21.Peng J, et al. Stabilization of MCRS1 by BAP1 prevents chromosome instability in renal cell carcinoma. Cancer Lett. 2015;369:167–74. doi: 10.1016/j.canlet.2015.08.013. [DOI] [PubMed] [Google Scholar]
- 22.Pan H, et al. BAP1 regulates cell cycle progression through E2F1 target genes and mediates transcriptional silencing via H2A monoubiquitination in uveal melanoma cells. Int J Biochem Cell Biol. 2015;60:176–84. doi: 10.1016/j.biocel.2015.01.001. [DOI] [PubMed] [Google Scholar]
- 23.Ramaker RC, et al. RNA sequencing-based cell proliferation analysis across 19 cancers identifies a subset of proliferation-informative cancers with a common survival signature. Oncotarget. 2017;8:38668–38681. doi: 10.18632/oncotarget.16961. [DOI] [PMC free article] [PubMed] [Google Scholar]
- 24.Tomasetti C, Li L, Vogelstein B. Stem cell divisions, somatic mutations, cancer etiology, and cancer prevention. Science. 2017;355:1330–1334. doi: 10.1126/science.aaf9011. [DOI] [PMC free article] [PubMed] [Google Scholar]
- 25.Zehir A, et al. Mutational landscape of metastatic cancer revealed from prospective clinical sequencing of 10,000 patients. Nat Med. 2017;23:703–713. doi: 10.1038/nm.4333. [DOI] [PMC free article] [PubMed] [Google Scholar]
- 26.Armenia J, et al. The long tail of oncogenic drivers in prostate cancer. doi: 10.1038/s41588-018-0078-z. Submitted. [DOI] [PMC free article] [PubMed] [Google Scholar]
- 27.Hieronymus H, et al. Copy number alteration burden predicts prostate cancer relapse. Proc Natl Acad Sci U S A. 2014;111:11139–44. doi: 10.1073/pnas.1411446111. [DOI] [PMC free article] [PubMed] [Google Scholar]
- 28.Taylor BS, et al. Integrative genomic profiling of human prostate cancer. Cancer Cell. 2010;18:11–22. doi: 10.1016/j.ccr.2010.05.026. [DOI] [PMC free article] [PubMed] [Google Scholar]
- 29.Punt CJ, Koopman M, Vermeulen L. From tumour heterogeneity to advances in precision treatment of colorectal cancer. Nat Rev Clin Oncol. 2017;14:235–246. doi: 10.1038/nrclinonc.2016.171. [DOI] [PubMed] [Google Scholar]
- 30.Hart CD, et al. Challenges in the management of advanced, ER-positive, HER2-negative breast cancer. Nat Rev Clin Oncol. 2015;12:541–52. doi: 10.1038/nrclinonc.2015.99. [DOI] [PubMed] [Google Scholar]
- 31.Zardavas D, Irrthum A, Swanton C, Piccart M. Clinical management of breast cancer heterogeneity. Nat Rev Clin Oncol. 2015;12:381–94. doi: 10.1038/nrclinonc.2015.73. [DOI] [PubMed] [Google Scholar]
- 32.Chandarlapaty S, et al. Prevalence of ESR1 Mutations in Cell-Free DNA and Outcomes in Metastatic Breast Cancer: A Secondary Analysis of the BOLERO-2 Clinical Trial. JAMA Oncol. 2016;2:1310–1315. doi: 10.1001/jamaoncol.2016.1279. [DOI] [PMC free article] [PubMed] [Google Scholar]
- 33.Toy W, et al. ESR1 ligand-binding domain mutations in hormone-resistant breast cancer. Nat Genet. 2013;45:1439–45. doi: 10.1038/ng.2822. [DOI] [PMC free article] [PubMed] [Google Scholar]
- 34.Cheng DT, et al. Memorial Sloan Kettering-Integrated Mutation Profiling of Actionable Cancer Targets (MSK-IMPACT): A Hybridization Capture-Based Next-Generation Sequencing Clinical Assay for Solid Tumor Molecular Oncology. J Mol Diagn. 2015;17:251–64. doi: 10.1016/j.jmoldx.2014.12.006. [DOI] [PMC free article] [PubMed] [Google Scholar]
- 35.Vivian J, et al. Toil enables reproducible, open source, big biomedical data analyses. Nat Biotechnol. 2017;35:314–316. doi: 10.1038/nbt.3772. [DOI] [PMC free article] [PubMed] [Google Scholar]
- 36.Venet D, Dumont JE, Detours V. Most random gene expression signatures are significantly associated with breast cancer outcome. PLoS Comput Biol. 2011;7:e1002240. doi: 10.1371/journal.pcbi.1002240. [DOI] [PMC free article] [PubMed] [Google Scholar]
- 37.Peduzzi P, Concato J, Kemper E, Holford TR, Feinstein AR. A simulation study of the number of events per variable in logistic regression analysis. J Clin Epidemiol. 1996;49:1373–9. doi: 10.1016/s0895-4356(96)00236-3. [DOI] [PubMed] [Google Scholar]
- 38.Niu B, et al. MSIsensor: microsatellite instability detection using paired tumor-normal sequence data. Bioinformatics. 2014;30:1015–6. doi: 10.1093/bioinformatics/btt755. [DOI] [PMC free article] [PubMed] [Google Scholar]
Associated Data
This section collects any data citations, data availability statements, or supplementary materials included in this article.
Supplementary Materials
All patients analyzed here annotated for their cancer type, specimen type, WGD status, and available clinical outcome information.
Data Availability Statement
All primary genomic results and associated specimen annotation for all patients in this study are accessible as described for the original cohort (ref. 10) and were deposited into the cBioPortal for Cancer Genomics for analysis and visualization at http://cbioportal.org/msk-impact.


